Page 3 of 17 FirstFirst 1 2 3 4 5 13 ... LastLast
Results 21 to 30 of 167

Daily Forex Analysis By FXGlory

This is a discussion on Daily Forex Analysis By FXGlory within the Analytics and News forums, part of the Trading Forum category; BTCUSD analysis for 18.04.2024 Time Zone: GMT +2 Time Frame: 4 Hours (H4) Fundamental Analysis: Bitcoin's valuation against the US ...


  1. #21
    Senior Member FXGlory Ltd's Avatar
    Join Date
    Mar 2024
    Posts
    168

    Visit FXGlory Ltd's Youtube Channel

    Daily Forex Analysis By FXGlory

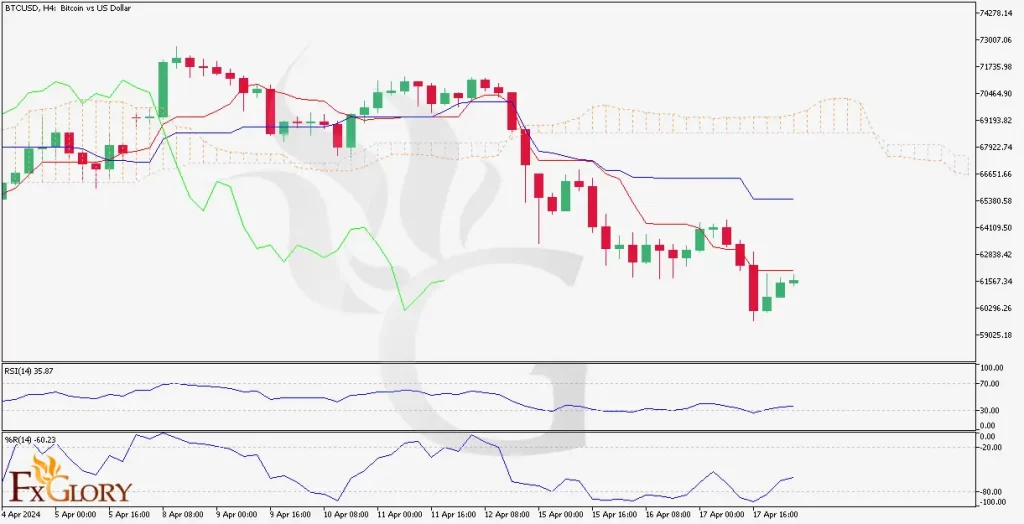
    BTCUSD analysis for 18.04.2024


    Time Zone: GMT +2
    Time Frame: 4 Hours (H4)


    Fundamental Analysis:

    Bitcoin's valuation against the US Dollar is greatly influenced by a mix of market sentiment, technological developments, regulatory news, and macroeconomic trends. Global economic uncertainties and inflation rates are fundamental factors that can drive investors toward Bitcoin as a potential hedge. Additionally, changes in regulatory stances in key markets, such as recent legislation or enforcement actions, can significantly impact Bitcoin's price. The growing interest in decentralized finance (DeFi) and institutional investment in cryptocurrency also contribute to BTCUSD dynamics.


    Price Action:

    The H4 timeframe for BTCUSD shows a downtrend with the price moving below the Ichimoku cloud and key moving averages. The market has been forming lower highs and lower lows, which is indicative of a bearish sentiment in the short to medium term. There has been a slight recovery in the most recent price action, but the market remains under bearish pressure.


    Key Technical Indicators:

    Williams %R: The Williams Percentage is currently indicating oversold conditions, which could hint at a potential short-term reversal if buyers step in.

    RSI (Relative Strength Index): The RSI is below the 50 threshold, which typically suggests bearish momentum, although it is not in the oversold territory, leaving room for potential downward movement.

    Ichimoku Cloud: Price is trading below the Ichimoku cloud, indicating that the path of least resistance is to the downside and confirming the current bearish trend.


    Support and Resistance:

    Support: The nearest support is found at the recent low around $59,025, with a more substantial support zone near $58,000.

    Resistance: Immediate resistance can be seen near the lower boundary of the Ichimoku cloud, followed by a stronger resistance at the $62,388 level, which aligns with the cloud's upper boundary.


    Conclusion and Consideration:

    The BTCUSD pair on the H4 chart is exhibiting bearish tendencies with the price action and technical indicators suggesting a continuation of the downtrend. The market could be ripe for a short-term bounce due to the oversold Williams %R indicator, but the overarching trend remains downward. It’s critical for traders to keep an eye on global economic indicators and crypto-specific news, which could abruptly influence the market. Implementing robust risk management strategies is vital, particularly given Bitcoin’s historical volatility.


    Disclaimer: The provided analysis is for informational purposes only and does not constitute investment advice. Traders should conduct their own research and analysis before making any trading decisions.


    FxGlory
    18.04.2024
    Last edited by FXGlory Ltd; 04-19-2024 at 04:46 AM.

  2. #22
    Senior Member FXGlory Ltd's Avatar
    Join Date
    Mar 2024
    Posts
    168

    Visit FXGlory Ltd's Youtube Channel
    BCHUSD analysis for 19.04.2024


    Time Zone: GMT +2
    Time Frame: 4 Hours (H4)


    Fundamental Analysis:

    Bitcoin Cash (BCH) trades against the US Dollar in the BCHUSD pair. As a cryptocurrency, BCH is influenced by factors such as regulatory news, technological advancements, and the overall sentiment in the crypto market. Given that Bitcoin Cash is a fork of Bitcoin, its value can also be affected by the performance and changes in the larger Bitcoin ecosystem. Market liquidity and adoption rates of BCH for transactions and by exchanges play a crucial role as well.


    Price Action:
    On the H4 chart for BCHUSD, there is a clear bearish trend in progress with the price action creating lower highs and lower lows. Recently, the price has consolidated, forming a slight range as buyers and sellers negotiate the next move. This consolidation is within the context of the larger downtrend, indicating hesitancy among traders.


    Key Technical Indicators:
    Bollinger Bands:
    The price is currently near the middle Bollinger Band, showing a neutral position but within a downtrend context.
    MACD (Moving Average Convergence Divergence): The MACD line is below the signal line and the histogram bars are on the downside, reinforcing the bearish momentum.
    RSI (Relative Strength Index): The RSI is near the 40 mark, suggesting bearish momentum without being in the oversold territory, leaving room for further downward movement.


    Support and Resistance:
    Support: The nearest support level can be identified around the $460 price zone, where recent lows have formed.
    Resistance: The first layer of resistance appears to be at the 0.618 Fibonacci retracement level, near $490, with further resistance possible at the upper Bollinger Band.


    Conclusion and Consideration:
    The BCHUSD pair is currently in a bearish phase on the H4 chart, with technical indicators supporting the continuation of this trend. However, there is potential for a short-term pullback, considering the market's attempt to stabilize recently. It's important for traders to watch for a decisive break out of the current range for direction, and keep an eye on broader market sentiment and news which can significantly impact cryptocurrencies like BCH. Proper risk management should be a priority due to the inherent volatility in the crypto market.


    Disclaimer: The provided analysis is for informational purposes only and does not constitute investment advice. Traders should conduct their own research and analysis before making any trading decisions.


    FxGlory
    19.04.2024

  3. #23
    Senior Member FXGlory Ltd's Avatar
    Join Date
    Mar 2024
    Posts
    168

    Visit FXGlory Ltd's Youtube Channel

    Red face Daily Forex Analysis By FXGlory

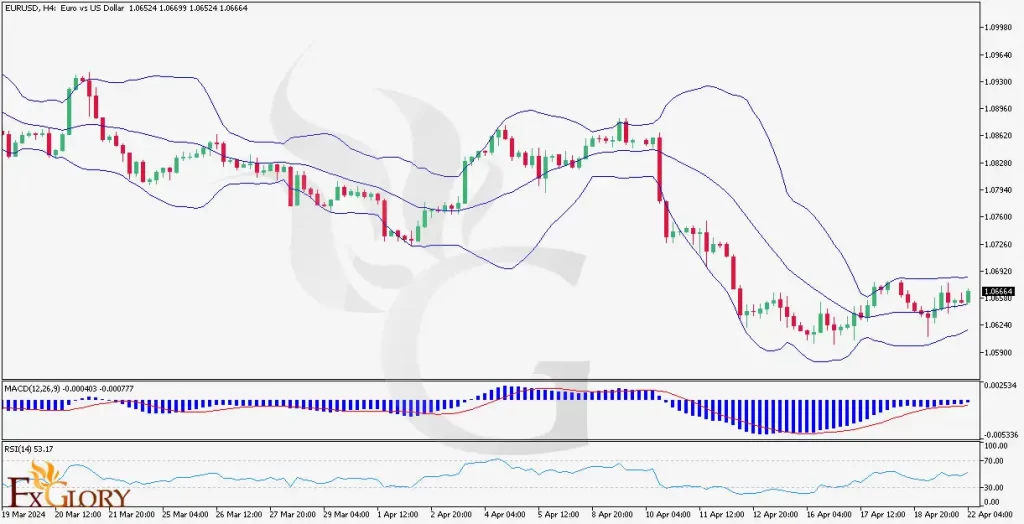
    EURUSD analysis for 22.04.2024


    Time Zone: GMT +2
    Time Frame: 4 Hours (H4)


    Fundamental Analysis:

    The EUR/USD currency pair is highly influenced by economic policies, interest rates, and economic data from both the Eurozone and the United States. With the European Central Bank's monetary policy decisions, including changes in interest rates or asset purchasing programs, traders should carefully consider their impact on the euro. Similarly, U.S. Federal Reserve policies, inflation reports, and employment data are critical for the USD's strength. Geopolitical tensions and trade relations between the U.S. and Europe can also sway the pair's direction. Current fiscal stimulus or austerity measures within the Eurozone may further affect the EUR/USD dynamics.


    Price Action:

    In the H4 timeframe, EUR/USD appears to be consolidating after a significant downtrend, forming a potential base for a reversal. The pair has been making a sequence of higher lows, which may indicate a gradual shift in market sentiment. The current price has bounced off the recent lows, suggesting a pause in the bearish momentum and a possible preparation for an upward move.


    Key Technical Indicators:

    Bollinger Bands: The price is trading near the middle Bollinger Band, indicating a neutral market. A breach above the upper band could signal increasing volatility and potential uptrend acceleration.

    RSI (Relative Strength Index): With an RSI reading of around 53.17, there is neither overbought nor oversold pressure, suggesting balanced market conditions.

    MACD (Moving Average Convergence Divergence): The MACD histogram is showing positive bars, and the MACD line is above the signal line, hinting at growing bullish momentum.


    Support and Resistance:

    Support: The recent low at around 1.06500 acts as the immediate support level, with further support potentially near the lower Bollinger Band.

    Resistance: The immediate resistance can be found near the recent high around 1.06920, with additional resistance possibly at the upper Bollinger Band.


    Conclusion and Consideration:

    The EUR/USD on the H4 chart is showing signs of a consolidation phase with potential for a bullish reversal as indicated by the positive MACD. However, the market remains cautious, as reflected by the RSI. Traders might anticipate a breakout above immediate resistance for a stronger bullish confirmation. It is important to consider the ongoing and upcoming economic events in both the U.S. and Europe, as they can significantly influence the pair's movement. Risk management strategies should be in place to navigate the pair's volatility and potential reactions to economic data releases.


    Disclaimer: The provided analysis is for informational purposes only and does not constitute investment advice. Traders should conduct their own research and analysis before making any trading decisions.


    FxGlory
    22.04.2024

  4. #24
    Senior Member FXGlory Ltd's Avatar
    Join Date
    Mar 2024
    Posts
    168

    Visit FXGlory Ltd's Youtube Channel

    Red face

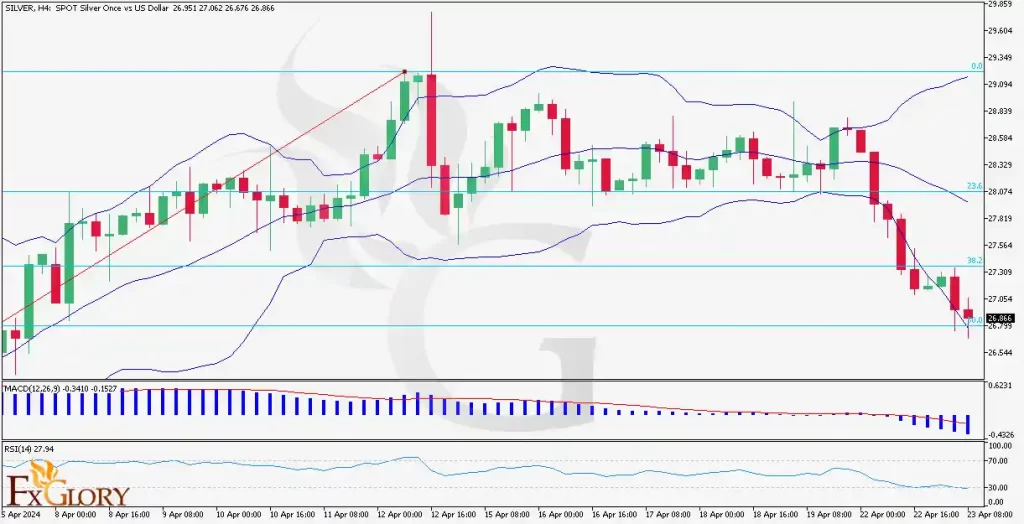
    SILVER analysis for 23.04.2024


    Time Zone: GMT +2
    Time Frame: 4 Hours (H4)


    Fundamental Analysis:

    Silver, as depicted by the SILVER/USD currency pair, is influenced by a spectrum of fundamental factors including industrial consumption, mining output, and economic indicators that drive the US Dollar, like interest rates and inflation figures. Silver's dual nature as an industrial metal and a monetary instrument means its demand could be shaped by technological advancements and economic trends. The metal's price is also sensitive to global political climate shifts and its correlation with other commodities, especially within the precious metals sector.


    Price Action:
    The H4 chart reveals that silver has been undergoing a strong bearish trend, evidenced by a consistent series of lower lows and lower highs. The recent price movement has breached past the lower Bollinger Band, indicating a strong downward push. However, this could also signify potential overselling, warranting caution for any continuation of the trend.


    Key Technical Indicators:
    Bollinger Bands:
    Price has broken below the lower Bollinger Band, suggesting an extension of the bearish move or a potential retracement if it is an oversold situation.
    MACD: The MACD line remains below the signal line and continues to diverge negatively, which supports the bearish momentum observed in the price action.
    RSI: The RSI is firmly in the oversold territory, signaling a significant bearish strength that might lead to a possible reversal if buyers step in.


    Support and Resistance Levels:

    Support: Immediate support is found at the recent low of the price action, with further support potentially near the 27.05 mark.
    Resistance: The previous low around the 26.75 level may now act as resistance, with additional resistance likely at the midline of the Bollinger Bands.


    Conclusion and Considerations:
    In summary, SILVERUSD is exhibiting strong bearish momentum as indicated by the technical indicators and recent price action. While the oversold RSI suggests a potential pullback, the prevailing downward trend could persist if the bearish sentiment continues. Traders should consider the impact of macroeconomic factors and market sentiment on silver prices and employ prudent risk management strategies. Monitoring for any signs of a reversal or stabilization around key support levels would be crucial for traders looking to enter positions.


    Disclaimer: This analysis is intended for informational purposes only and should not be construed as financial advice. It is important for individuals to perform their own due diligence before engaging in trading activities.


    FxGlory
    23.04.2024

  5. #25
    Senior Member FXGlory Ltd's Avatar
    Join Date
    Mar 2024
    Posts
    168

    Visit FXGlory Ltd's Youtube Channel

    Red face Daily Forex Analysis By FXGlory

    Platinum analysis for 24.04.2024


    Time Zone: GMT +2
    Time Frame: 4 Hours (H4)


    Fundamental Analysis:

    Platinum's price is largely influenced by supply-demand dynamics, industrial usage, especially in automotive catalytic converters, and investment demand. It's important to consider the industrial health and economic indicators such as automobile sales, manufacturing data, and investment trends which can drive platinum prices. Additionally, mining supply disruptions or changes in recycling volumes can impact the market significantly.


    Price Action:

    The platinum market on the H4 chart has been experiencing a downtrend, evidenced by the formation of lower highs and lower lows. Recently, there seems to be a slight bullish retracement, as the price has moved up from its latest low. This could suggest a temporary slowing down of the downward trend, possibly presenting a short-term buying opportunity.


    Key Technical Indicators:

    Bollinger Bands: Platinum's price is hovering around the lower Bollinger Band, which usually indicates an oversold condition or a strong downtrend. A push back towards the middle band could signal a temporary reversal or consolidation.

    RSI (Relative Strength Index): The RSI is below the 50-level, indicating bearish momentum. However, it is not in the oversold territory, leaving room for further downward movement or a potential reversal if the market sentiment shifts.

    MACD (Moving Average Convergence Divergence): The MACD line is below the signal line and the histogram shows an increase in negative momentum, reinforcing the current bearish trend.


    Support and Resistance:

    Support: The most recent low acts as the immediate support level. Should the price break below this level, it may find further support near previous lows not visible on the current chart frame.

    Resistance: Immediate resistance may be encountered at the level where the retracement began. A more significant resistance level would be where the price intersects with the middle Bollinger Band.


    Conclusion and Consideration:

    The current technical outlook for platinum on the H4 chart suggests a continuation of the bearish trend with a minor retracement in the short term. Traders should monitor the RSI for signs of a reversal and the MACD for changes in momentum. It is crucial to keep abreast of industrial and economic developments that could affect platinum prices. Risk management remains essential due to the inherent volatility in the commodities market.


    Disclaimer: The provided analysis is for informational purposes only and does not constitute investment advice. Traders should conduct their own research and analysis before making any trading decisions.


    FxGlory
    24.04.2024
    Last edited by FXGlory Ltd; 04-26-2024 at 03:09 AM.

  6. #26
    Senior Member FXGlory Ltd's Avatar
    Join Date
    Mar 2024
    Posts
    168

    Visit FXGlory Ltd's Youtube Channel

    Daily Forex Analysis By FXGlory

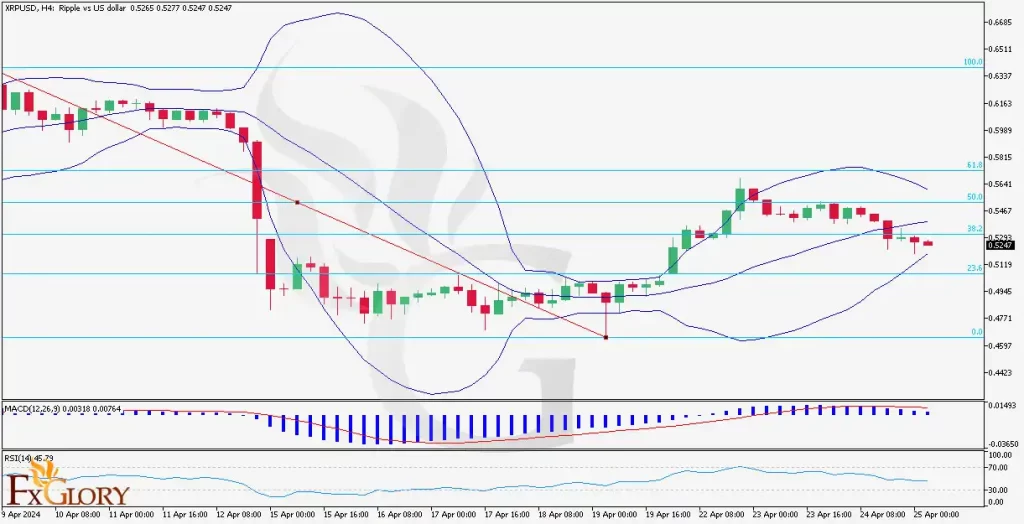
    XRPUSD analysis for 25.04.2024


    Time Zone: GMT +2
    Time Frame: 4 Hours (H4)


    Fundamental Analysis:

    XRP, often known as Ripple, is a cryptocurrency that operates on a digital payment platform known as Ripple Net, which is on top of a distributed ledger database called XRP Ledger. XRP's price can be influenced by regulatory news concerning cryptocurrencies, partnerships secured by Ripple with financial institutions, and the overall sentiment in the crypto market. Additionally, legal proceedings, such as the ongoing SEC lawsuit, can have a significant impact on XRP's price. Its utility in enabling rapid and cost-effective cross-border transactions makes it sensitive to changes in international remittance volumes and financial sector technology adoption.


    Price Action:

    The H4 chart for XRPUSD indicates a period of consolidation following a recent uptrend. Price action has seen the formation of smaller body candles with wicks on both sides, suggesting indecision in the market. The consolidation appears to be occurring around the 38.2% Fibonacci retracement level, acting as a potential pivot point for the next directional move.


    Key Technical Indicators:

    Bollinger Bands: The price is trending just above the middle Bollinger Band, suggesting a neutral to slight bullish bias in the short term.

    RSI (Relative Strength Index): The RSI is around the 45 mark, which is neutral territory, suggesting no clear momentum to the upside or downside.

    MACD (Moving Average Convergence Divergence): The MACD histogram is positive, but the MACD line is close to the signal line, indicating that bullish momentum is not strong.


    Support and Resistance:

    Support: The immediate support for XRPUSD is the 38.2% Fibonacci level, followed by the lower Bollinger Band and the 23.6% retracement level.

    Resistance: On the upside, the 50% Fibonacci level acts as the first resistance, with further resistance possibly at the 61.8% level and the upper Bollinger Band.


    Conclusion and Consideration:

    The technical setup for XRPUSD on the H4 chart suggests a wait-and-see approach as the market digests its recent gains and decides on its next move. The near-term indicators lean slightly bullish but call for caution as they show no strong momentum. Given the current consolidation phase, a breakout above the 50% Fibonacci level could indicate the resumption of the uptrend, while a fall below the 38.2% level might hint at a deeper retracement. It is crucial to consider the impact of ongoing legal challenges and macroeconomic factors influencing the cryptocurrency market when making trading decisions.


    Disclaimer: The analysis provided is for informational purposes only and should not be considered as investment advice. Market participants should conduct their independent research and exercise caution when trading in volatile markets.


    FxGlory
    25.04.2024

  7. #27
    Senior Member FXGlory Ltd's Avatar
    Join Date
    Mar 2024
    Posts
    168

    Visit FXGlory Ltd's Youtube Channel

    Red face Daily Forex Analysis By FXGlory

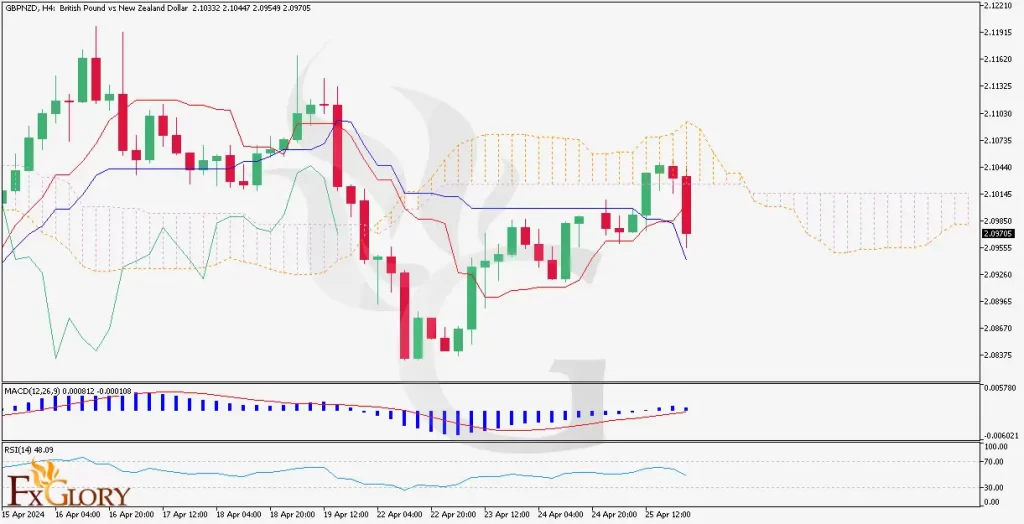
    GBPNZD analysis for 26.04.2024


    Time Zone: GMT +2
    Time Frame: 4 Hours (H4)


    Fundamental Analysis:
    The GBPNZD pair reflects the economic dynamics between the UK and New Zealand. Factors such as interest rate differentials, economic releases from both nations, and global risk sentiment significantly influence this pair. The UK’s economic health can be assessed by indicators like GDP, employment data, and Brexit developments, while New Zealand’s dairy exports and tourism sector are critical to its currency's strength. Trade relations and commodity price fluctuations also play pivotal roles in the direction of this pair.


    Price Action:
    On the H4 chart, GBPNZD has shown volatility with a mix of bullish and bearish candlesticks. Recently, there has been a slight bearish movement, indicated by the presence of long upper wicks, suggesting rejection at higher levels. The price has fluctuated around the Ichimoku cloud, indicating uncertainty and a potential transition phase.


    Key Technical Indicators:
    Ichimoku:
    Price is interacting with the Ichimoku Cloud, which suggests indecision in the market. The cloud ahead appears to be turning bullish, potentially forecasting an upcoming positive trend.
    MACD: The MACD histogram shows weak momentum as it hovers around the baseline, with the MACD line slightly above the signal line, indicating a weak bullish momentum.
    RSI: The RSI is near the 50-level, which is neutral territory, suggesting a balance between buyers and sellers without clear dominance from either side.


    Support and Resistance:

    Support: The nearest support is observed around the lower boundary of the Ichimoku Cloud.
    Resistance: Immediate resistance can be identified at the recent highs just above the cloud.


    Conclusion and Consideration:

    The GBPNZD pair is currently exhibiting signs of indecision. The mixed signals from the technical indicators suggest traders should proceed with caution. Considering the fundamental backdrop, traders should stay attuned to economic releases and policy decisions from the UK and New Zealand. Risk management is crucial, as the market could pivot in either direction. A break above the Ichimoku cloud could signal bullish momentum, while a drop below could indicate bearish pressure.


    Disclaimer: The analysis provided is for informational purposes only and should not be construed as investment advice. Always perform your own due diligence before making trading decisions.


    FxGlory
    26.04.2024

  8. #28
    Senior Member FXGlory Ltd's Avatar
    Join Date
    Mar 2024
    Posts
    168

    Visit FXGlory Ltd's Youtube Channel
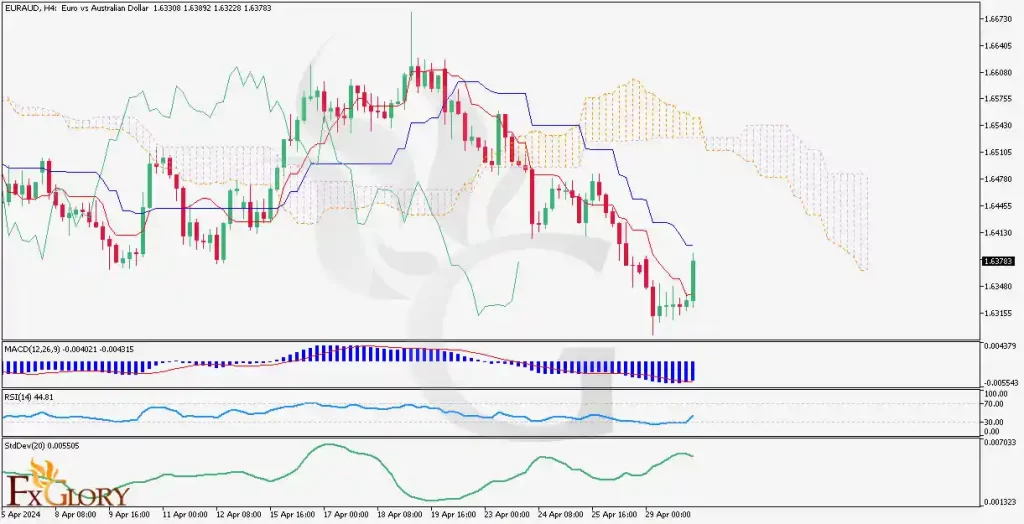
    EURAUD analysis for 30.04.2024


    Time Zone: GMT +2
    Time Frame: 4 Hours (H4)


    Fundamental Analysis:
    The EUR/AUD pair is greatly influenced by the economic health and monetary policies of the Eurozone and Australia. Interest rate differentials, economic growth disparity, and global risk sentiment are key drivers. Europe's energy situation and Australia's export performance, particularly in minerals and resources, provide additional context. The Euro might be pressured by internal political dynamics, while the Australian Dollar might react to commodity cycles and trade relationships, especially with China.


    Price Action:
    The downtrend indicated in the H4 chart has shown signs of a potential pause or reversal, with the last candle closing positively and the ongoing candle showing a sharp rise. This could indicate buying pressure entering the market, suggesting a bullish retracement or even a reversal if further bullish candles follow.


    Key Technical Indicators:
    Ichimoku Cloud:
    Price below the cloud suggests a bearish trend; however, a short-term bullish signal might be emerging if price breaks above the cloud.
    MACD: Current positioning below the signal line points to bearish momentum, but convergence towards the signal line could indicate weakening bearish momentum.
    RSI: Slightly below the mid-point at 44.81, suggesting neither overbought nor oversold conditions, aligning with a potential turning point in market sentiment.
    Standard Deviation (StdDev): Low StdDev points to a consolidating market, which could precede a breakout.


    Support and Resistance:
    Support:
    The chart suggests 1.6375 as a recent support level where the price has shown some rebound.
    Resistance: Resistance is anticipated around 1.6450, indicated by recent price peaks and the Ichimoku cloud's lower boundary.


    Conclusion and Consideration:
    The EUR/AUD pair, in the current H4 timeframe, suggests a bearish trend with potential early signs of a bullish correction. The recent positive closure of a candle and an ongoing sharp rise could provide opportunities for a bullish entry with caution. Traders should closely monitor upcoming fundamental data releases affecting both the Euro and the Australian Dollar. It is essential to apply prudent risk management, considering the volatility inherent in the forex market.


    Disclaimer: This analysis is for informational purposes only and does not constitute investment advice. Traders should perform their own due diligence before making any investment decisions. own research and analysis before making any trading decisions.


    FxGlory
    30.04.2024

  9. #29
    Senior Member FXGlory Ltd's Avatar
    Join Date
    Mar 2024
    Posts
    168

    Visit FXGlory Ltd's Youtube Channel

    Red face Daily Forex Analysis By FXGlory

    USCAD analysis for 01.05.2024


    Time Zone: GMT +2
    Time Frame: 4 Hours (H4)


    Fundamental Analysis:

    The USD/CAD pair reflects the economic interplay between the United States and Canada, with factors like oil prices, trade policies, and relative economic performance playing significant roles. The strength of the US dollar is influenced by America's economic indicators, Federal Reserve policies, and global market sentiment. Conversely, the Canadian dollar often reacts to shifts in commodity prices, especially crude oil, given Canada's status as a major exporter. Additionally, economic data releases from both countries, such as employment statistics and GDP reports, provide critical context for currency valuation.


    Price Action:

    The recent price action on the USD/CAD H4 chart shows a pronounced upward movement, breaking past previous resistance levels. This rally indicates a strong bullish sentiment, potentially driven by favorable economic data or shifts in risk appetite. The price has just breached the Ichimoku Cloud, suggesting a shift from a bearish to a bullish market environment.


    Key Technical Indicators:

    Ichimoku Cloud: The price moving above the Ichimoku Cloud indicates a potential change in trend from bearish to bullish.

    RSI: The Relative Strength Index is approaching 70, pointing towards increasing bullish momentum, though nearing overbought conditions which could suggest a future pullback or consolidation.

    Volume: There is noticeable increase in trading volume accompanying the price rise, supporting the strength of the current move.


    Support and Resistance:

    Support: The key support level now sits at the top boundary of the Ichimoku Cloud, around 1.3720, which could serve as a new baseline for the currency pair.

    Resistance: The next major resistance level is near the recent high around 1.3785, which might challenge further upward movements.


    Conclusion and Consideration:

    The USD/CAD pair, in the current H4 timeframe, exhibits a bullish trend with strong upward momentum as indicated by the breakout above the Ichimoku Cloud and supported by robust volume. Traders should consider the potential for overbought conditions as indicated by the RSI and prepare for possible resistance at higher levels. Monitoring upcoming economic releases from both the U.S. and Canada will be crucial in maintaining an informed trading strategy. Effective risk management remains essential, given the inherent volatility in the forex market.


    Disclaimer: This analysis is for informational purposes only and does not constitute investment advice. Traders should perform their own due diligence before making any investment decisions. own research and analysis before making any trading decisions.


    FxGlory
    01.05.2024

  10. #30
    Senior Member FXGlory Ltd's Avatar
    Join Date
    Mar 2024
    Posts
    168

    Visit FXGlory Ltd's Youtube Channel

    Daily Forex Analysis By FXGlory

    USDCAD analysis for 05.02.2024


    Time Zone: GMT +2
    Time Frame: 4 Hours (H4)


    Fundamental Analysis:

    The USD/CAD currency pair, often referred to as the "Loonie," mirrors the exchange rate between the U.S. Dollar and the Canadian Dollar. Key economic factors include oil prices due to Canada's substantial crude exports, interest rate differentials set by the Federal Reserve and the Bank of Canada, and trade balance data between the U.S. and Canada. Additionally, geopolitical events and market sentiment towards the U.S. dollar globally play essential roles in influencing this pair. Recent data suggest a mixed economic outlook for both countries, potentially leading to heightened volatility in the USD/CAD exchange rate.


    Price Action:

    The H4 timeframe exhibits a recent pullback in the USD/CAD pair after a significant uptrend. The pair has formed consecutive bearish candles, suggesting a possible corrective phase or even a trend reversal. Despite this, the price remains within the Ichimoku cloud, indicating uncertainty in the current trend with a potential for range-bound movement until a clearer signal emerges.


    Key Technical Indicators:

    Ichimoku Cloud: The pair is trading within the Ichimoku Cloud, suggesting a lack of clear trend direction in the near term. The cloud acts as a support area currently but is becoming thinner, indicating potential volatility ahead.

    MACD (Moving Average Convergence Divergence): The MACD histogram is trending below the signal line, demonstrating bearish momentum, but the lines are close to zero, suggesting weak momentum overall.

    RSI (Relative Strength Index): RSI is near the 50 mark, which indicates a neutral momentum state and supports the idea of an indecisive market at the moment.

    Standard Deviation (StdDev): A low standard deviation points to a period of low volatility, which typically suggests a consolidation phase after the recent price movements.


    Support and Resistance:

    Support: The initial support is around 1.3680, marking the recent lows.

    Resistance: Resistance can be seen near 1.3740, aligning with the upper edge of the Ichimoku cloud and recent high points.


    Conclusion and Consideration:

    The USD/CAD in the H4 chart currently exhibits a period of consolidation within the Ichimoku cloud, coupled with bearish signals from the MACD and neutral RSI readings, suggesting a cautious approach. Traders should keep an eye on oil price fluctuations and upcoming economic announcements from both the U.S. and Canada, which could drive the next significant move in this pair. Market participants should prepare for possible breakouts or continuations of the trend depending on external economic influences and technical confirmations.


    Disclaimer: The provided analysis is for informational purposes only and does not constitute investment advice. Traders should conduct their own research and analysis before making any trading decisions.


    FxGlory
    05.02.2024

Page 3 of 17 FirstFirst 1 2 3 4 5 13 ... LastLast

Bookmarks

Posting Permissions

  • You may not post new threads
  • You may not post replies
  • You may not post attachments
  • You may not edit your posts
  •