
 4Likes
 LinkBack URL
 About LinkBacks


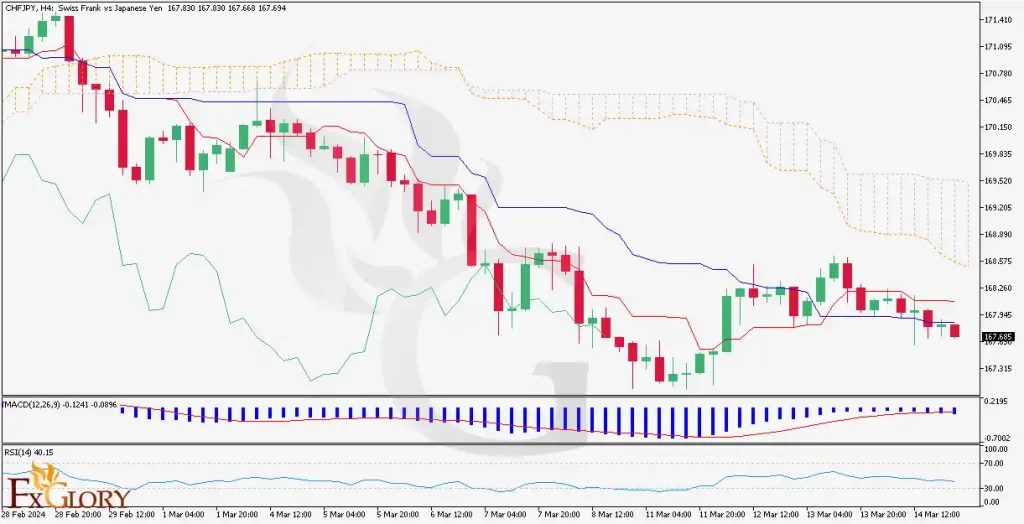
CHFJPY analysis for 28.03.2024
Time Zone: GMT +2
Time Frame: 4 Hours (H4)
Fundamental Analysis:
The Swiss Franc (CHF) is often considered a 'safe-haven' currency and may appreciate during global economic uncertainty, while the Japanese Yen (JPY) is influenced by Japan's economic indicators and Bank of Japan's monetary policy. Factors such as Swiss National Bank's interest rate decisions, global risk sentiment, and economic data releases from both Switzerland and Japan can significantly impact the CHF/JPY pair. Japan's export data can particularly affect the JPY due to the country's export-driven economy. The ongoing global trade tensions and market volatility can also drive investor movement between these two currencies.
Price Action:
On the H4 chart of CHF/JPY, the price action indicates a downtrend, as evidenced by consistent lower highs and lower lows. The market has shown a bearish bias over the observed period, with the price moving below the Ichimoku cloud. The recent candles are forming near the lower boundary of the cloud, suggesting that the downtrend is still intact.
Key Technical Indicators:
chimoku Cloud: The price is below the cloud, and the cloud is bearish, indicating a strong downtrend. The future cloud appears to be bearish as well, suggesting the downtrend may continue.
MACD (Moving Average Convergence Divergence): The MACD line is below the signal line and the histogram bars are below the zero line, both of which support the bearish momentum in the market.
RSI (Relative Strength Index): The RSI is below 50, hovering around 40, which aligns with the bearish sentiment, indicating that the sellers are currently dominating but not yet in oversold territory.
Support and Resistance:
Support: The nearest support level can be identified around the recent lows at 167.315.
Resistance: The immediate resistance level is indicated by the lower boundary of the Ichimoku cloud, around 168.575, with the upper cloud boundary serving as a potential secondary resistance.
Conclusion and Consideration:
The technical analysis of the CHF/JPY on the H4 timeframe presents a bearish picture, with price action and key indicators like the Ichimoku Cloud, MACD, and RSI all pointing to a continuing downtrend. Traders should consider looking for bearish signals and confirmations such as a bounce off the cloud's lower boundary or a further decline in the MACD and RSI to initiate short positions. It's crucial to stay informed about key economic indicators from both countries as they can quickly alter market sentiment. Risk management is essential, and traders should consider setting stop losses above the Ichimoku cloud resistance to mitigate potential losses due to sudden trend reversals.
Disclaimer: The provided analysis is for informational purposes only and does not constitute investment advice. Traders should conduct their own research and analysis before making any trading decisions.
FxGlory
28.03.2024


 Reply With Quote


Bookmarks