Page 9 of 11 FirstFirst ... 7 8 9 10 11 LastLast
Results 81 to 90 of 104

Daily Forex Analysis By FXGlory

This is a discussion on Daily Forex Analysis By FXGlory within the Analytics and News forums, part of the Trading Forum category; EURUSD H4 Technical and Fundamental Analysis for 25.07.2024 Time Zone: GMT +3 Time Frame: 4 Hours (H4) Fundamental Analysis: The ...


  1. #81
    Senior Member FXGlory Ltd's Avatar
    Join Date
    Mar 2024
    Posts
    105

    Visit FXGlory Ltd's Youtube Channel
    EURUSD H4 Technical and Fundamental Analysis for 25.07.2024


    Time Zone: GMT +3
    Time Frame: 4 Hours (H4)


    Fundamental Analysis:
    The EUR/USD forecast today is currently influenced by a series of upcoming economic events and data releases. For the USD, key events include speeches from FOMC members Bowman and Logan, as well as President Biden's announcement. High-impact data such as the Advance GDP q/q, Unemployment Claims, and Durable Goods Orders will also play crucial roles. These events are likely to provide significant volatility in the market. In the Eurozone, the Ifo Business Climate Index and ECB-related announcements will shape market sentiment. Strong US economic data and hawkish tones from FOMC members may strengthen the USD, potentially pushing the EUR/USD pair, also known as the Fiber, lower.


    Price Action:
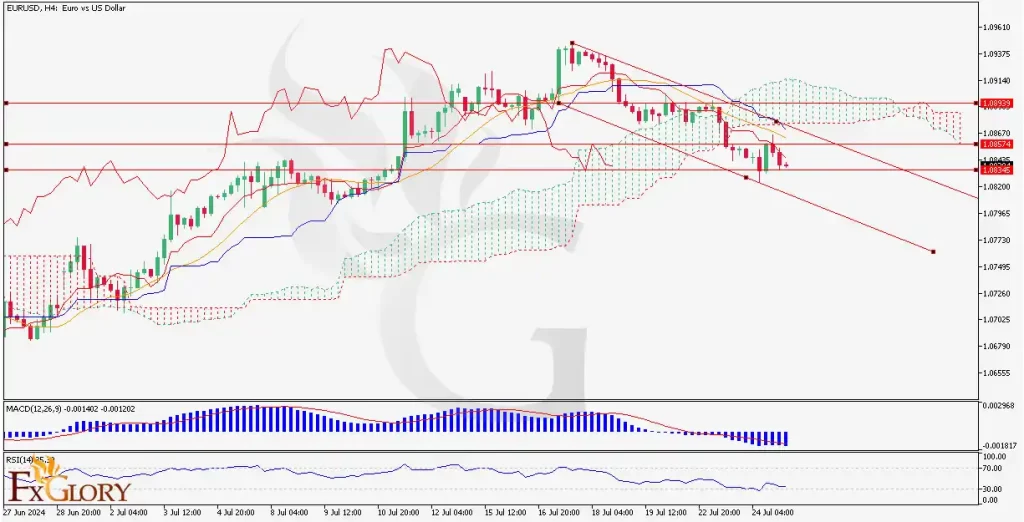
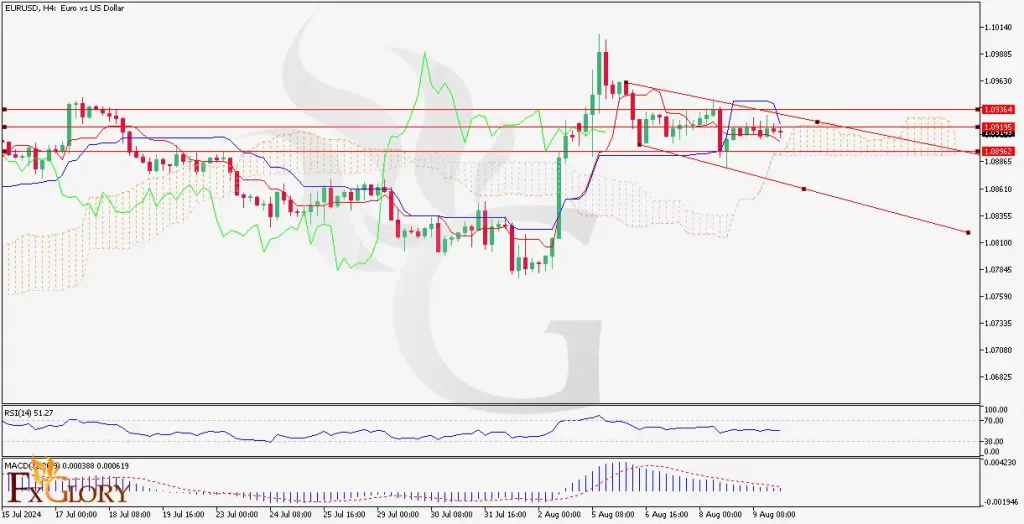
    The EUR/USD H4 chart has recently broken below the Ichimoku cloud, indicating a shift to a bearish trend. The pair is experiencing a downward movement, forming lower highs and lower lows, typical of a bearish trend. The pair’s price action suggests continued downward pressure, with the price finding resistance at the lower boundary of the Ichimoku cloud.


    Key Technical Indicators:
    Ichimoku Cloud:
    The price breaking below the Ichimoku cloud is a bearish signal. The future cloud is bearish as well, with Span A below Span B, indicating potential continued downward momentum.
    RSI (Relative Strength Index): The RSI is around 35.39, which is close to the oversold territory. This indicates that while the bearish momentum is strong, there may be limited room for further immediate decline before a potential correction.
    MACD (Moving Average Convergence Divergence): The MACD indicator shows a negative histogram with the MACD line below the signal line, reinforcing the bearish sentiment. This suggests that downward momentum is currently prevailing.


    Support and Resistance:
    Support Levels:
    Immediate support is found at 1.08345, with stronger support at 1.08000.
    Resistance Levels: Immediate resistance is at 1.08574, followed by 1.08870 and 1.09039. A break above these levels would be required to negate the current bearish trend.


    Conclusion and Consideration:
    The EUR/USD technical analysis on the H4 chart is exhibiting bearish tendencies, confirmed by the price breaking below the Ichimoku cloud and negative signals from the MACD. The RSI suggests the pair is nearing oversold conditions, which could lead to a short-term corrective bounce. However, the overall sentiment remains bearish unless significant resistance levels are breached. As for the Fiber’s fundamental analysis today, traders should closely monitor the upcoming economic data releases and FOMC speeches for further direction. Proper risk management, such as setting stop losses, is crucial in this volatile environment.


    Disclaimer: The provided analysis is for informational purposes only and does not constitute investment advice. Traders should conduct their own research and analysis before making any trading decisions.


    FXGlory
    25.07.2024

  2. #82
    Senior Member FXGlory Ltd's Avatar
    Join Date
    Mar 2024
    Posts
    105

    Visit FXGlory Ltd's Youtube Channel

    Daily Forex Analysis By FXGlory

    GBPUSD H4 Technical and Fundamental Analysis for 29.07.2024


    Time Zone: GMT +3
    Time Frame: 4 Hours (H4)


    Fundamental Analysis:
    The GBP/USD news analysis today is significantly influenced by economic indicators from both the United Kingdom and the United States. For the UK, factors such as changes in the money supply, mortgage approvals, and new credit issuance play crucial roles. The recent data from the Bank of England shows an increase in money circulation and credit issuance, suggesting an optimistic economic outlook. In the US, economic indicators such as interest rates, inflation, and job reports affect the dollar. The upcoming Bank of England reports will provide further insights into the UK's economic health, impacting the GBP/USD forecast today.


    Price Action:
    The GBP/USD H4 chart is exhibiting a downtrend, as indicated by the descending channel formed by the red trend lines. The price is consistently making lower highs and lower lows. The pair also known as the Cable, is struggling to break above the resistance provided by the upper trend line of the channel. This pattern indicates the pair’s bearish sentiment.


    Key Technical Indicators:

    Ichimoku Cloud:
    The price has broken below the Ichimoku Cloud, indicating a bearish trend. The conversion line (Tenkan-sen) is below the baseline (Kijun-sen), supporting the bearish outlook. The cloud ahead is bearish, suggesting continued downward pressure.

    RSI (Relative Strength Index):
    The RSI is currently at 39.70, indicating the market is approaching oversold conditions. A value below 30 would signal an oversold market, potentially leading to a corrective bounce.

    MACD (Moving Average Convergence Divergence):
    The MACD line is below the signal line, and the histogram is in negative territory, signaling bearish momentum. The divergence between the MACD and the signal line suggests a strengthening downward momentum.


    Support and Resistance:

    Support Levels:
    The immediate support level is around 1.26690, which aligns with the lower trend line of the descending channel.

    Resistance Levels:
    The nearest resistance is around 1.29215, where the price has previously attempted to break above but failed.


    Conclusion and Consideration:
    The GBP/USD technical analysis today shows the pair's bearish trend on the H4 timeframe, confirmed by the Ichimoku Cloud, MACD, and RSI indicators. Traders should look for potential sell opportunities, particularly if the price continues to respect the upper trend line of the descending channel. Monitoring upcoming economic releases from both the UK and the US will be crucial as they could influence the Cable’s price action. Traders should also be cautious of any corrective bounces that might occur if the RSI reaches oversold levels.


    Disclaimer: The provided analysis is for informational purposes only and does not constitute investment advice. Traders should conduct their own research and analysis before making any trading decisions.


    FXGlory
    29.07.2024

  3. #83
    Senior Member FXGlory Ltd's Avatar
    Join Date
    Mar 2024
    Posts
    105

    Visit FXGlory Ltd's Youtube Channel
    EURUSD H4 Technical and Fundamental Analysis for 30.07.2024


    Time Zone: GMT +3
    Time Frame: 4 Hours (H4)


    Fundamental Analysis:
    The EUR/USD news analysis today is influenced by various fundamental factors such as macroeconomic indicators, central bank policies, and geopolitical events. For the Euro, recent data releases from INSEE indicate changes in consumer spending and GDP, which are vital for understanding the economic health of the Eurozone. Positive readings typically strengthen the Euro. On the US side, upcoming data on house prices and consumer confidence are crucial. The US Federal Reserve’s monetary policy decisions also play a significant role, with higher interest rates potentially boosting the USD, consequently affecting the pair also known as the Fiber.


    Price Action:
    The EUR/USD H4 chart shows the pair’s clear bearish trend, with the price moving below the Ichimoku cloud, indicating a strong downtrend. The price has recently tested and broken through significant support levels, and there is a descending channel evident, further confirming the bearish sentiment. The Fiber’s price action suggests continued downward pressure unless a significant reversal signal appears.


    Key Technical Indicators:
    Ichimoku Cloud:
    The price is trading below the Ichimoku cloud, indicating bearish momentum. The future cloud is bearish, suggesting that the downtrend might continue. The Tenkan-Sen is below the Kijun-Sen, reinforcing the bearish outlook.
    RSI (Relative Strength Index): The RSI is at 36.35, which is in the bearish zone but not yet oversold. This indicates that there might still be room for further downside before a potential reversal or correction.
    Stochastic Oscillator: The Stochastic is at 20.22/14.21, indicating oversold conditions. This could suggest that a short-term bounce or correction might be on the horizon if the market finds some support.


    Support and Resistance:
    Support Levels:
    The immediate support level is at 1.08148, with further support at 1.07600, the lower bound of the descending channel.
    Resistance Levels: The nearest resistance is at 1.08331, followed by 1.08555 and 1.08842, which are the upper bounds of the recent price consolidation and descending channel.


    Conclusion and Consideration:
    The EUR/USD technical analysis today on the H4 chart shows a strong bearish trend reinforced by key technical indicators. The price is trading below the Ichimoku cloud, the RSI indicates bearish momentum, and the Stochastic suggests oversold conditions. Traders should monitor the support at 1.08148 closely; a break below this level could signal further downside. However, oversold conditions might lead to a short-term corrective bounce. As for the pair’s fundamental analysis, data releases from both the Eurozone and the US could provide additional volatility and direction. Risk management is crucial in such a volatile environment, and setting appropriate stop-loss levels is advised.


    Disclaimer: The provided analysis is for informational purposes only and does not constitute investment advice. Traders should conduct their own research and analysis before making any trading decisions.


    FXGlory
    30.07.2024

  4. #84
    Senior Member FXGlory Ltd's Avatar
    Join Date
    Mar 2024
    Posts
    105

    Visit FXGlory Ltd's Youtube Channel

    Daily Forex Analysis By FXGlory

    EURJPY H4 Technical and Fundamental Analysis for 31.07.2024


    Time Zone: GMT +3
    Time Frame: 4 Hours (H4)


    Fundamental Analysis:

    The EUR/JPY pair is influenced by various fundamental factors, including economic indicators from the Eurozone and Japan. For the Euro (EUR), recent data from the Eurozone's economic performance, particularly GDP growth and inflation rates, are pivotal. Reports from the European Central Bank (ECB) regarding monetary policy also play a crucial role. For the Japanese Yen (JPY), key indicators include the S&P Global Manufacturing PMI and the Bank of Japan's stance on monetary policy. The overall economic health and consumer confidence in both regions are significant drivers for the EUR/JPY pair.

    Price Action:

    The EUR/JPY H4 chart shows a bearish trend, with the recent price action forming lower highs and lower lows. The pair's price has broken below the Ichimoku Cloud, indicating a bearish sentiment. The EUR/JPY pair has recently found support near 164.15 and resistance around 168.01. The formation of a descending pattern suggests further downside potential unless a strong reversal signal emerges.

    Key Technical Indicators:

    Ichimoku Cloud:
    The price is below the Ichimoku Cloud on the EUR/JPY H4 chart, indicating a bearish trend. The Tenkan-sen is below the Kijun-sen, reinforcing the bearish outlook for this pair. The Chikou Span is also below the price, further confirming the bearish sentiment for EUR against JPY.

    MACD (Moving Average Convergence Divergence):
    The MACD line is below the signal line, and the histogram is negative, indicating bearish momentum. The recent contraction of the histogram suggests a potential weakening of the bearish momentum.


    Support and Resistance:

    Support Levels:
    The key support level is at 164.15, which has been tested multiple times and has held.

    Resistance Levels:
    The primary resistance level is at 168.01, with another significant level at 166.08.

    Conclusion and Consideration:

    The EUR/JPY technical analysis on the H4 chart exhibits a strong bearish trend supported by the Ichimoku Cloud and MACD indicators. The EUR/JPY price action suggests a continuation of the downward movement unless a significant reversal signal occurs. Traders should watch for any breakouts above the resistance level of 168.01 or below the support level of 164.15 for potential trade opportunities. It's essential to monitor upcoming economic data releases for the Euro and the Yen, as these can impact the pair's direction. As always, employing proper risk management strategies, including stop losses, is crucial in this volatile market.
    Disclaimer: The provided analysis is for informational purposes only and does not constitute investment advice. Traders should conduct their own research and analysis before making any trading decisions.


    FXGlory
    31.07.2024

  5. #85
    Senior Member FXGlory Ltd's Avatar
    Join Date
    Mar 2024
    Posts
    105

    Visit FXGlory Ltd's Youtube Channel
    GBPUSD H4 Technical and Fundamental Analysis for 08.01.2024


    Time Zone: GMT +3
    Time Frame: 4 Hours (H4)


    Fundamental Analysis:
    The GBP/USD news analysis today is influenced by a variety of fundamental factors. The British Pound is currently affected by the economic outlook in the UK, including inflation rates, interest rates set by the Bank of England, and the overall economic performance as reflected in GDP and employment data. The US Dollar, on the other hand, is influenced by similar factors in the United States, including Federal Reserve policies, inflation rates, and employment figures. Today's economic calendar includes several important data releases for the USD, such as Unemployment Claims and ISM Manufacturing PMI, which are expected to have a high impact on the currency. These releases could provide significant volatility and direction to the GBP/USD pair, also known as the “Cable”.


    Price Action:
    The GBP/USD H4 chart shows the pair trading in a descending channel with clear lower highs and lower lows, indicating the pair’s bearish trend. However, the Cable’s recent price action suggests a consolidation phase around the 1.2830 - 1.2865 range, which may be forming a base for a potential reversal or continuation pattern. The price is currently testing the upper boundary of the channel, indicating a crucial decision point.


    Key Technical Indicators:
    Ichimoku Cloud: The price is trading below the Ichimoku cloud, suggesting a bearish outlook. The cloud ahead is bearish, providing potential resistance for any upward movement.
    RSI (Relative Strength Index): The RSI is around the neutral 49 level, suggesting neither overbought nor oversold conditions. This indicates a lack of strong momentum in either direction, aligning with the current consolidation phase.
    MACD (Moving Average Convergence Divergence): The MACD line is below the signal line, and the histogram is in negative territory, indicating bearish momentum. However, the narrowing histogram suggests weakening bearish momentum, which could precede a bullish crossover.


    Support and Resistance:
    Support Levels: The immediate support levels for the currency pair are at 1.2827 and 1.2810, providing crucial price points where buying interest might emerge to prevent further decline.
    Resistance Levels: The resistance levels are at 1.2846 and 1.2865, acting as key barriers where selling pressure might intensify, potentially halting any upward movement.


    Conclusion and Consideration:
    The GBP/USD technical analysis today shows that the pair is currently in a consolidation phase within a broader downtrend. Key indicators such as the Ichimoku cloud and MACD suggest a bearish bias, while the RSI shows a neutral stance. The upcoming economic releases for the USD, particularly the Unemployment Claims and ISM Manufacturing PMI, could introduce significant volatility to the pair’s forecast. Traders should monitor these data points closely, as they could determine the pair's next direction. A break above the 1.2865 resistance could signal a potential trend reversal, while a drop below 1.2827 could confirm the continuation of the bearish trend.


    Disclaimer: The provided analysis is for informational purposes only and does not constitute investment advice. Traders should conduct their own research and analysis before making any trading decisions.


    FXGlory
    08.01.2024

  6. #86
    Senior Member FXGlory Ltd's Avatar
    Join Date
    Mar 2024
    Posts
    105

    Visit FXGlory Ltd's Youtube Channel
    EURCAD H4 Technical and Fundamental Analysis for 07.08.2024


    Time Zone: GMT +3
    Time Frame: 4 Hours (H4)


    Fundamental Analysis:
    The EURCAD currency pair represents the exchange rate between the Euro (EUR) and the Canadian Dollar (CAD). Recent economic data from both the Eurozone and Canada indicate potential influences on this pair.
    Euro (EUR)
    •German Industrial Production m/m: The latest data shows an increase of 1.0%, a significant recovery from the previous -2.5%. This indicates a rebound in Germany's industrial sector, which is positive for the EUR.
    •German Trade Balance: The trade balance stands at 21.7B, slightly below the previous 24.9B. While this shows a slight decrease, the large surplus continues to support the EUR.
    Canadian Dollar (CAD)
    •Ivey PMI: The latest figure is 60.0, lower than the previous 62.5. A PMI above 50 generally indicates expansion, but the drop suggests a slowing pace of growth, which could weaken the CAD.
    •BOC Summary of Deliberations: The Bank of Canada's recent deliberations will provide insight into future monetary policy, which is crucial for the CAD's strength. Any dovish tone could negatively impact the CAD.


    Price Action:
    The EURCAD pair has been through a bearish phase and is currently testing a significant support zone around the 1.50000 level. This area is crucial as it has held in the past, providing a potential floor for the pair.


    [B]Key Technical Indicators: [B]
    MACD (Moving Average Convergence Divergence): The MACD indicator shows that although the trend has been bearish, the MACD line is trending higher, suggesting decreasing bearish momentum. The histogram supports this with declining negative values.
    RSI (Relative Strength Index): The RSI is in a neutral area, around 40, indicating that the pair is not currently oversold or overbought. This suggests that the current price level is a potential point of consolidation or reversal.

    Support and Resistance:
    Support: Immediate support is located at 1.50000. This level is critical as it has been tested recently and held firm, indicating strong buying interest.
    Resistance: The nearest resistance level is at 1.50313, followed by 1.49961, which aligns with recent highs and the descending trend line.


    Conclusion and Consideration:
    The EURCAD pair on the H4 chart indicates a potential consolidation or reversal at the 1.50000 support level. The MACD and RSI indicators suggest that the bearish momentum might be waning, offering a possible opportunity for bulls. Traders should monitor this support area closely for potential buying opportunities, especially if the pair holds above 1.50000. Upcoming economic releases from both the Eurozone and Canada will be crucial, as they can introduce significant volatility and potentially alter the trend dynamics.


    Disclaimer: The EURCAD provided analysis is for informational purposes only and does not constitute investment advice. Traders should conduct their own research and analysis before making any trading decisions. Market conditions can change rapidly, and it is essential to stay updated with the latest information. Always consider risk management strategies and consult with a financial advisor if necessary.


    FXGlory
    07.08.2024

  7. #87
    Senior Member FXGlory Ltd's Avatar
    Join Date
    Mar 2024
    Posts
    105

    Visit FXGlory Ltd's Youtube Channel
    EURUSD H4 Technical and Fundamental Analysis for 12.08.2024


    Time Zone: GMT +3
    Time Frame: 4 Hours (H4)


    Fundamental Analysis:
    The EUR/USD news analysis today is influenced by a combination of Eurozone and U.S. economic factors. Recently, the U.S. Treasury released its Monthly Treasury Statement, indicating a difference in the federal government's income and spending, which could potentially impact the U.S. Dollar depending on whether the deficit is larger or smaller than expected. Additionally, the Federal Reserve Bank of Cleveland's inflation expectations report could sway investor sentiment if the forecast differs significantly from the actual data. On the Euro side, the Wholesale Price Index (WPI) from Destatis, which indicates changes in the price of goods sold by wholesalers, will be a crucial indicator to monitor as it may hint at upcoming consumer inflation trends in the Eurozone. These factors combined suggest that market participants should remain cautious of any news releases that might have an effect on today’s EUR/USD forecast.


    Price Action:
    The EUR/USD H4 chart demonstrates a bearish trend for the pair also known as the ‘Fiber’, with the price nearing the Ichimoku Cloud, which it seems poised to break downward. The Fiber’s price action shows consolidation within a descending triangle pattern, indicating a potential continuation of the downtrend if the lower boundary of the pattern is breached. The recent candlesticks suggest indecision, but with a bearish bias, as indicated by the rejection of higher prices and the subsequent movement toward the triangle's lower trendline.


    Key Technical Indicators:

    Ichimoku Cloud:
    The price is currently approaching the lower edge of the Ichimoku Cloud. A break below the cloud would signify a bearish continuation, potentially leading to further downside. The cloud ahead is thin, suggesting weak future support levels.
    RSI (Relative Strength Index):
    The RSI is at 51.27, hovering around the midline, which indicates a neutral stance. However, given the recent price action and the prevailing bearish trend, the RSI might dip further, signaling increasing selling pressure.
    Stochastic Oscillator:
    The MACD histogram shows decreasing momentum, with the MACD line close to crossing below the signal line. This potential bearish crossover could confirm a continuation of the downward trend.


    [B]Support and Resistance: [B]

    Support Levels:
    The nearest resistance levels are at 1.09364 and 1.09195, which correspond to previous highs and could act as barriers to any upward movement.
    Resistance Levels:
    The immediate support is at 1.08962. If the price breaks below this level, it may find further support around 1.08350, which aligns with the lower boundary of the descending triangle.


    Conclusion and Consideration:

    The EUR/USD technical analysis on the pair’s H4 chart suggests a bearish outlook, particularly with the price nearing a critical support level within a descending triangle. The technical indicators align with this view, signaling potential downside risks if the support at 1.08962 is breached. Traders should keep an eye on the upcoming economic data releases as they could have significant effects on the Fiber’s fundamental analysis. Given the current technical setup, short positions might be favored, but caution is advised, especially around key support and resistance levels.


    Disclaimer: The provided analysis is for informational purposes only and does not constitute investment advice. Traders should conduct their own research and analysis before making any trading decisions.


    FXGlory
    12.08.2024

  8. #88
    Senior Member FXGlory Ltd's Avatar
    Join Date
    Mar 2024
    Posts
    105

    Visit FXGlory Ltd's Youtube Channel
    GBPUSD H4 Technical and Fundamental Analysis for 14.08.2024


    Time Zone: GMT +3
    Time Frame: 4 Hours (H4)


    Fundamental Analysis:
    The GBP/USD forecast today is shaped by ongoing developments in the UK and US economies. In the UK, recent data has shown a slight increase in the unemployment rate, which could suggest a cooling labor market, while inflation remains elevated, keeping the Bank of England on alert for further rate hikes. In the US, economic indicators like the Consumer Price Index (CPI) have shown resilience, keeping the Federal Reserve on a tightrope between taming inflation and sustaining economic growth. These factors create a complex environment for GBP/USD, as traders weigh the relative strength of both currencies.


    Price Action:
    The GBP/USD price recently broke above a significant dynamic resistance zone, indicating a potential end to the bearish phase that has dominated the market. The price action suggests that the pair is now entering a consolidation phase after this breakout, with the possibility of retesting the recently broken dynamic support zone before continuing its upward trajectory.


    Key Technical Indicators:
    RSI (Relative Strength Index): The RSI is currently in the overbought territory, hovering around 72. This suggests that the pair may be due for a short-term correction or consolidation before resuming its upward movement.
    MACD (Moving Average Convergence Divergence): The MACD shows a strong buy signal, with the histogram indicating increasing bullish momentum. This aligns with the recent breakout above the resistance zone, supporting the case for further upside potential.


    Support and Resistance:
    Support Levels:
    The nearest support is at 1.27353, which corresponds to the dynamic support zone recently broken. A retest of this level could provide a strong buying opportunity and this situation is predicted for GBPUSD. Additional support is noted at 1.26641, which would be critical if the pair sees a deeper pullback.
    Resistance Levels:
    Immediate resistance is seen around 1.28850. This area is forecasted to be an important area for GBPUSD A break above this level could accelerate the bullish trend. Further resistance is noted at 1.29410, which would be the next target for bulls if the current momentum continues.


    Conclusion and Consideration:
    The GBP/USD H4 chart analysis suggests that the bearish phase may have concluded, with the price now likely to enter a bullish trend following a potential retest of the dynamic support zone. However, traders should be cautious of the RSI being in overbought territory, indicating a possible short-term pullback or consolidation. The strong buy signal from the MACD further reinforces the potential for continued upward movement after any correction. As always, market participants should monitor upcoming economic data and global developments, adjusting their strategies accordingly.


    Disclaimer: The provided analysis is for informational purposes only and does not constitute investment advice. Traders should conduct their own research and analysis before making any trading decisions.

    FXGlory
    14.08.2024

  9. #89
    Senior Member FXGlory Ltd's Avatar
    Join Date
    Mar 2024
    Posts
    105

    Visit FXGlory Ltd's Youtube Channel
    GBP/AUD H4 Technical and Fundamental Analysis for 13.08.2024


    Time Zone: GMT +3
    Time Frame: 4 Hours (H4)


    Fundamental Analysis:
    The GBP/AUD forecast today is influenced by a mix of economic indicators from both the UK and Australia that paint a complex picture of the potential market directions. The UK sees a decrease in Claimant Count Change and a slight uptick in the Unemployment Rate, combined with a reduction in the Average Earnings Index. In contrast, Australia's economic indicators such as the Westpac Consumer Sentiment and NAB Business Confidence show a mixed economic sentiment, while the Wage Price Index suggests rising wage pressures. These data releases provide critical insights into the economic health of both nations, influencing the GBP/AUD trading strategy.


    Price Action:
    The GBP/AUD pair has been experiencing a bearish wave but shows signs of potential reversal. The price action is forming a descending triangle, with recent lows higher than previous ones, indicating weakening downward momentum. Traders should closely monitor this pattern for a breakout which could signal a new trend.


    Key Technical Indicators:
    RSI (Relative Strength Index): The RSI nears 45 and shows signs of a bullish reversal, which aligns with the weakening bearish momentum observed in the price action. This suggests that the current bearish trend might be losing strength.
    MACD (Moving Average Convergence Divergence): The MACD indicates a decline in bearish momentum with the histogram showing less negativity, suggesting a potential shift towards a bullish market phase if the descending triangle resistance is breached.


    Support and Resistance:
    Support Levels:
    The nearest support is at 1.93200, with additional support at 1.93000. These levels are crucial for maintaining the broader uptrend.
    Resistance Levels:
    The pair is facing resistance at 1.94655, with stronger resistance at 1.95555. A break above these levels could signal a continuation of the bullish trend.


    Conclusion and Consideration:
    The GBP/AUD H4 chart suggests that the bearish momentum is fading with key economic indicators and technical signals pointing towards a possible trend reversal. The outcome of the current patterns could be significantly influenced by further economic releases and market sentiment. Traders should maintain vigilance and adjust their strategies based on the evolving market conditions and economic data.


    Disclaimer: The provided analysis is for informational purposes only and does not constitute investment advice. Traders should conduct their own research and analysis before making any trading decisions.

    FXGlory
    13.08.2024

  10. #90
    Senior Member FXGlory Ltd's Avatar
    Join Date
    Mar 2024
    Posts
    105

    Visit FXGlory Ltd's Youtube Channel
    GBPUSD H4 Technical and Fundamental Analysis for 14.08.2024


    Time Zone: GMT +3
    Time Frame: 4 Hours (H4)


    Fundamental Analysis:
    The GBP/USD forecast today is shaped by ongoing developments in the UK and US economies. In the UK, recent data has shown a slight increase in the unemployment rate, which could suggest a cooling labor market, while inflation remains elevated, keeping the Bank of England on alert for further rate hikes. In the US, economic indicators like the Consumer Price Index (CPI) have shown resilience, keeping the Federal Reserve on a tightrope between taming inflation and sustaining economic growth. These factors create a complex environment for GBP/USD, as traders weigh the relative strength of both currencies.


    Price Action:
    The GBP/USD price recently broke above a significant dynamic resistance zone, indicating a potential end to the bearish phase that has dominated the market. The price action suggests that the pair is now entering a consolidation phase after this breakout, with the possibility of retesting the recently broken dynamic support zone before continuing its upward trajectory.


    Key Technical Indicators:
    RSI (Relative Strength Index): The RSI is currently in the overbought territory, hovering around 72. This suggests that the pair may be due for a short-term correction or consolidation before resuming its upward movement.
    MACD (Moving Average Convergence Divergence): The MACD shows a strong buy signal, with the histogram indicating increasing bullish momentum. This aligns with the recent breakout above the resistance zone, supporting the case for further upside potential.


    Support and Resistance:
    Support Levels:
    The nearest support is at 1.27353, which corresponds to the dynamic support zone recently broken. A retest of this level could provide a strong buying opportunity and this situation is predicted for GBPUSD. Additional support is noted at 1.26641, which would be critical if the pair sees a deeper pullback.
    Resistance Levels:
    Immediate resistance is seen around 1.28850. This area is forecasted to be an important area for GBPUSD A break above this level could accelerate the bullish trend. Further resistance is noted at 1.29410, which would be the next target for bulls if the current momentum continues.


    Conclusion and Consideration:
    The GBP/USD H4 chart analysis suggests that the bearish phase may have concluded, with the price now likely to enter a bullish trend following a potential retest of the dynamic support zone. However, traders should be cautious of the RSI being in overbought territory, indicating a possible short-term pullback or consolidation. The strong buy signal from the MACD further reinforces the potential for continued upward movement after any correction. As always, market participants should monitor upcoming economic data and global developments, adjusting their strategies accordingly.


    Disclaimer: The provided analysis is for informational purposes only and does not constitute investment advice. Traders should conduct their own research and analysis before making any trading decisions.

    FXGlory
    14.08.2024

Page 9 of 11 FirstFirst ... 7 8 9 10 11 LastLast

Bookmarks

Posting Permissions

  • You may not post new threads
  • You may not post replies
  • You may not post attachments
  • You may not edit your posts
  •