Page 7 of 15 FirstFirst ... 5 6 7 8 9 ... LastLast
Results 61 to 70 of 142

Daily Forex Analysis By FXGlory

This is a discussion on Daily Forex Analysis By FXGlory within the Analytics and News forums, part of the Trading Forum category; EURCAD Daily Technical and Fundamental Analysis for 21.06.2024 Time Zone: GMT +3 Time Frame: 4 Hours (H4) Fundamental Analysis: The ...


  1. #61
    Senior Member FXGlory Ltd's Avatar
    Join Date
    Mar 2024
    Posts
    143

    Visit FXGlory Ltd's Youtube Channel
    EURCAD Daily Technical and Fundamental Analysis for 21.06.2024


    Time Zone: GMT +3
    Time Frame: 4 Hours (H4)


    Fundamental Analysis:
    The EUR/CAD currency pair reflects the exchange rate between the Euro (EUR) and the Canadian Dollar (CAD). Today, the market expects several news releases for both currencies. For the EUR, significant events include the German Flash Manufacturing PMI (forecasted at 46.4) and the French Flash Services PMI (forecasted at 50.0), both indicating varying degrees of economic activity. Additionally, speeches from key officials like German Buba President Nagel and ECOFIN meetings could provide further market direction. For the CAD, the focus will be on the Core Retail Sales m/m (forecasted at 0.5%) and Retail Sales m/m (forecasted at 0.7%), which are essential indicators of consumer spending and economic health.


    Price Action:

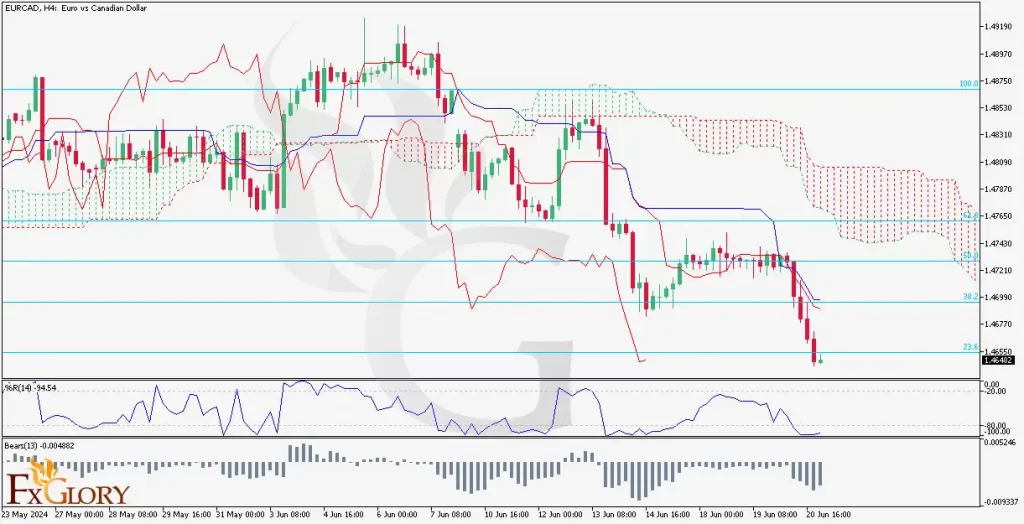
    Analyzing the EURCAD H4 chart, the pair has shown a sharp bearish trend. The last five bearish candles have driven the price down from the 50.0 Fibonacci retracement line towards the 23.6 Fibonacci retracement line, with the latest candle being green and bullish, indicating a potential pullback. This recent bullish candle at the 23.6 Fibonacci level suggests that this support level might hold, at least in the short term.


    Key Technical Indicators:
    Ichimoku Cloud:
    The Ichimoku Cloud indicator shows that the EUR-CAD forex pair is currently in a bearish trend. The price is below the Kumo (cloud), indicating a bearish bias. The Tenkan-sen (red line) and Kijun-sen (blue line) lines are both above the price, reinforcing the bearish outlook. The Senkou Span A and B (cloud boundaries) are also indicating resistance ahead.
    Williams %R: The Williams %R (14) is currently at -94.54, which is in the oversold territory. This suggests that the pair might be due for a short-term rebound or consolidation as the selling pressure may have been exhausted.
    Bears Power (13): The Bears Power indicator shows negative values, indicating that the sellers are still in control. However, the indicator has shown a slight uptick recently, which could suggest that the bearish momentum is weakening slightly.


    Support and Resistance:
    Support:
    The immediate support level is at the 23.6% Fibonacci retracement line (1.4645), which coincides with the recent green candle and could act as a strong support level.
    Resistance: The nearest resistance level is at the 38.2% Fibonacci retracement line (1.4710), which aligns with a previous consolidation area and could pose a challenge for the bulls if the price attempts to recover.


    Conclusion and Consideration:

    The EURCAD pair on the H4 chart shows a strong bearish momentum supported by the Ichimoku Cloud, %R14, and Bears Power indicators. The recent bearish candles indicate that the selling pressure is still present, but the oversold condition of %R14 and the latest bullish candle suggest a possible short-term pullback or consolidation at the 23.6% Fibonacci retracement level. Traders should watch the key support and resistance levels closely, as any breach could indicate the next potential move. Given the upcoming economic releases and speeches, increased volatility can be expected, and traders should stay updated with the latest information.


    Disclaimer:
    The EURCAD technical and fundamental analysis provided is for informational purposes only and does not constitute investment advice. Traders should conduct their own research and analysis before making any trading decisions. Market conditions can change rapidly, and it is essential to stay updated with the latest information.


    FXGlory
    21.06.2024

  2. #62
    Senior Member FXGlory Ltd's Avatar
    Join Date
    Mar 2024
    Posts
    143

    Visit FXGlory Ltd's Youtube Channel
    USDCAD H4 Technical and Fundamental Analysis for 25.06.2024


    Time Zone: GMT +3
    Time Frame: 4 Hours (H4)


    Fundamental Analysis:
    The USD/CAD forex pair, representing the exchange rate between the US Dollar and the Canadian Dollar, is set to react to several key economic events today. At 1:30 pm, multiple CPI metrics for Canada are scheduled to be released, including the CPI m/m, Median CPI y/y, Trimmed CPI y/y, Common CPI y/y, and Core CPI m/m. The forecast for the CPI m/m is 0.3%, down from the previous 0.5%, while the Core CPI m/m forecast is 0.2%, slightly lower than the previous 0.5%. Any deviations from these forecasts could result in significant volatility for the CAD. A higher-than-expected CPI could strengthen the CAD as it may increase the likelihood of the Bank of Canada adopting a more hawkish stance. Conversely, lower-than-expected CPI readings could weaken the CAD.


    Price Action:
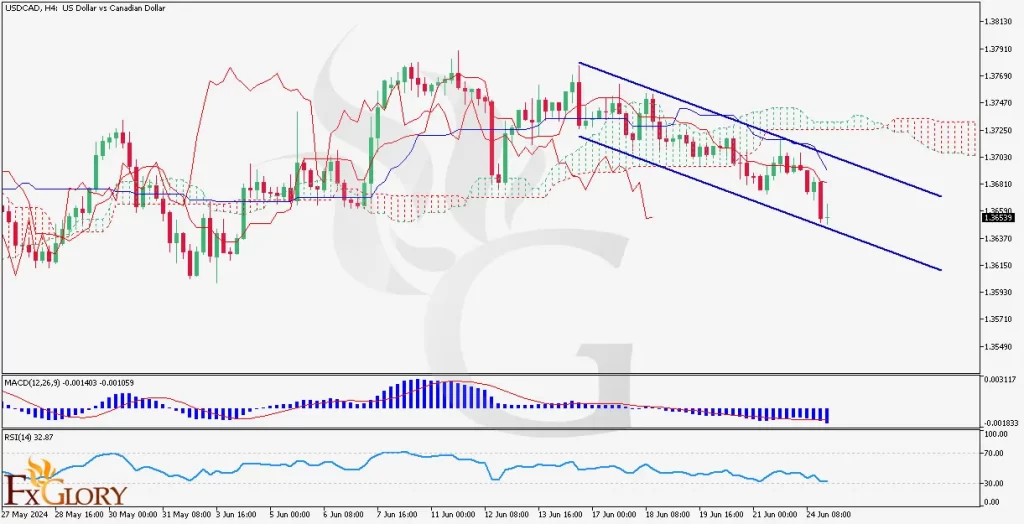
    Analyzing the USD/CAD H4 chart, the pair has been in a clear downtrend, characterized by lower highs and lower lows. The USD/CAD price has been moving within a descending channel, indicating sustained bearish momentum. Recently, the price has broken below the Ichimoku Cloud and is now trading near the lower boundary of the channel, indicating strong bearish sentiment.

    Key Technical Indicators:
    Ichimoku Cloud: USDCAD price is trading below the Ichimoku Cloud, indicating a strong bearish trend for this pair. The cloud itself is bearish, with the future cloud showing red, which suggests continued downward pressure. The Tenkan-sen and Kijun-sen lines are also indicating bearish momentum as they are positioned below the cloud.
    MACD: The MACD line is below the signal line, and the histogram is in negative territory, which confirms the bearish trend on exchange rate between these currencies. The MACD indicator suggests that selling pressure is still dominant, and there are no immediate signs of a bullish reversal.
    RSI: The RSI is currently at 32.87, indicating bearish momentum and that the pair is approaching oversold conditions. This suggests that while the bearish trend is strong, there might be a potential for a short-term corrective bounce.


    Support and Resistance Levels:
    Support: Immediate support is found at 1.36400. A break below this level could see the pair heading towards the next support at 1.3600.
    Resistance: The nearest resistance level is at 1.36730. Above this, resistance is found at 1.36880.


    Conclusion and Consideration:
    The USD/CAD pair on the H4 chart shows strong bearish momentum, supported by the Ichimoku Cloud, MACD, and RSI indicators. Traders should watch for potential volatility around the release of the Canadian CPI data. While the overall trend is bearish, the RSI suggests that the pair might be due for a short-term bounce from oversold conditions. Caution is advised as fundamental news could lead to sharp movements.


    Disclaimer: The analysis provided is for informational purposes only and does not constitute investment advice. Traders should conduct their own research and analysis before making any trading decisions. Market conditions can change rapidly, and it is essential to stay updated with the latest information.


    FXGlory
    25.06.2024

  3. #63
    Senior Member FXGlory Ltd's Avatar
    Join Date
    Mar 2024
    Posts
    143

    Visit FXGlory Ltd's Youtube Channel
    EURUSD H4 Technical and Fundamental Analysis for 27.06.2024


    Time Zone: GMT +3
    Time Frame: 4 Hours (H4)


    Fundamental Analysis:
    The EUR/USD news analysis today is influenced by significant economic indicators and news releases. For the Euro, the M3 Money Supply and private loans data provide insights into economic health and lending trends within the Eurozone. For the US Dollar, today's high-impact news includes the Final GDP q/q, expected at 1.4%, and Unemployment Claims forecasted at 236K. Stronger-than-expected GDP growth and lower unemployment claims are likely to support the USD, while weaker data could benefit the Euro. Additionally, medium-impact releases such as Core Durable Goods Orders and Durable Goods Orders will further influence the EUR/USD market sentiment and direction.

    Price Action:
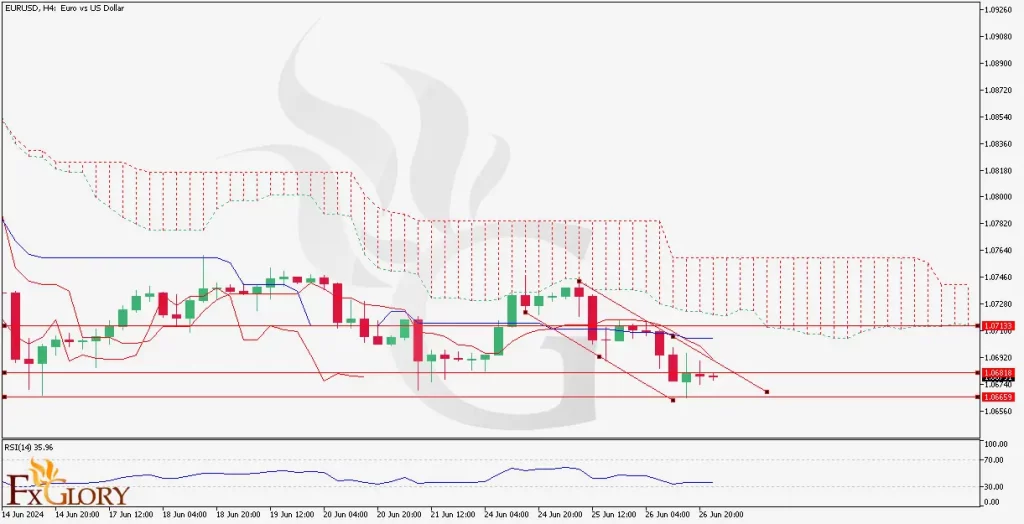
    The EUR/USD H4 chart exhibits a bearish trend for the pair, with the price making lower highs and lower lows. The pair has recently been trading below the Ichimoku Cloud, indicating sustained bearish momentum. The “Fiber’s” price action shows a potential descending triangle pattern, which could signal further downside if support levels are breached.


    Key Technical Indicators:
    Ichimoku Cloud:
    The price is below the Ichimoku Cloud, suggesting a bearish trend. The future cloud is also red, indicating potential continued bearish sentiment.
    RSI (Relative Strength Index): The RSI is currently at 35.96, indicating that the pair is approaching oversold territory. This could suggest a potential for a short-term reversal if the RSI dips further but fails to break the oversold threshold.


    Support and Resistance:
    Support Levels:
    The immediate support level is at 1.06650, followed by a secondary support at 1.06550.
    Resistance Levels: The nearest resistance is at 1.07139, with further resistance at 1.07640 and 1.08000.


    Conclusion and Consideration:
    The EUR/USD forecast live shows strong bearish momentum, as evidenced by the position below the Ichimoku Cloud and the descending RSI. Traders should monitor the key support level at 1.06650; a breach below this level could signal further downside. Conversely, if the RSI indicates oversold conditions, a short-term bounce to the resistance levels could occur. Fundamental factors, including today's economic releases, will play a crucial role in determining the pair's direction. Proper risk management, including setting stop losses, is essential due to potential market volatility around high-impact news.


    Disclaimer: The provided analysis is for informational purposes only and does not constitute investment advice. Traders should conduct their own research and analysis before making any trading decisions.


    FXGlory
    27.06.2024
    Last edited by FXGlory Ltd; 06-27-2024 at 03:43 AM.

  4. #64
    Senior Member FXGlory Ltd's Avatar
    Join Date
    Mar 2024
    Posts
    143

    Visit FXGlory Ltd's Youtube Channel
    USDJPY H4 Technical and Fundamental Analysis


    Time Zone: GMT +3
    Time Frame: 4 Hours (H4)


    Fundamental Analysis:
    The USDJPY currency pair reflects the exchange rate between the US Dollar (USD) and the Japanese Yen (JPY). Today's upcoming USD news includes several low to medium impact events such as speeches by FOMC members and data on Personal Income and Spending. Notably, the Core PCE Price Index, forecasted at 0.1%, is a crucial inflation measure for the Fed. These indicators may provide insights into future US monetary policy, potentially influencing USD volatility. For JPY, the medium impact Tokyo Core CPI is forecasted at 2.0%, and other low impact data such as Unemployment Rate, Industrial Production, and Housing Starts are expected, which could affect the JPY's performance.


    Price Action:
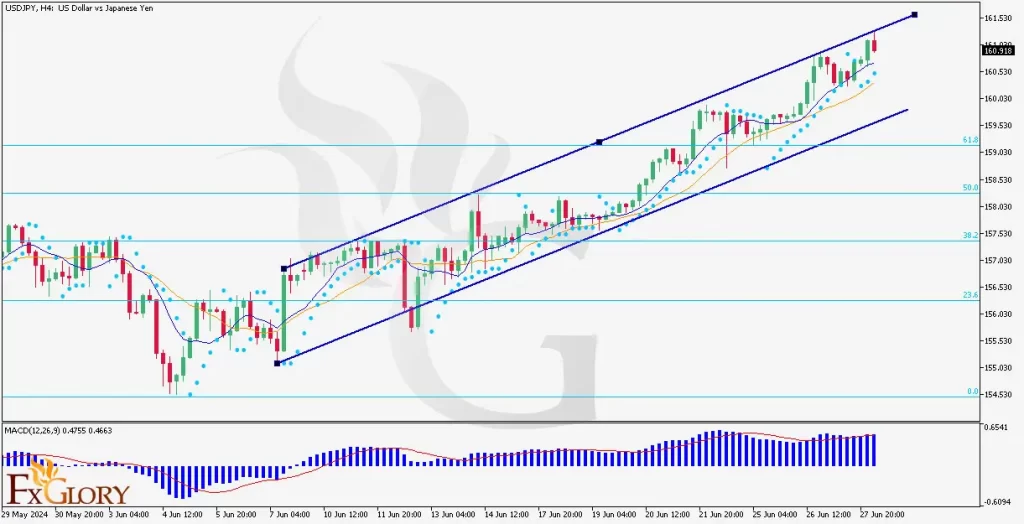
    The USDJPY pair on the H4 timeframe is experiencing a clear bullish trend, with the price reaching its highest level since 2010. The price action shows a consistent upward movement as the candles move from the lower to the middle and now the upper Bollinger Bands, indicating strong bullish momentum. Recently, the price has been moving upwards steadily, supported by a positive trend in the market.

    Key Technical Indicators:
    Parabolic SAR: The Parabolic SAR indicator shows the last three dots positioned below the candles, confirming a bullish trend. This placement indicates continued upward momentum, suggesting traders might look for buy opportunities as long as the dots remain under the price.
    MACD: The MACD indicator shows the MACD line crossing above the signal line with the histogram displaying increasing momentum. This bullish crossover suggests strengthening upward momentum, which supports the ongoing bullish trend in the USDJPY pair.
    Moving Averages: The short-term Moving Average (9-period, blue) has crossed above the long-term Moving Average (17-period, orange), both moving upwards. This crossover is a bullish signal, indicating that the short-term price trend is gaining strength relative to the long-term trend.


    Support and Resistance:
    Support: Immediate support is located at 1.36600, aligning with a recent consolidation area and the middle Bollinger Band.
    Resistance: The nearest resistance level is at 1.37481, which coincides with the 0.382 Fibonacci level and recent highs.


    Conclusion and Consideration:
    The USDJPY pair on the H4 chart shows sustained bullish momentum, supported by the Parabolic SAR, MACD, and Moving Averages indicators. The current price action within an ascending channel indicates that the bulls are in control, with potential further gains as indicated by the key technical indicators. However, traders should remain cautious due to potential increased volatility from the upcoming economic data releases and speeches from key officials. It is essential to monitor these events closely as they could significantly impact market conditions.


    Disclaimer:
    The provided analysis of USDJPY is for informational purposes only and does not constitute investment advice. Traders should conduct their own research and analysis before making any trading decisions. Market conditions can change rapidly, and staying updated with the latest information is crucial for informed trading decisions.


    FXGlory
    28.06.2024

  5. #65
    Senior Member FXGlory Ltd's Avatar
    Join Date
    Mar 2024
    Posts
    143

    Visit FXGlory Ltd's Youtube Channel
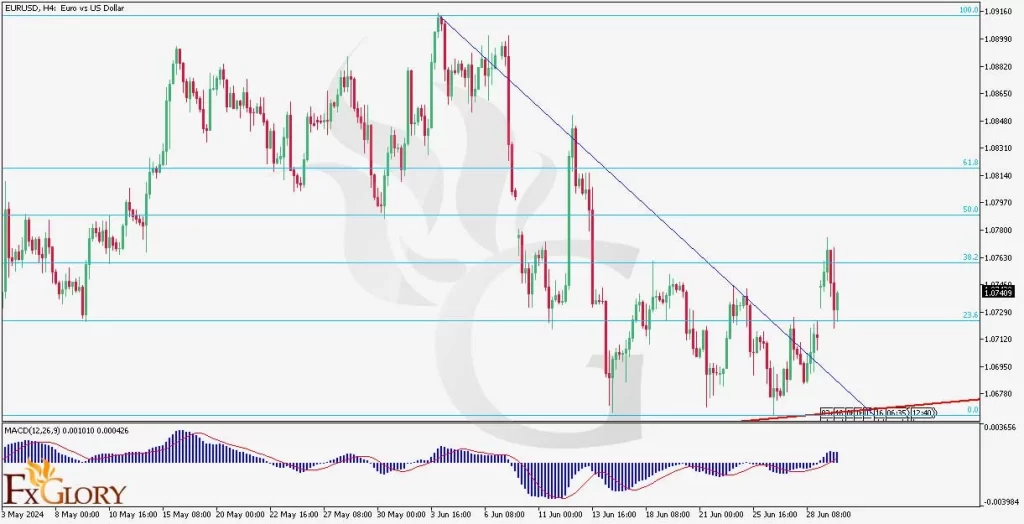
    EURUSD H4 Technical and Fundamental Analysis for 02.07.2024


    Time Zone: GMT +3
    Time Frame: 4 Hours (H4)


    Fundamental Analysis:
    The EUR/USD forex pair, representing the exchange rate between the Euro and the US Dollar, is influenced by significant economic data from both the Eurozone and the United States. Recent PMI data from the Eurozone showed improvements, with the Italian Manufacturing PMI at 45.7, French Final Manufacturing PMI at 45.4, and the overall Eurozone Final Manufacturing PMI at 45.8, all surpassing their forecasts. Meanwhile, US economic data revealed mixed results, with the Final Manufacturing PMI at 51.6, ISM Manufacturing PMI at 48.5 below expectations, and ISM Manufacturing Prices and Construction Spending showing weaker figures. These data points suggest a potential advantage for the Euro in the near term.


    Price Action:
    Analyzing the EUR/USD H4 chart, the pair has broken above its bearish trend line, signaling a potential shift in market sentiment. The price reacted to the 23.6% Fibonacci retracement level of the previous bearish wave and appears poised to continue its bullish run. The breakout above the trend line and the Fibonacci level indicates strong bullish momentum.


    Key Technical Indicators:
    Fibonacci Retracement Levels: The price reacted at the 23.6% Fibonacci level and is expected to continue upwards. The next levels to watch are the 38.2% and 50% retracement levels, which could act as resistance.
    MACD: The MACD line is crossing above the signal line, suggesting bullish momentum. This crossover is a typical bullish signal, indicating potential upward movement in the near term.


    Support and Resistance Levels:
    Support: The immediate support level is around 1.0700. A break below this level could lead the pair to test the next support at 1.0650.
    Resistance: The nearest resistance is at 1.0780, followed by a stronger resistance level at 1.0840.


    Conclusion and Consideration:
    The EUR/USD pair on the H4 chart displays a bullish outlook, supported by the breakout above the bearish trend line and the bullish signals from the MACD indicator. The reaction at the 23.6% Fibonacci level suggests potential for further upward movement. Traders should monitor these levels closely and watch for any fundamental news that might impact the pair, especially economic data releases from the Eurozone and the United States.


    Disclaimer: The analysis provided is for informational purposes only and does not constitute investment advice. Traders should conduct their own research and analysis before making any trading decisions. Market conditions can change rapidly, and it is essential to stay updated with the latest information.


    FXGlory
    02.07.2024

  6. #66
    Senior Member FXGlory Ltd's Avatar
    Join Date
    Mar 2024
    Posts
    143

    Visit FXGlory Ltd's Youtube Channel

    Daily Forex Analysis By FXGlory

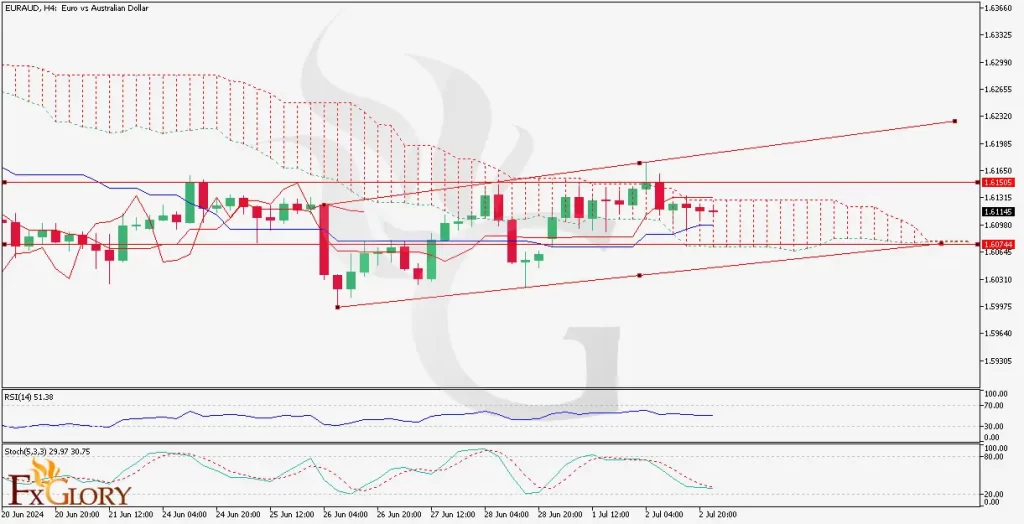
    EURAUD H4 Technical and Fundamental Analysis for 07.03.2024


    Time Zone: GMT +3
    Time Frame: 4 Hours (H4)


    Fundamental Analysis:

    The EUR/AUD news analysis, often influenced by economic indicators and policy decisions from both the Eurozone and Australia, sees varying volatility based on such releases. Recent data from the Australian Bureau of Statistics show a promising increase in retail sales and new building approvals, suggesting a potential boost in economic activities that may strengthen the Australian Dollar. On the European front, the French Treasury reports a budget surplus and upcoming PMI data indicate healthy service sector growth. These factors collectively enhance the fundamental landscape, offering a mixed outlook for the EUR/AUD forecast today as both currencies find robust support from their respective economies.


    Price Action:

    The EUR/AUD H4 chart depicts a consolidation phase within a rising channel, indicating a bullish undercurrent tempered by recent hesitations in price movements. The currency pair has consistently tested the channel’s support and resistance boundaries, with the latest of the pair’s technical analysis hinting at a slight bearish retracement from the upper channel line. This typical reaction at upper resistance levels may lead to short-term pullbacks but maintains the overall upward trend.


    Key Technical Indicators:

    Ichimoku Cloud:

    The price is currently trading within the Ichimoku Cloud. This positioning indicates a neutral zone where buying and selling pressures are balanced, but also suggests potential volatility as the price tests the cloud’s boundaries for either a breakout or a rejection.

    RSI (Relative Strength Index):

    The RSI on the chart is near 51.38, indicating a neutral momentum with neither overbought nor oversold conditions, suggesting that there is room for the price to move in either direction without immediate pressure from momentum extremes.

    Stochastic Oscillator:

    The Stochastic lines are converging around the 30 level, which typically signals a potential upward reversal if they turn upwards, marking a key watch-out for buyers.


    Support and Resistance:

    Support Levels:
    The immediate support is visible at the lower boundary of the trading channel and further strengthened by another support near 1.60745, which previously acted as both support and resistance.

    Resistance Levels:

    The upper channel line currently acts as the primary resistance level, with further resistance potentially forming near recent highs at around 1.62500.


    Conclusion and Consideration:

    As the EUR/AUD analysis today navigates through significant economic releases, the technical setup favors a cautiously bullish outlook with considerations for potential pullbacks. Traders should remain alert to breaking above the cloud or a reversal at key support levels. Monitoring upcoming economic indicators will be crucial in guiding short-term trading strategies.


    Disclaimer: The provided analysis is for informational purposes only and does not constitute investment advice. Traders should conduct their own research and analysis before making any trading decisions.


    FXGlory
    07.03.2024

  7. #67
    Senior Member FXGlory Ltd's Avatar
    Join Date
    Mar 2024
    Posts
    143

    Visit FXGlory Ltd's Youtube Channel

    Daily Forex Analysis By FXGlory

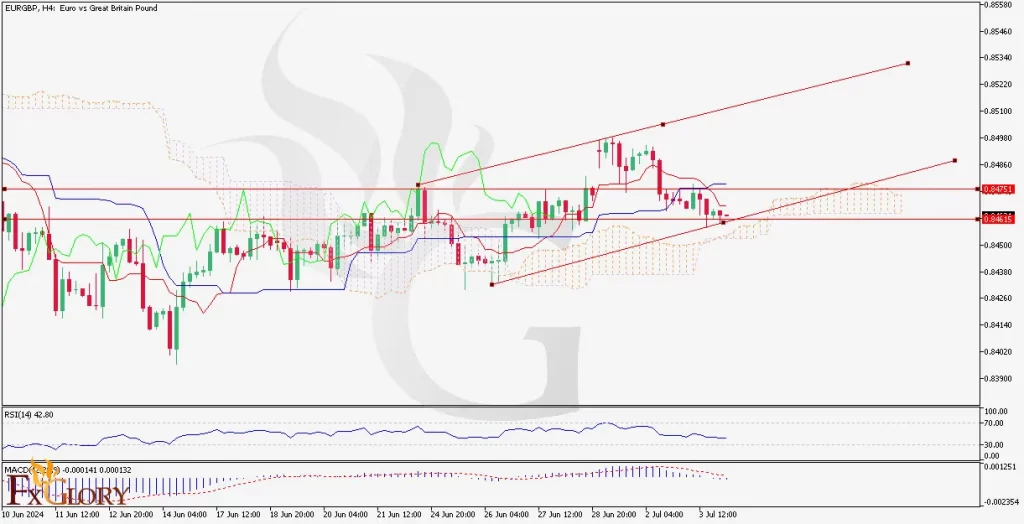
    EURGBP H4 Technical and Fundamental Analysis for 07.04.2024


    Time Zone: GMT +3
    Time Frame: 4 Hours (H4)


    Fundamental Analysis:

    The EUR/GBP news analysis today is influenced by various fundamental factors. For the Euro, industrial orders and bond yields within the Eurozone play a significant role, reflecting economic activity and investor confidence. In the UK, the focus is on the general election outcomes and PMI data, which indicate economic health and conditions within the construction industry. The upcoming UK general election is particularly crucial as it could shift economic policies and investor sentiment. Concurrently, the Eurozone's bond yields and industrial orders data provide insights into economic trends and production outlooks, which are vital for the EUR/GBP dynamics.


    Price Action:

    The EUR/GBP H4 chart shows the pair trading within an ascending channel, indicating the bullish trend of the pair over the medium term. However, Chunnel’s recent price action demonstrates a pullback towards the lower boundary of the channel, suggesting possible consolidation or a correction phase. The price is currently hovering around the support level of 0.84615, with a resistance level noted at 0.84751. A break below the support could indicate further bearish momentum, while a bounce back could signal a continuation of the bullish trend within the channel.


    Key Technical Indicators:

    Ichimoku Cloud:

    Ichimoku Cloud: The Ichimoku Cloud analysis shows the price broke through the cloud and, after a bearish trend, is heading back towards the cloud but is not within it yet. The Tenkan-sen below the Kijun-sen and the Chikou Span being below the price indicate continued bearish sentiment.

    RSI (Relative Strength Index):

    The RSI is at 42.80, indicating a moderately bearish sentiment. It is not yet in the oversold territory, implying that there could be more room for the price to decline before a reversal is expected.

    MACD (Moving Average Convergence Divergence):

    The Stochastic lines are converging around the 30 level, which typically signals a potential upward reversal if they turn upwards, marking a key watch-out for buyers.


    Support and Resistance:

    Support Levels:

    The immediate support level is at 0.84615. A break below this level could lead to further declines towards the lower boundary of the ascending channel.

    Resistance Levels:

    The resistance level is at 0.84751. A break above this level could indicate a continuation of the bullish trend towards the upper boundary of the ascending channel.


    Conclusion and Consideration:

    The EUR/GBP H4 chart forecast today presents a mixed outlook, with current bearish momentum but within a longer-term ascending channel. Traders should closely monitor the support level at 0.84615 and the resistance level at 0.84751 for potential breakouts. Given the indicators like the Ichimoku Cloud and RSI, there is a possibility of further decline, but the proximity to the cloud suggests potential stabilization. Traders should also keep an eye on fundamental data from the Eurozone and the UK, as these will significantly impact market sentiment and price action.


    Disclaimer: The provided analysis is for informational purposes only and does not constitute investment advice. Traders should conduct their own research and analysis before making any trading decisions.


    FXGlory
    07.04.2024

  8. #68
    Senior Member FXGlory Ltd's Avatar
    Join Date
    Mar 2024
    Posts
    143

    Visit FXGlory Ltd's Youtube Channel

    Daily Forex Analysis By FXGlory

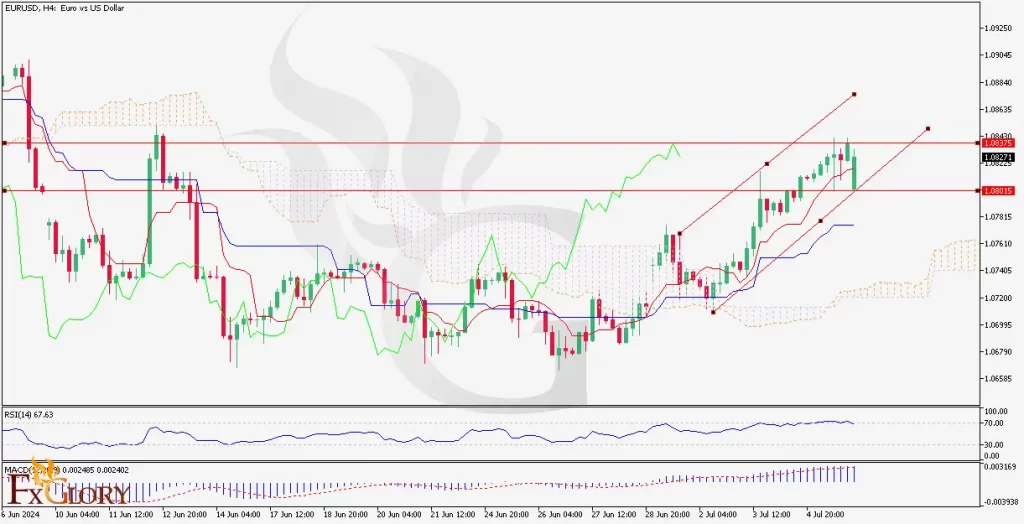
    EURUSD H4 Technical and Fundamental Analysis for 07.08.2024


    Time Zone: GMT +3
    Time Frame: 4 Hours (H4)


    Fundamental Analysis:

    The EUR/USD news analysis today is influenced by a variety of fundamental factors, including macroeconomic data, central bank policies, and geopolitical events. For the Euro, upcoming reports such as the German Trade Balance and Sentix Investor Confidence are low-impact but can provide insights into economic health. A higher-than-expected trade balance could be positive for the Euro, suggesting robust export activity. Similarly, a Sentix Investor Confidence reading above expectations could indicate optimism about the Eurozone economy. For the USD, the Consumer Credit m/m data is expected to be a low-impact release, but higher consumer credit could signal confidence in financial stability and spending power, potentially supporting the USD.


    Price Action:

    The EUR/USD H4 chart shows a visible bullish trend for the pair with the price moving within an ascending channel. The Fiber’s price action shows higher highs and higher lows, indicating bullish momentum. The pair has tested and pulled back from the upper boundary of the channel, suggesting a potential consolidation or retracement before continuing its upward movement.


    Key Technical Indicators:

    Ichimoku Cloud:

    The price is above the Ichimoku Cloud, indicating a bullish trend. The Tenkan-sen (red line) and Kijun-sen (blue line) are both pointing upwards, which supports the bullish outlook. The Chikou Span (lagging line) is above the price, further confirming the bullish trend.

    RSI (Relative Strength Index):

    The RSI is currently at 67.63, close to the overbought territory (70). This suggests that while there is strong bullish momentum, the pair may be nearing an overbought condition, which could lead to a short-term correction.

    MACD (Moving Average Convergence Divergence):

    MACD line above the signal line, indicating sustained bullish momentum. The upward trajectory of the MACD lines supports the potential for further gains.


    Support and Resistance:

    Support Levels:

    Immediate support is at the 1.08015 level, which aligns with the lower boundary of the ascending channel and the Kijun-sen.

    Resistance Levels:

    The nearest resistance is at 1.08375, marked by the recent high. A break above this level could see the price testing higher resistance around 1.08640.


    Conclusion and Consideration:

    The EUR/USD pair on the H4 chart is in a clear uptrend, supported by the Ichimoku Cloud, RSI, and MACD indicators. The bullish momentum of the pair appears strong, but the RSI suggests the pair may be approaching an overbought condition, which could lead to a short-term pullback. Traders should watch for a break above the 1.08375 resistance level for confirmation of continued bullish movement. Key economic data releases for both EUR and USD should be monitored as they can influence market sentiment and price action. Proper risk management strategies, such as setting stop losses near support levels, are essential in managing potential market volatility.


    Disclaimer: The provided analysis is for informational purposes only and does not constitute investment advice. Traders should conduct their own research and analysis before making any trading decisions.


    FXGlory
    07.08.2024

  9. #69
    Senior Member FXGlory Ltd's Avatar
    Join Date
    Mar 2024
    Posts
    143

    Visit FXGlory Ltd's Youtube Channel
    AUDUSD H4 Technical and Fundamental Analysis for 07.09.2024


    Daily Forex Analysis By FXGlory-audusd_h4_chart_daily_technical_and_fundamental_analysis_for_07.jpg


    Time Zone: GMT +3
    Time Frame: 4 Hours (H4)


    Fundamental Analysis:
    The AUD/USD news analysis today is influenced by a combination of economic indicators and geopolitical factors. For the Australian dollar, key factors include the Westpac Consumer Sentiment Index and the NAB Business Confidence survey. Both indicators reflect the economic health and confidence levels within Australia, affecting the currency's strength. Additionally, the upcoming testimony from Federal Reserve officials and other USD-related economic data, such as the NFIB Small Business Index, will significantly impact the US dollar. Statements from Federal Reserve members can provide insights into future monetary policy, influencing the USD and, consequently, the AUD/USD forecast today.


    Price Action:
    The AUD/USD H4 chart is displaying an uptrend characterized by higher highs and higher lows. The price has been moving within an ascending channel, currently consolidating near the upper boundary. This indicates that the bullish momentum of the “Aussie” is still intact, but the pair is facing some resistance. The price action of the pair suggests a potential breakout above the current resistance levels if the bullish pressure persists.


    Key Technical Indicators:
    Ichimoku Cloud:
    The price is trading above the Kumo (cloud), indicating a bullish trend. The Senkou Span A is above Senkou Span B, further supporting the bullish sentiment.
    RSI (Relative Strength Index):
    The RSI is currently at 58.79, which is in the bullish territory but not overbought. This suggests there is still room for the price to move higher.
    Stochastic Oscillator:
    The Stochastic (5, 3, 3) is at 21.83, indicating that the pair might be oversold in the short term, potentially leading to a reversal or continuation of the bullish trend if it crosses above 20.


    Support and Resistance:
    Support Levels:
    The nearest support level is at 0.67126, followed by a more substantial support at 0.66892.
    Resistance Levels:
    The immediate resistance level is at 0.67355, with a significant resistance level at 0.67515, which aligns with the upper boundary of the ascending channel.


    Conclusion and Consideration:
    The AUD/USD technical analysis today shows the pair’s strong bullish trend on the H4 chart, supported by the Ichimoku cloud analysis and the current position of the RSI. The Stochastic indicator suggests potential short-term oversold conditions, which might lead to a continuation of the bullish trend if the pair finds support at current levels. Traders should monitor key support and resistance levels, especially the 0.67355 and 0.67515 resistance levels, for potential breakout opportunities. Given the upcoming economic data releases and speeches from Federal Reserve officials, traders should remain cautious and employ proper risk management strategies.


    Disclaimer: The provided analysis is for informational purposes only and does not constitute investment advice. Traders should conduct their own research and analysis before making any trading decisions.


    FXGlory
    07.09.2024

  10. #70
    Senior Member FXGlory Ltd's Avatar
    Join Date
    Mar 2024
    Posts
    143

    Visit FXGlory Ltd's Youtube Channel

    Daily Forex Analysis By FXGlory

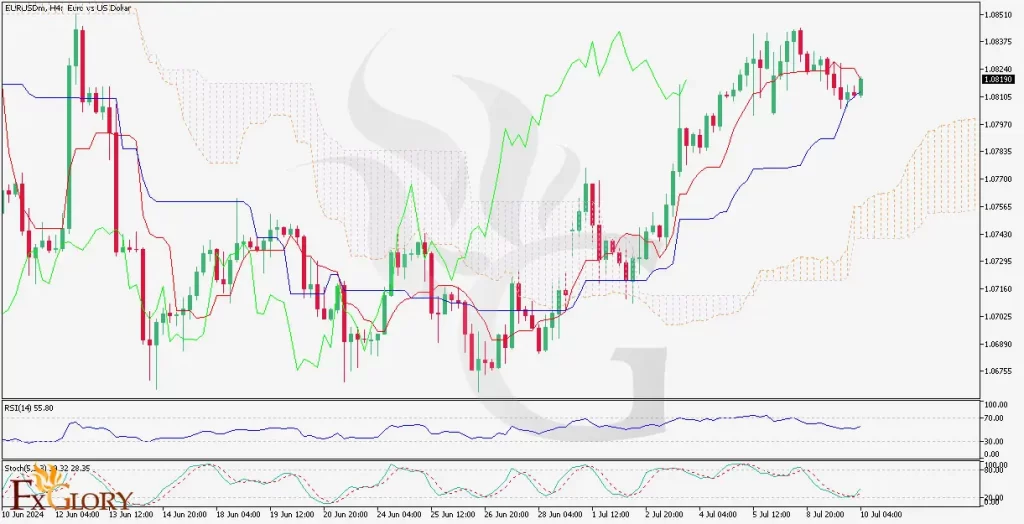
    EUR/USD H4 Technical and Fundamental Analysis for 07.10.2024


    Time Zone: GMT +3
    Time Frame: 4 Hours (H4)


    Fundamental Analysis:

    The EUR/USD forex pair analysis is currently influenced by several economic indicators and geopolitical factors. For the Euro, key influences include the latest European Central Bank (ECB) meeting minutes and upcoming economic data releases such as the ZEW Economic Sentiment Index and Eurozone Industrial Production figures. These indicators reflect the economic health of the Eurozone, which in turn affects the Euro's strength. On the US side, recent speeches from Federal Reserve officials and USD-related economic data, including inflation rates and jobless claims, play a significant role. The Fed's stance on monetary policy continues to be a critical driver for the USD, impacting the EUR/USD forecast today.


    Price Action:

    The EUR/USD H4 chart is displaying a bullish trend characterized by the price recently breaking above the Ichimoku cloud. This bullish breakout signifies the potential for further upward movement. After a correction phase, EURUSD appears to be resuming its ascending trend. The price action predictions suggest that if the current bullish momentum persists, the pair could test and possibly break through the identified resistance levels.


    Key Technical Indicators:

    Ichimoku Cloud:

    The price is trading above the Kumo (cloud), indicating a bullish trend and the Senkou Span A is above Senkou Span B, further supporting the bullish sentiment.

    RSI (Relative Strength Index):

    The RSI is currently at 55.80, which is in bullish territory but not overbought. This suggests there is room for the price to move higher.

    Stochastic Oscillator:

    The Stochastic (5, 3, 3) is at 39.32, indicating that the pair might have potential for further upward movement before reaching overbought conditions.


    Support and Resistance:

    Support Levels:
    The nearest support level is at 1.07970, followed by more substantial support at 1.07350.

    Resistance Levels:
    The immediate resistance level is at 1.08510, with a significant resistance level at 1.07350, which aligns with the upper boundary of the ascending channel.


    Conclusion and Consideration:

    The EUR/USD technical analysis today shows a strong bullish trend on the H4 chart, supported by the Ichimoku cloud analysis and the current position of the RSI. The Stochastic indicator suggests potential for continued upward movement, provided the pair finds support at current levels. Traders should monitor key support and resistance levels, particularly the 1.08510 and 1.08560 resistance levels, for potential breakout opportunities. Given the upcoming economic data releases and statements from Federal Reserve officials, traders should remain cautious and employ proper risk management strategies.


    Disclaimer: The provided analysis is for informational purposes only and does not constitute investment advice. Traders should conduct their own research and analysis before making any trading decisions.


    FXGlory
    07.10.2024

Page 7 of 15 FirstFirst ... 5 6 7 8 9 ... LastLast

Bookmarks

Posting Permissions

  • You may not post new threads
  • You may not post replies
  • You may not post attachments
  • You may not edit your posts
  •