Page 17 of 19 FirstFirst ... 7 15 16 17 18 19 LastLast
Results 161 to 170 of 184

Daily Forex Analysis By FXGlory

This is a discussion on Daily Forex Analysis By FXGlory within the Analytics and News forums, part of the Trading Forum category; EURUSD H4 Technical and Fundamental Analysis for 12.12.2024 Time Zone: GMT +2 Time Frame: 4 Hours (H4) Fundamental Analysis Today, ...


  1. #161
    Senior Member FXGlory Ltd's Avatar
    Join Date
    Mar 2024
    Posts
    185

    Visit FXGlory Ltd's Youtube Channel
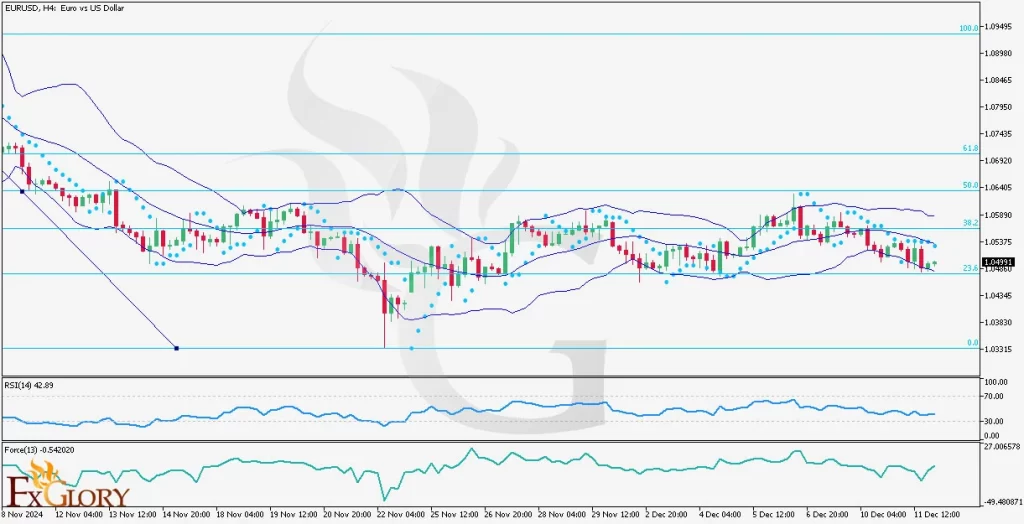
    EURUSD H4 Technical and Fundamental Analysis for 12.12.2024


    Time Zone: GMT +2
    Time Frame: 4 Hours (H4)


    Fundamental Analysis

    Today, the EURUSD pair will be influenced by multiple economic releases from both the Eurozone and the United States. On the Eurozone side, the IT Quarterly Unemployment Rate and the ECB Main Refinancing Rate are scheduled for release. A lower-than-expected unemployment rate and a higher-than-expected interest rate would be positive for the Euro. On the US side, the Core PPI m/m, PPI m/m, and Unemployment Claims data will be released. Higher-than-expected inflation figures and lower-than-expected jobless claims would be positive for the US Dollar. Traders should closely monitor these releases as they could significantly impact the pair's price action.


    Price Action
    The EURUSD pair has been trading within a range in recent weeks, consolidating after a previous bullish trend. The current price action suggests a potential breakout in either direction, depending on the upcoming economic data and market sentiment. The pair is currently trading near the middle of its Bollinger Bands, indicating a period of low volatility.


    Key Technical Indicators
    Bollinger Bands: The narrowing Bollinger Bands suggest a period of low volatility, which could be followed by a significant price move.
    RSI (Relative Strength Index): The RSI is currently at 42.89, below the oversold level of 30, indicating that the Euro is undervalued relative to the US Dollar. This could lead to a bullish correction in the short term.
    Parabolic SAR: The Parabolic SAR dots are plotted above the candles, indicating a bearish trend. However, the recent flattening of the dots suggests a potential slowdown in the bearish momentum.
    Force Index 13: The Force Index 13 is currently at -0.542020, indicating weak bearish momentum. A positive value would signal a shift in momentum to bullish.


    Support and Resistance
    Support: The immediate support level is located at 1.03315, followed by 1.03830.
    Resistance: The nearest resistance level is at 1.04345, followed by 1.04991.


    Conclusion and Considerations
    The EURUSD pair is currently trading in a range, with potential for a breakout in either direction. The upcoming economic releases from both the Eurozone and the US will be crucial in determining the pair's future direction. Traders should monitor these releases closely and adjust their positions accordingly. It is important to note that the EURUSD pair can be highly volatile, and traders should use stop-loss orders to manage risk.


    Disclaimer: The analysis provided for EUR/USD is for informational purposes only and does not constitute investment advice. Traders are encouraged to perform their own analysis and research before making any trading decisions on EURUSD. Market conditions can change quickly, so staying informed with the latest data is essential.


    FXGlory
    12.12.2024

  2. #162
    Senior Member FXGlory Ltd's Avatar
    Join Date
    Mar 2024
    Posts
    185

    Visit FXGlory Ltd's Youtube Channel
    EURGBP H4 Technical and Fundamental Analysis for 12.13.2024


    Time Zone: GMT +2
    Time Frame: 4 Hours (H4)


    Fundamental Analysis:
    The EUR/GBP fundamental analysis today is influenced by a variety of factors, including economic data releases from both the Eurozone and the UK. For the Euro, key economic indicators like GDP, industrial output, and inflation data (CPI) significantly impact the pair’s forecast today. Likewise, the UK’s data on consumer sentiment (GfK survey), GDP, and manufacturing outputs also play a crucial role in determining the currency’s strength. A stronger-than-expected economic performance in the Eurozone, along with weak growth indicators from the UK, may support the euro’s bullish momentum against the pound. On the other hand, if UK economic data surprises to the upside, this could help the GBP gain strength against the euro. Key upcoming data releases like the GfK Consumer Confidence index from the UK and industrial output data from the Eurozone should be closely watched by traders for potential market-moving developments.


    Price Action:
    On the EUR/GBP H4 chart, we can witness the pair’s mixed price action, having recently experienced consolidation within a defined range. Currently, the pair is testing resistance levels, but is struggling to break above the previous highs. This indecisive price movement suggests a possible continuation or reversal depending on which side of the range the EURGBP price breaks. The trend is neither distinctly bullish nor bearish, indicating a market waiting for further confirmation from both of the pair’s technical and fundamental factors before making a decisive move.


    Key Technical Indicators:
    RSI (Relative Strength Index): The RSI is currently at 55, indicating neutral market conditions. This level suggests that the pair is neither overbought nor oversold, and there is a balanced market sentiment. With the RSI hovering around the mid-point, it indicates that the market could either continue its current range or potentially break out, depending on the strength of incoming data or price action. This neutral reading suggests that traders should watch for further EURGBP price movement to determine the next potential direction.
    Parabolic SAR: The Parabolic SAR dots are currently positioned below the price, supporting the notion of an ongoing uptrend. However, the close proximity of the dots to the current price suggests that any price pullback could cause the SAR to flip, signaling a potential trend reversal.
    MACD (Moving Average Convergence Divergence): The MACD line is above the signal line, suggesting a bullish momentum in the short-term. However, the histogram shows a decrease in momentum, indicating that the buying pressure may be weakening, and a potential reversal could occur if the MACD line crosses below the signal line.


    Support and Resistance:
    Support Levels: The pair’s nearest support level is located around 0.8730, coinciding with the recent lows. A further drop would likely find support around the 0.8700 psychological level.
    Resistance Levels: Immediate resistance is at 0.8785, the previous swing high. A break above this level could lead to a move toward the next resistance at 0.8800, followed by the 0.8850 zone.


    Conclusion and Consideration:
    The EUR/GBP outlook today on its H4 chart is currently facing resistance and exhibits a neutral-to-bullish sentiment. While the RSI and MACD suggest bullish potential, the price is struggling to break higher, indicating that market participants are waiting for a clear trigger. Traders should closely monitor key fundamental data, particularly from the UK and Eurozone, to gauge potential market reactions. A breakout above the 0.8785 resistance level would confirm a bullish continuation, whereas failure to break this level could lead to a pullback towards the support levels at 0.8730. Given the mixed signals, it’s crucial to use risk management strategies like stop losses to protect against unexpected market movements.


    Disclaimer: The analysis provided for EUR/GBP is for informational purposes only and does not constitute investment advice. Traders are encouraged to perform their own analysis and research before making any trading decisions on EURGBP. Market conditions can change quickly, so staying informed with the latest data is essential.


    FXGlory
    12.13.2024

  3. #163
    Senior Member FXGlory Ltd's Avatar
    Join Date
    Mar 2024
    Posts
    185

    Visit FXGlory Ltd's Youtube Channel
    GBPUSD H4 Technical and Fundamental Analysis for 12.16.2024


    Time Zone: GMT +2
    Time Frame: 4 Hours (H4)


    Fundamental Analysis
    The GBPUSD pair remains under pressure today as traders await significant economic updates from both the United States and the United Kingdom. For the USD, the New York Manufacturing Index and the Purchasing Managers' Index (PMI) reports for manufacturing and services sectors are key. A higher-than-expected PMI figure will indicate improving economic conditions, providing support for the USD. On the GBP side, the UK PMI data for both manufacturing and services sectors will determine sentiment. If results exceed expectations, it could bolster confidence in the GBP, while weaker figures may weigh heavily on the pair.
    Given the ongoing uncertainty, the USD is likely to gain favor as a safe-haven asset, particularly if US PMI data signals economic expansion. Conversely, soft UK PMI results could further extend the bearish pressure on GBPUSD.


    Price Action
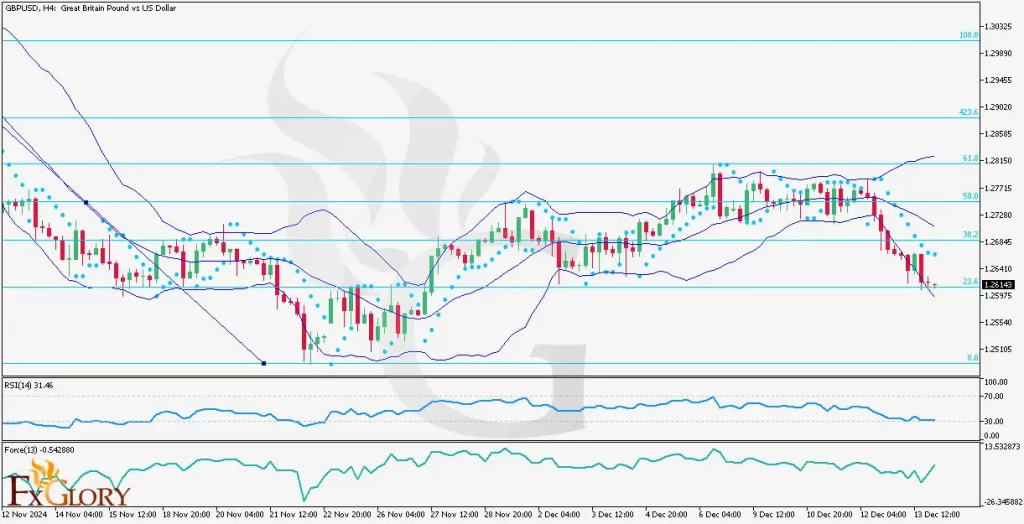
    On the H4 chart, GBPUSD is exhibiting a bearish movement. The price has declined steadily, reaching the 23.6% Fibonacci retracement level, which is acting as immediate support. The recent series of red candles confirms strong selling pressure, with no signs of reversal yet. If the price fails to hold above the 23.6% retracement level, further declines toward lower Fibonacci levels may occur.


    Key Technical Indicators
    Bollinger Bands: The price is trading in the lower half of the Bollinger Bands, approaching the lower band. This suggests the market is under bearish pressure, with the potential for oversold conditions if the price touches or breaches the lower band.
    Parabolic SAR: The dots are positioned above the candlesticks, signaling a strong downward trend. This reinforces the bearish momentum observed in the current price action.
    Relative Strength Index (RSI): The RSI stands at 31.46, nearing oversold territory. This suggests that while the pair is bearish, sellers might soon exhaust their momentum, which could result in a temporary pullback.
    Force Index: The Force Index is at -0.54, confirming the bearish dominance. Negative values indicate that selling pressure outweighs buying interest.


    Support and Resistance
    Support: Immediate support is located at 1.2600, aligning with the 23.6% Fibonacci retracement level and acting as a key floor for the price. The next support lies at 1.2550, a critical level where further selling pressure may pause.
    Resistance: The nearest resistance is at 1.2685, corresponding to the 38.2% Fibonacci retracement and a potential reversal area. The key resistance level is at 1.2728, aligning with the 50.0% Fibonacci retracement, which could trigger bullish momentum if breached.


    Conclusion and Consideration
    The GBPUSD pair is currently in a bearish phase on the H4 chart, as confirmed by key indicators like the Bollinger Bands, Parabolic SAR, RSI, and Force Index. A decisive break below the 23.6% Fibonacci level could open the door for further declines toward 1.2550. However, the RSI indicates the pair is approaching oversold conditions, which could trigger a brief corrective bounce. Fundamental releases, particularly the UK and US PMI data, will play a crucial role in determining the next move.
    Traders should monitor support at 1.2600 closely while considering volatility ahead of the PMI reports. A cautious approach is advised, especially with ongoing USD strength due to positive economic expectations.


    Disclaimer: The analysis provided for GBP/USD is for informational purposes only and does not constitute investment advice. Traders are encouraged to perform their own analysis and research before making any trading decisions on GBPUSD. Market conditions can change quickly, so staying informed with the latest data is essential.


    FXGlory
    12.16.2024

  4. #164
    Senior Member FXGlory Ltd's Avatar
    Join Date
    Mar 2024
    Posts
    185

    Visit FXGlory Ltd's Youtube Channel
    USDCAD H4 Technical and Fundamental Analysis for 12.17.2024


    Time Zone: GMT +2
    Time Frame: 4 Hours (H4)


    Fundamental Analysis:
    The USDCAD currency pair reflects the exchange rate between the U.S. Dollar (USD) and the Canadian Dollar (CAD). Today, key economic events for the CAD include multiple inflation data releases, such as CPI m/m (forecasted at 0.1%) and Core CPI m/m (expected at 0.4%). Lower-than-expected inflation data could signal subdued economic growth, potentially weakening the CAD. Simultaneously, significant U.S. economic releases include Core Retail Sales m/m (0.4%) and Retail Sales m/m (0.6%), which highlight consumer spending trends. If these data points outperform expectations, the USD may strengthen, increasing bullish pressure on the USD-CAD pair. Traders should remain attentive to these fundamental drivers as they could significantly impact price action throughout the session.


    Price Action:
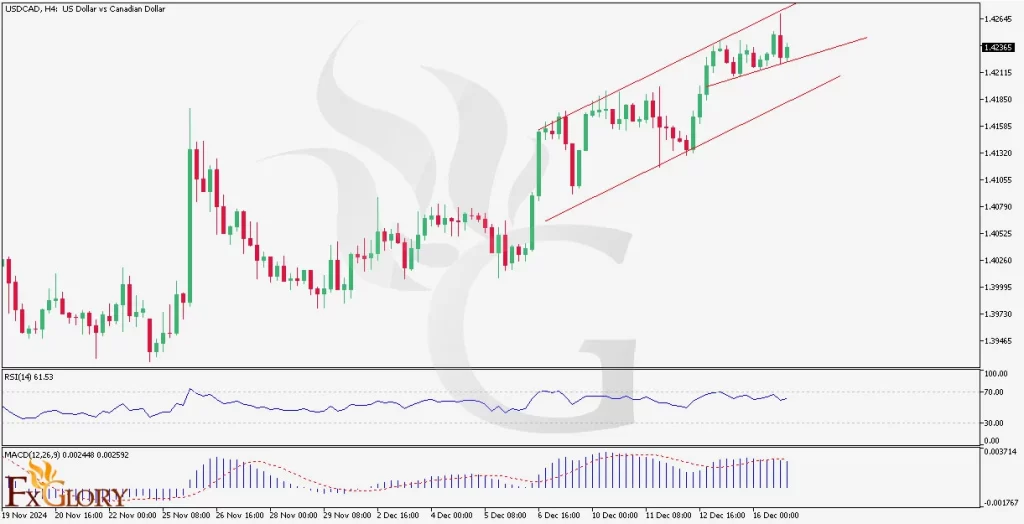
    The USD CAD H4 chart reveals that the pair is trading within an ascending channel, indicating a short-term bullish trend. However, price has encountered strong resistance near the upper boundary of the channel at 1.42650, where selling pressure is starting to emerge. The most recent candlesticks exhibit rejection at this level, showing long wicks and small bodies, signaling a weakening bullish momentum. If the price fails to break higher, it could trigger a pullback toward key support areas at 1.42000 and 1.41760, reflecting a bearish correction within the overall bullish structure.


    Key Technical Indicators:
    RSI (Relative Strength Index): The RSI currently reads 61.53, indicating moderately overbought conditions. A negative divergence is evident, with price forming higher highs while the RSI forms lower highs. This suggests weakening momentum and signals a potential sell opportunity as the bullish strength fades.
    MACD (Moving Average Convergence Divergence): The MACD line is curving downward, while the histogram shows shrinking bullish bars. This indicates a slowdown in upward momentum and confirms the negative divergence seen in the RSI. Traders should watch for a bearish crossover between the MACD line and signal line, which could validate a short-term correction.


    Support and Resistance Levels:
    Support: Immediate support is located at 1.42000, aligning with the lower boundary of the bearish channel and serving as a key area for potential rebounds. Additional support is found at 1.41760, marking a recent low that could attract buyers if the price continues to move downward.
    Resistance: The nearest resistance level is at 1.42578, coinciding with the upper boundary of the bearish channel. A further resistance level is identified at 1.42777, which represents a more significant hurdle for bullish attempts and aligns with a prior swing high.


    Conclusion and Consideration:
    The USD/CAD pair on the H4 timeframe shows signs of exhaustion near key resistance at 1.42650. The RSI and MACD indicators highlight a negative divergence, signaling weakening bullish momentum and a possible pullback. Traders should closely monitor upcoming Canadian CPI data and U.S. Retail Sales, as these releases will heavily influence the USD and CAD. A break below 1.42000 would confirm a bearish correction, while stronger U.S. data could sustain the USD’s bullish stance. Given the sensitivity to economic data, risk management is essential in navigating potential volatility.


    Disclaimer: The analysis provided for USD/CAD is for informational purposes only and does not constitute investment advice. Traders are encouraged to perform their own analysis and research before making any trading decisions on USDCAD. Market conditions can change quickly, so staying informed with the latest data is essential.


    FXGlory
    12.17.2024

  5. #165
    Senior Member FXGlory Ltd's Avatar
    Join Date
    Mar 2024
    Posts
    185

    Visit FXGlory Ltd's Youtube Channel
    EURUSD H4 Technical and Fundamental Analysis for 12.18.2024


    Time Zone: GMT +2
    Time Frame: 4 Hours (H4)


    Fundamental Analysis:
    The EUR/USD fundamental analysis is being viewed cautiously as traders await key economic events from both the Eurozone and the United States. In focus is the speech by Bundesbank President Joachim Nagel, a voting member of the ECB Governing Council, which could provide critical clues about the ECB's monetary policy outlook. A hawkish tone could support the Euro, while dovish remarks may extend bearish pressure. Additionally, the Eurozone Consumer Price Index (CPI) report will shed light on inflation levels, a key factor for ECB policy decisions. On the USD side, the Building Permits and Housing Starts data will be released, serving as a leading indicator of construction activity and overall economic health. A better-than-expected US outcome may strengthen the Dollar, reinforcing the bearish bias for EUR/USD.


    Price Action:
    The EUR/USD H4 candle chart reveals that the pair is stuck in a downward channel, indicating a persistent bearish trend. The EURUSD price action has been making lower highs and lower lows, confirming sellers' control. The pair is currently consolidating near the 1.0493 level but remains under pressure below the descending trendline. A breakout above 1.0520, the immediate resistance level, could signal a short-term reversal, while failure to break above this level may see the price decline toward the lower support levels.


    Key Technical Indicators:
    Ichimoku Cloud: The price is trading below the Ichimoku Cloud, highlighting a EUR/USD bearish bias. The cloud between 1.0500 and 1.0520 acts as a strong resistance zone. A sustained move above the cloud could signal a trend reversal, while rejection at this level will maintain the pair’s bearish outlook.
    RVI (Relative Vigor Index): The RVI (10) currently stands at -0.060, with the signal line slightly negative. This suggests a continuation of the bearish trend. A positive crossover near zero would be an early sign of a potential upward reversal.
    RSI (Relative Strength Index): The RSI (14) is at 45.76, reflecting a neutral to slightly bearish sentiment. If the RSI drops below 40, it will confirm increasing bearish momentum. A push above 50 would indicate growing bullish interest.


    Support and Resistance:
    Support Levels: The 1.0483 level, is the immediate support and the 1.0450 level is the Key lower support, aligning with the descending channel bottom.
    Resistance Levels: The 1.0520 level remains the Immediate resistance at the descending trendline and cloud boundary, followed by the next key resistance above the cloud 1.0545.


    Conclusion and Consideration:
    The EUR/USD forecast today on its H4 chart continues to show signs of a downtrend, as it remains confined within the descending channel. The bearish signals are reinforced by the Ichimoku Cloud resistance, the RSI below 50, and the RVI pointing downward. Traders should monitor 1.0520 for any breakout to the upside, which may indicate a short-term reversal, while failure to break resistance could push the pair toward 1.0483 and 1.0450. Upcoming Eurozone inflation data and Nagel’s speech could provide significant volatility, while strong US economic releases may strengthen the USD further. Traders are advised to exercise caution and implement robust risk management strategies given the current mixed market signals and fundamental events.


    Disclaimer: The analysis provided for EUR/USD is for informational purposes only and does not constitute investment advice. Traders are encouraged to perform their own analysis and research before making any trading decisions on EURUSD. Market conditions can change quickly, so staying informed with the latest data is essential.


    FXGlory
    12.18.2024

  6. #166
    Senior Member FXGlory Ltd's Avatar
    Join Date
    Mar 2024
    Posts
    185

    Visit FXGlory Ltd's Youtube Channel
    NZDUSD Daily Technical and Fundamental Analysis for 12.19.2024


    Time Zone: GMT +2
    Time Frame: 4 Hours (H4)


    Fundamental Analysis
    The NZDUSD reflects the exchange rate between the New Zealand Dollar (NZD) and the U.S. Dollar (USD). Today, the USD’s performance will be closely tied to the release of key economic data, including GDP figures and Initial Jobless Claims. Stronger-than-expected data may bolster the USD, adding downward pressure on the NZDUSD pair. Meanwhile, New Zealand’s economic sentiment may hinge on business confidence data and risk appetite in global markets. Given the divergence in economic outlooks, traders should expect significant volatility during the U.S. session, as these releases will provide insight into the Federal Reserve’s future monetary policy.


    Price Action
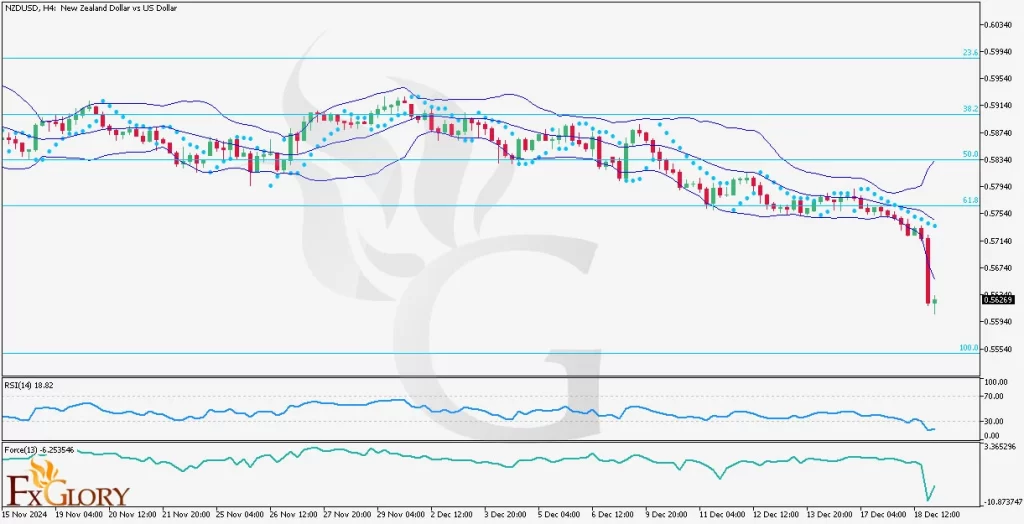
    In the H4 timeframe, the NZDUSD pair continues to exhibit a strong bearish trend. The price has broken below the lower Bollinger Band, indicating intense selling pressure. This sharp decline has pushed the pair into oversold territory, as shown by key momentum indicators. While there might be a temporary retracement, bearish dominance persists, suggesting further downside risk.


    Key Technical Indicators
    Bollinger Bands: The NZDUSD price has decisively breached the lower Bollinger Band, signaling strong bearish momentum. The widening bands reflect increased volatility, and the price trading outside the bands indicates an extreme move, which may lead to a short-term corrective pullback.
    Parabolic SAR: The Parabolic SAR dots are positioned above the candles, confirming the continuation of the bearish trend. This suggests that the downward momentum is firmly in place, and further declines are likely unless a significant reversal occurs.
    RSI (Relative Strength Index): The RSI is currently at 18.82, deep in the oversold zone. While this level indicates strong bearish sentiment, it also raises the possibility of a short-term correction as the market may temporarily stabilize or retrace before continuing its downward movement.
    Force Index: The Force Index, sitting at -6.23546, confirms the heavy selling pressure in the market. The negative value aligns with the bearish trend, signaling that bears remain in control without any immediate signs of reversal.


    Support and Resistance Levels
    Support: Immediate support is located at 0.5550, with a critical level at 0.5500, which aligns with the 100% Fibonacci retracement.
    Resistance: The nearest resistance is at 0.5620, coinciding with the middle Bollinger Band and a previous consolidation zone. Further resistance can be seen at 0.5680, aligning with the 61.8% Fibonacci retracement.


    Conclusion and Consideration
    The NZDUSD pair on the H4 chart is in a strong bearish trend, as confirmed by the technical indicators, including Bollinger Bands, Parabolic SAR, RSI, and Force Index. The breach of key support levels, coupled with oversold conditions, suggests that while bearish momentum remains dominant, a short-term retracement could occur. Fundamental data from the U.S. will be pivotal in shaping the pair’s direction in the coming sessions. Traders should remain cautious, as increased volatility is expected due to the release of major economic indicators.


    Disclaimer: The analysis provided for NZD/USD is for informational purposes only and does not constitute investment advice. Traders are encouraged to perform their own analysis and research before making any trading decisions on NZDUSD. Market conditions can change quickly, so staying informed with the latest data is essential.


    FXGlory
    12.19.2024

  7. #167
    Senior Member FXGlory Ltd's Avatar
    Join Date
    Mar 2024
    Posts
    185

    Visit FXGlory Ltd's Youtube Channel
    USD/CAD H4 Technical and Fundamental Analysis for 12.20.2024


    Time Zone: GMT +2
    Time Frame: 4 Hours (H4)


    Fundamental Analysis:
    The USD/CAD forecast reflects the economic and monetary policy interplay between the United States and Canada. Today’s USD/CAD news analysis includes upcoming U.S. data, with Personal Consumption Expenditures (PCE) and consumer spending reports, that will be key indicators of inflation trends and consumer behavior, potentially bolstering USD strength if data surprises to the upside. Simultaneously, Canada’s retail sales figures, including core retail sales excluding automobiles, will provide insights into domestic consumer activity. Stronger-than-expected Canadian data could lend support to the CAD by indicating robust consumer spending. However, any dovish undertone from Federal Reserve remarks during Mary Daly's interview may cap USD gains, highlighting the ongoing tug-of-war between the two currencies.


    Price Action:
    On the USD/CAD H4 chart, the price continues to trade within an ascending channel, indicating a clear USDCAD bullish trend. The pair’s price action has been making higher highs and higher lows, maintaining its upward momentum. Currently, it is approaching the upper boundary of the channel, suggesting a potential test of resistance. A break above the channel could signal a continuation of the rally, while rejection might lead to a retracement toward the channel's lower boundary.


    Key Technical Indicators:
    RSI (Relative Strength Index): The RSI is at 65.99, which signals bullish momentum but is approaching overbought territory. Traders should monitor for signs of a reversal or divergence as the RSI nears the 70 level.
    Bollinger Bands: The price is nearing the upper Bollinger Band, typically a dynamic resistance level. This could lead to a short-term pullback or consolidation, especially if the price fails to break decisively above this band. However, sustained movement along the band’s upper boundary indicates strong buying pressure.
    MACD (Moving Average Convergence Divergence): The MACD histogram is expanding positively, with the MACD line staying above the signal line, reinforcing the USD/CAD bullish momentum. This indicator suggests that the upward trend is still intact, with no immediate signs of weakening.


    Support and Resistance:
    Support Levels: Immediate support is located at 1.4280, near the midline of the Bollinger Bands. Below that, 1.4200 serves as the next key support level, aligning with the lower boundary of the ascending channel.
    Resistance Levels: The pair faces immediate resistance at 1.4450, the upper channel boundary. A breakout above this level could pave the way toward 1.4500, a psychological resistance level.


    Conclusion and Consideration:
    The USD/CAD analysis today remains firmly bullish on its H4 candle chart, supported by positive fundamentals and technical indicators. The RSI and MACD reflect sustained upward momentum, while the Bollinger Bands suggest caution as the price approaches overbought levels. Traders should closely monitor today’s economic releases from both the U.S. and Canada for potential catalysts. A breakout above the 1.4450 resistance could signal continued upside, while a rejection may prompt a retracement. Effective risk management, including stops near the support levels, is advisable given potential volatility from fundamental events.


    Disclaimer: The analysis provided for USD/CAD is for informational purposes only and does not constitute investment advice. Traders are encouraged to perform their own analysis and research before making any trading decisions on USDCAD. Market conditions can change quickly, so staying informed with the latest data is essential.


    FXGlory
    12.20.2024

  8. #168
    Senior Member FXGlory Ltd's Avatar
    Join Date
    Mar 2024
    Posts
    185

    Visit FXGlory Ltd's Youtube Channel
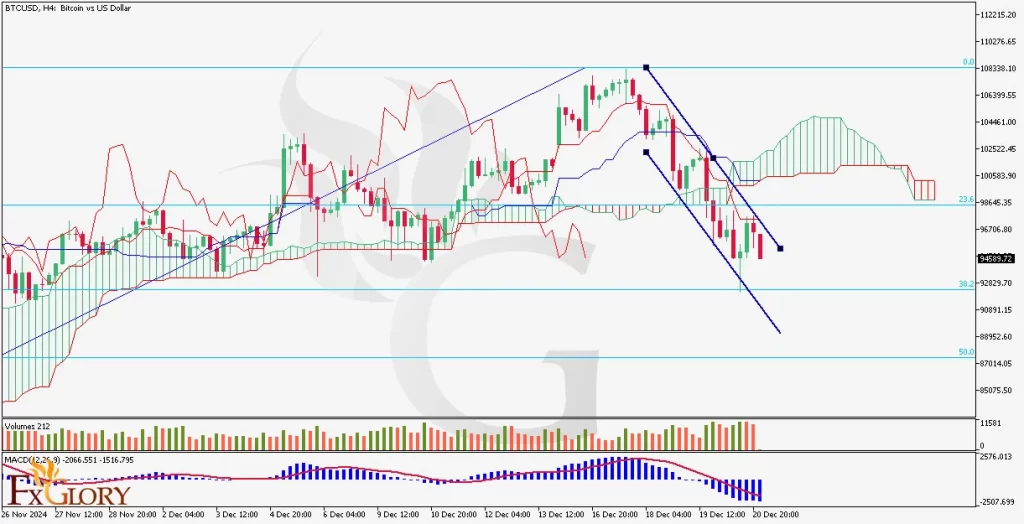
    BTCUSD Daily Technical and Fundamental Analysis for 12.23.2024


    Time Zone: GMT +2
    Time Frame: 4 Hours (H4)


    Fundamental Analysis:
    Bitcoin (BTC) has seen a significant decline in recent days following a broad sell-off in the cryptocurrency market. The bearish sentiment in BTCUSD coincides with a strengthening US Dollar (USD), driven by improved economic confidence indicators such as the US CB Consumer Confidence report expected later today. A higher-than-forecast result could further bolster the USD, applying downward pressure on BTC USD. Additionally, market participants remain cautious ahead of the next Federal Reserve meeting, which could reinforce the dollar's strength amid continued inflation concerns and higher interest rates. For Bitcoin, macroeconomic factors such as regulatory developments and adoption trends remain pivotal, but short-term trading may hinge on USD strength and risk sentiment.


    Price Action:
    The BTC/USD pair on the H4 timeframe reveals a sharp bearish trend. After reaching a significant high earlier in the month, the price has entered a pronounced downward channel. The formation of consecutive bearish candles with intermittent bullish corrections reflects persistent selling pressure. Notably, the price broke below the Ichimoku Cloud and the 23.6% Fibonacci retracement level, signaling a transition to bearish dominance. Currently, the pair is testing the 38.2% Fibonacci retracement level, which serves as a critical support zone.


    Key Technical Indicators:
    Ichimoku Cloud: The BTC/USD price has decisively broken below the Ichimoku Cloud, confirming bearish momentum. The lagging span is below the price action, and the cloud ahead is bearish (red), indicating further downside potential unless the price reclaims key levels above the cloud.
    Volumes: Trading volumes indicate strong selling activity. The spikes in volume accompanying bearish candles suggest heightened bearish sentiment, while lower volumes during bullish retracements reflect weak buying interest. This supports the continuation of the downward trend.
    MACD: The MACD line is well below the signal line, and the histogram shows increasing bearish momentum. The deepening divergence between the MACD and signal lines indicates that the bearish trend is gaining strength, with no immediate signs of a reversal.


    Support and Resistance:
    Support Levels: The first key support level is located at the 38.2% Fibonacci retracement level, which stands at $92,829.72. A further decline could see the price testing the next significant support at the 50.0% Fibonacci retracement level near $87,014.05, marking a critical zone for buyers to step in.
    Resistance Levels: The immediate resistance is positioned at the 23.6% Fibonacci retracement level of $98,645.35, which needs to be reclaimed to reduce bearish pressure. Beyond this, a stronger resistance awaits near $102,522.45, aligning with the upper boundary of the Ichimoku Cloud and previous support levels.


    Conclusion and Consideration:
    The BTC/USD pair in the H4 timeframe remains firmly in a bearish trend. Key technical indicators, including the Ichimoku Cloud, MACD, and Fibonacci levels, all point to sustained downward pressure. However, the upcoming US CB Consumer Confidence report may cause additional volatility, as positive data for the USD could weigh further on BTC-USD. Traders should monitor key support levels such as $92,829.72 and $87,014.05 for potential breakdowns or signs of reversal. Conversely, a recovery above the 23.6% Fibonacci level and the Ichimoku Cloud would be necessary to challenge the current bearish outlook.


    Disclaimer: The analysis provided for BTC/USD is for informational purposes only and does not constitute investment advice. Traders are encouraged to perform their own analysis and research before making any trading decisions on BTCUSD. Market conditions can change quickly, so staying informed with the latest data is essential.


    FXGlory
    12.23.2024

  9. #169
    Senior Member FXGlory Ltd's Avatar
    Join Date
    Mar 2024
    Posts
    185

    Visit FXGlory Ltd's Youtube Channel
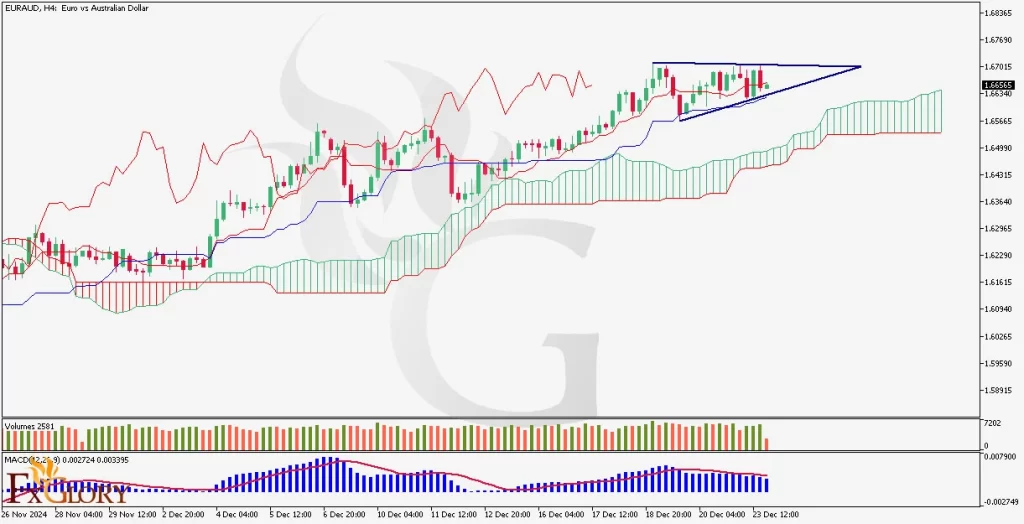
    EURAUD Daily Technical and Fundamental Analysis for 12.24.2024


    Time Zone: GMT +2
    Time Frame: 4 Hours (H4)


    Fundamental Analysis:
    The EUR/AUD currency pair is currently influenced by key fundamental factors. Today, the Eurozone is observing a German Bank Holiday, resulting in reduced liquidity for the EUR. This typically leads to lower trading volumes and can cause the EUR to exhibit subdued volatility. Conversely, the Australian Dollar (AUD) is set to react to the release of the Monetary Policy Meeting Minutes at 12:30 AM. Traders will be closely monitoring these minutes for insights into the Reserve Bank of Australia's (RBA) future monetary policy decisions, which could significantly impact the AUD's strength against the EUR. The interplay between reduced EUR liquidity and potential shifts in AUD policy outlooks is expected to shape the trading dynamics of the EURAUD pair today.


    Price Action:
    On the H4 timeframe, the EURAUD pair is demonstrating a bullish price action. The current price sits above the Ichimoku Cloud, indicating a strong upward momentum. Additionally, the price is forming a flag pattern, which suggests a continuation of the prevailing bullish trend after a brief consolidation phase. The pair has maintained its position above key support levels at 1.66172, 1.65700, and 1.65620, reinforcing the upward trajectory. This flag pattern, combined with the price being above the Ichimoku Cloud, points to a sustained bullish sentiment among traders, potentially leading to further upward movement in the near term.


    Key Technical Indicators:
    Ichimoku Cloud:
    On the EURAUD chart, the price and candles are positioned above the Ichimoku cloud, signaling a strong bullish trend. The Tenkan-sen is above the Kijun-sen, further confirming upward momentum, while the Chikou Span remains above the price action, adding additional bullish confirmation in this technical analysis.
    MACD (Moving Average Convergence Divergence): The MACD line is above the signal line and both are above the zero line, indicating robust bullish momentum. The expanding MACD histogram suggests increasing strength in the upward trend, and recent bullish crossovers reinforce the potential for continued price gains.
    Volume: Trading volume on the H4 timeframe for EURAUD is on the rise, supporting the bullish outlook as higher volumes accompany the upward price movement. The increasing volume during price advances indicates strong buying interest, reinforcing the likelihood of sustained bullish.


    Support and Resistance Levels:
    Support:
    Immediate support at 1.66172, where the price is currently consolidating. Further support levels are seen at 1.65700 and 1.65620, which could provide stronger buying interest if the price continues to decline.
    Resistance: Resistance is located at 1.67000, a recent level where price gains were capped. Additional resistance levels are at 1.67500 and 1.68000, where stronger selling pressure may re-emerge if the price rebounds.


    Conclusion and Consideration:
    The EURAUD pair on the H4 chart exhibits strong bullish momentum, supported by both fundamental and technical indicators. The price remains above the Ichimoku Cloud and is forming a flag pattern, suggesting a continuation of the upward trend. RSI and volume indicators further reinforce the buy signal, while the established support levels provide a safety net against potential pullbacks. However, traders should remain cautious of upcoming fundamental events, such as the release of the AUD Monetary Policy Meeting Minutes, which could introduce volatility. Additionally, the reduced EUR liquidity due to the German Bank Holiday may lead to unexpected price movements. Overall, the technical setup is favorable for bullish traders, but staying alert to fundamental developments is essential.


    Disclaimer: The analysis provided for EUR/AUD is for informational purposes only and does not constitute investment advice. Traders are encouraged to perform their own analysis and research before making any trading decisions on EURAUD. Market conditions can change quickly, so staying informed with the latest data is essential.


    FXGlory
    12.24.2024

  10. #170
    Senior Member FXGlory Ltd's Avatar
    Join Date
    Mar 2024
    Posts
    185

    Visit FXGlory Ltd's Youtube Channel
    GBP/USD H4 Technical and Fundamental Analysis for 12.27.2024


    Time Zone: GMT +2
    Time Frame: 4 Hours (H4)


    Fundamental Analysis:
    The GBP/USD news analysis today influenced by various economic events and market sentiment surrounding both the British Pound and the US Dollar. Key upcoming US data includes trade and inventory reports, as well as energy stock levels, which will likely impact USD demand. A strong trade balance or inventory data may bolster the USD. Conversely, with no immediate impactful UK economic data today, the market is focused on the broader monetary policy outlook from the Bank of England and global risk sentiment, both of which could affect the GBP. Economic divergence between the Federal Reserve and the Bank of England could set the tone for the medium-term GBPUSD trend.


    Price Action:
    On the GBP/USD H4 chart, the price has been trading within a defined range, showing signs of consolidation after a sharp recent downtrend. The pair’s price has been unable to break key resistance levels, indicating a lack of bullish momentum. The candlestick patterns suggest indecision among traders, as evidenced by repeated tests of both resistance and support levels without a clear breakout.


    Key Technical Indicators:
    Ichimoku Cloud: The price is trading below the Kumo (cloud), which signals GBPUSD’s bearish bias. However, a close above the Tenkan-Sen (red line) could indicate short-term bullish pressure. The Senkou Span A and B are diverging slightly, suggesting indecision but a predominantly bearish trend.
    MACD (Moving Average Convergence Divergence): The MACD line is below the signal line, with a negative histogram value, highlighting continued bearish momentum. However, the declining size of the histogram bars suggests that bearish pressure is waning, potentially signaling a shift in momentum.
    RSI (Relative Strength Index): Currently at 43.79, the RSI suggests neutral-to-bearish conditions, as the indicator remains below the 50-mark. This indicates that sellers still have control, but the market is not yet oversold.


    Support and Resistance:
    Support Levels: Immediate support is observed at 1.25143, followed by 1.24848. A break below these levels could trigger further downside momentum.
    Resistance Levels: Key resistance levels are at 1.25387 and 1.25639. A breach above these levels could confirm a bullish breakout and push the price higher toward 1.25965.


    Conclusion and Consideration:
    The GBP/USD H4 outlook today hints that the pair’s bearish trend is weakening, as indicated by the Ichimoku cloud, RSI, and MACD. However, the waning bearish momentum could signal potential consolidation or a reversal in the near term. Traders should closely monitor the upcoming US data releases and any geopolitical developments that might impact the GBP/USD forecast today. A breakout above 1.25387 would be a bullish confirmation, while a breakdown below 1.25143 could signal further downside risks.


    Disclaimer: The analysis provided for GBP/USD is for informational purposes only and does not constitute investment advice. Traders are encouraged to perform their own analysis and research before making any trading decisions on GBPUSD. Market conditions can change quickly, so staying informed with the latest data is essential.


    FXGlory
    12.27.2024

Page 17 of 19 FirstFirst ... 7 15 16 17 18 19 LastLast

Bookmarks

Posting Permissions

  • You may not post new threads
  • You may not post replies
  • You may not post attachments
  • You may not edit your posts
  •