Page 16 of 16 FirstFirst ... 6 14 15 16
Results 151 to 156 of 156

Daily Forex Analysis By FXGlory

This is a discussion on Daily Forex Analysis By FXGlory within the Analytics and News forums, part of the Trading Forum category; EURCAD Daily Technical and Fundamental Analysis for 11.25.2024 Time Zone: GMT +2 Time Frame: 4 Hours (H4) Fundamental Analysis: The ...


  1. #151
    Senior Member FXGlory Ltd's Avatar
    Join Date
    Mar 2024
    Posts
    157

    Visit FXGlory Ltd's Youtube Channel
    EURCAD Daily Technical and Fundamental Analysis for 11.25.2024


    Time Zone: GMT +2
    Time Frame: 4 Hours (H4)


    Fundamental Analysis:
    The EURCAD pair is influenced today by key news releases for both the Eurozone and Canada. For the Euro, significant market-moving events include the German ifo Business Climate Index, the Belgian National Bank Business Confidence survey, and a speech by ECB member Joachim Nagel. The ifo survey, being a leading economic health indicator, is expected to shape sentiment toward Eurozone growth, while Nagel’s remarks could provide insight into future ECB monetary policy directions. Meanwhile, for Canada, quarterly corporate earnings data is scheduled. Positive results could support CAD by indicating improved business conditions. This fundamental backdrop sets the stage for a potentially volatile trading session, with traders looking for signals from economic indicators and central bank rhetoric.


    Price Action:
    On the H4 timeframe, EURCAD is in a bearish trend, with the pair posting lower highs and lower lows. Recent price action has demonstrated a clear breakdown below the mid-line of the Bollinger Bands, confirming downward momentum. The latest candles are forming near the lower Bollinger Band, hinting at oversold conditions. However, the lack of strong reversal signals suggests the bearish trend may persist, albeit with potential retracements.


    Key Technical Indicators:
    Bollinger Bands: The price is trading in the lower half of the Bollinger Bands, with recent candles hugging the lower band. This confirms strong bearish momentum but also suggests the potential for a pullback. Narrowing bands indicate decreasing volatility, often preceding a breakout or trend continuation.
    Stochastic Oscillator: The Stochastic Oscillator has just exited the oversold zone (crossing above 20), signaling a possible corrective bounce in the near term. However, the overall trend remains bearish, and the signal lacks strong upward momentum.
    MACD (Moving Average Convergence Divergence): The MACD line remains below the signal line, with a declining histogram. This bearish setup indicates sustained selling pressure, with no immediate signs of a reversal.
    Parabolic SAR: The Parabolic SAR dots are positioned above the candles, signaling a continuation of the bearish trend. Recent adjustments in the SAR position reaffirm the downward momentum, though traders should watch for any flips to signal potential trend shifts.


    Support and Resistance:
    Support: The 1.4492 level serves as a key support, representing previous lows. A breach of this level could intensify the ongoing bearish momentum.
    Resistance: The 1.4722 level stands as the closest resistance, corresponding to the recent breakdown area and the mid-point of the Bollinger Bands. Any upward retracement is likely to encounter selling pressure around this level.


    Conclusion and Consideration:
    The EURCAD H4 chart reveals a strong bearish trend supported by technical indicators like Bollinger Bands, MACD, and Parabolic SAR. While the Stochastic Oscillator hints at a minor retracement, the overall sentiment remains bearish. Upcoming fundamental events, including the ifo survey and Canadian corporate earnings, could inject volatility, making the 1.4492 support level crucial for monitoring further price action. Traders should remain cautious, especially with potential reversals from oversold conditions, while closely observing fundamental triggers.


    Disclaimer: The analysis provided for EUR/CAD is for informational purposes only and does not constitute investment advice. Traders are encouraged to perform their own analysis and research before making any trading decisions on EURCAD. Market conditions can change quickly, so staying informed with the latest data is essential.


    FXGlory
    11.25.2024

  2. #152
    Senior Member FXGlory Ltd's Avatar
    Join Date
    Mar 2024
    Posts
    157

    Visit FXGlory Ltd's Youtube Channel
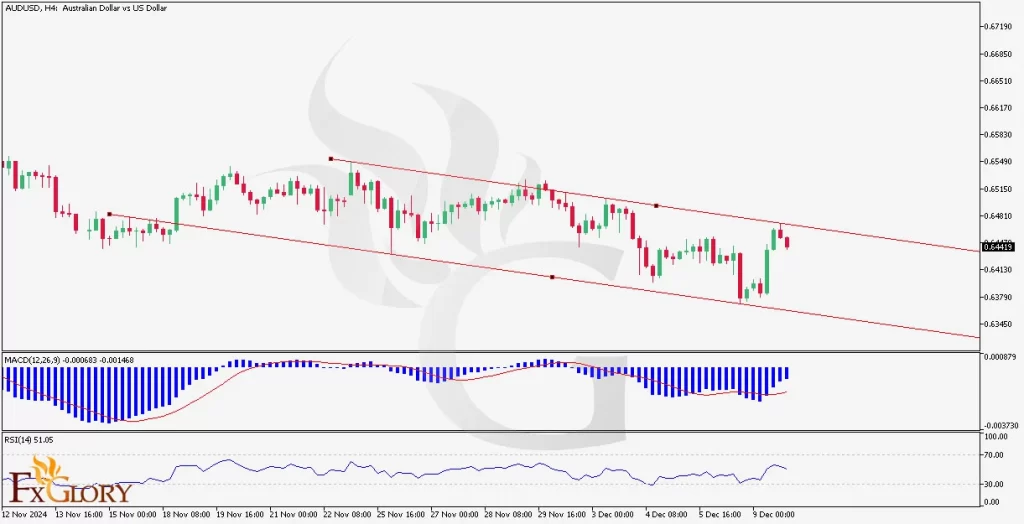
    AUDUSD H4 Technical and Fundamental Analysis for 11.27.2024


    Time Zone: GMT +2
    Time Frame: 4 Hours (H4)


    Fundamental Analysis:
    The AUD/USD news analysis today suggests the pair is under pressure as it navigates through mixed fundamental signals from both the Australian and U.S. economies. On the Australian side, the recent focus has been on inflation and construction data. The Australian Bureau of Statistics has highlighted that the next Consumer Price Index (CPI) release, due in early January, will be critical in shaping market expectations for the Reserve Bank of Australia's (RBA) monetary policy. Rising inflation could prompt a more hawkish stance from the RBA, while subdued price growth may maintain the current dovish bias. Additionally, the construction activity data, which plays a vital role in GDP and employment, points to broader economic health and spending trends. On the U.S. front, the release of GDP second estimates, durable goods orders, and jobless claims today could further strengthen the U.S. Dollar if the data beats expectations, highlighting the economic resilience of the U.S. economy. This creates a complex backdrop, where near-term AUD/USD price action will likely be driven by U.S. economic updates, while Australian fundamentals will continue to shape the pair’s longer-term forecasts.


    Price Action:
    On the AUD/USD H4 candle chart, its price is trading in a bearish trend, forming lower highs and lower lows. Recent price action shows a retracement toward the middle Bollinger Band, suggesting a temporary pause in the downtrend. The pair continues to test support near 0.6440, a critical level that has held on several occasions. A decisive break below this level could accelerate further downside momentum, while a rebound might target resistance around 0.6500.


    Key Technical Indicators:
    Bollinger Bands: The price is oscillating near the lower Bollinger Band, signaling AUDUSD’s strong bearish bias. A touch of the middle band could act as a dynamic resistance, while a breach of the lower band might indicate further downside pressure.
    Stochastic Oscillator: Currently at 37.63, the Stochastic Oscillator is moving toward oversold territory. This indicates that the bearish momentum may slow down, but there’s no strong signal for a reversal yet.
    MACD (Moving Average Convergence Divergence): The MACD histogram is in negative territory, and the MACD line is below the signal line, confirming the bearish trend. However, the histogram's narrowing suggests weakening momentum.


    Support and Resistance:
    Support Levels: Immediate support is located at 0.6440, followed by a deeper level at 0.6400 if the bearish trend intensifies.
    Resistance Levels: The first resistance lies near 0.6500 (middle Bollinger Band), with stronger resistance at 0.6550.


    Conclusion and Consideration:
    The AUD/USD outlook today on its H4 chart remains bearish, with technical indicators and price action reinforcing the downward momentum. While the Stochastic Oscillator suggests that the pair may soon approach oversold levels, the MACD and Bollinger Bands point to further potential downside. Traders should watch for a break below the 0.6440 support or a rebound toward 0.6500 for a clearer direction. The pair’s Fundamental signals, particularly from the U.S., are likely to dictate short-term movements. Risk management strategies, such as stop-losses, are essential when trading this volatile pair.


    Disclaimer: The analysis provided for AUD/USD is for informational purposes only and does not constitute investment advice. Traders are encouraged to perform their own analysis and research before making any trading decisions on AUDUSD. Market conditions can change quickly, so staying informed with the latest data is essential.


    FXGlory
    11.27.2024

  3. #153
    Senior Member FXGlory Ltd's Avatar
    Join Date
    Mar 2024
    Posts
    157

    Visit FXGlory Ltd's Youtube Channel
    USDCAD H4 Technical and Fundamental Analysis for 11.28.2024


    Time Zone: GMT +2
    Time Frame: 4 Hours (H4)


    Fundamental Analysis:
    The USD/CAD pair is experiencing a period of low liquidity as US banks are closed today in observance of Thanksgiving Day. This can lead to irregular volatility and decreased market activity, making price movements more susceptible to speculation. While the USD typically shows weaker momentum due to the bank holiday, the CAD may be influenced by Canada's economic data. Today's CAD news release focuses on the trade balance, where a larger-than-expected surplus could strengthen the Canadian dollar, while a lower-than-expected figure could provide support for the USD. The reduced trading volume could also increase the impact of any unexpected news.


    Price Action:
    The USDCAD pair had been in a bullish trend for the last several sessions, but recent price action suggests a shift towards bearishness. The price is currently trading between the 61.8% and 50% Fibonacci retracement levels, indicating a retracement after the recent bullish surge. The last few candles have been red, signaling a decrease in buying momentum and a potential shift towards a short-term bearish trend. Additionally, volume has been decreasing, which further supports the possibility of a consolidation or reversal in the near term.


    Key Technical Indicators:
    Parabolic SAR:
    The Parabolic SAR dots are now placed above the candles, signaling a shift from a bullish to a bearish trend. This suggests that the upward momentum has been exhausted and that the price may be heading lower in the short term.
    Bollinger Bands: The Bollinger Bands have recently expanded, indicating a period of increased volatility. The price has moved from the upper band to the middle band and even dipped below it in recent candles, which is typically a bearish sign. The price action suggests that the bullish momentum has weakened, and there is a growing chance of a further pullback towards the lower band.
    RSI (Relative Strength Index): The RSI is currently below the overbought level of 70 but has been declining, indicating a loss of bullish momentum. With the RSI approaching neutral territory (around 50), the market sentiment appears to be shifting towards a more neutral or even bearish bias in the near term.
    Volume: Volume has been decreasing, which suggests weakening market participation and a lack of conviction in the current trend. Lower volume typically indicates that a trend may be losing momentum and could be due for a reversal or consolidation.


    Support and Resistance:
    Support:
    Immediate support is found around the 1.3360 level, aligning with the 50% Fibonacci retracement and recent price consolidation. A break below this level could open the door to further downside towards 1.3280, the next significant support level.
    Resistance: The nearest resistance level is at 1.3450, which corresponds to the 61.8% Fibonacci retracement level. If the price manages to push above this resistance, it could retest the recent highs near 1.3500.


    Conclusion and Consideration:
    The technical analysis of USD/CAD on the H4 timeframe shows signs of a potential bearish reversal after a sustained bullish trend. The Parabolic SAR and RSI indicate weakening bullish momentum, while the Bollinger Bands suggest a shift from volatility to a more neutral price action. With the price currently consolidating between the 50% and 61.8% Fibonacci levels, a breakout either above 1.3450 or below 1.3360 will likely determine the next significant move. Traders should be cautious of irregular volatility due to the low liquidity caused by the US bank holiday and monitor the CAD-related news for any potential market-moving data. A stronger-than-expected Canadian trade balance could lead to further downside for USD CAD.


    Disclaimer: The analysis provided for USD/CAD is for informational purposes only and does not constitute investment advice. Traders are encouraged to perform their own analysis and research before making any trading decisions on USDCAD. Market conditions can change quickly, so staying informed with the latest data is essential.


    FXGlory
    11.28.2024

  4. #154
    Senior Member FXGlory Ltd's Avatar
    Join Date
    Mar 2024
    Posts
    157

    Visit FXGlory Ltd's Youtube Channel
    EURGBP H4 Technical and Fundamental Analysis for 11.29.2024


    Time Zone: GMT +2
    Time Frame: 4 Hours (H4)


    Fundamental Analysis:
    The EUR/GBP fundamental forecast today is influenced by economic indicators from both the Eurozone and the UK. Recently, the Eurozone has seen mixed economic data, with key indicators such as retail sales and consumer price inflation showing moderate growth. For the British pound, ongoing concerns about inflation and the Bank of England's monetary policy decisions remain central to its performance. Market participants are keenly watching for any hawkish signals from the Bank of England regarding interest rate hikes, which could further support the GBP. Additionally, geopolitical factors and external trade relations within the EU and UK continue to have a notable impact on the currency pair's news outlook.


    Price Action:
    On the EUR/GBP 4-hour (H4) chart, the market appears to be in a consolidation phase, with the price moving between a defined support and resistance range. Recently, the HER/GBP price action tested the support level at 0.8740 but has managed to recover slightly, showing a small upward bias. A series of lower highs and higher lows suggest indecision in the market, and traders are waiting for a breakout in either direction. The upcoming data releases and speeches from key central bank figures, particularly from the European Central Bank (ECB) and Bank of England, could provide the necessary catalysts for a decisive move.


    Key Technical Indicators:
    Ichimoku Cloud: The price is currently trading near the middle of the Ichimoku cloud, indicating a neutral trend. However, the cloud’s future projection suggests a potential EURGBP bearish bias if the price falls below the lower cloud boundary at 0.8750. If the price stays above the cloud, it could indicate a continuation of the sideways consolidation, with a possible bullish breakout if the price breaks above 0.8800.
    MACD: The MACD line is slightly above the signal line, indicating mild bullish momentum. However, the histogram is close to zero, suggesting that momentum is weakening. A clear bullish crossover could be a signal for a potential rally, but traders should be cautious of any bearish crossovers that could signal a reversal.
    Volume: Trading volume has been decreasing, indicating lower participation in the market. This is typical during periods of consolidation. An increase in volume could confirm a breakout or breakdown, providing traders with more confidence in the direction of the trend.


    Support and Resistance:
    Support Levels: The key support level is at 0.8740, which has held up in recent sessions. A breakdown below this level could expose further support at 0.8680.
    Resistance Levels: The immediate resistance is at 0.8800, with further resistance seen around the 0.8850 region. A breakout above this level could open the door for a more significant move toward 0.8900.


    Conclusion and Consideration:
    The EUR/GBP H4 outlook shows the pair is in a consolidation phase, with key support and resistance levels defining the pair’s price action. Traders should closely monitor upcoming economic data releases and central bank speeches for potential clues about future monetary policy direction. A breakout above 0.8800 or below 0.8740 could set the tone for the next move. While the MACD is showing some bullish momentum, the weakening volume suggests that a strong move may not materialize unless accompanied by a significant news event. Therefore, risk management remains crucial, and traders should be prepared for potential volatility.


    Disclaimer: The analysis provided for EUR/GBP is for informational purposes only and does not constitute investment advice. Traders are encouraged to perform their own analysis and research before making any trading decisions on EURGBP. Market conditions can change quickly, so staying informed with the latest data is essential.


    FXGlory
    11.29.2024

  5. #155
    Senior Member FXGlory Ltd's Avatar
    Join Date
    Mar 2024
    Posts
    157

    Visit FXGlory Ltd's Youtube Channel
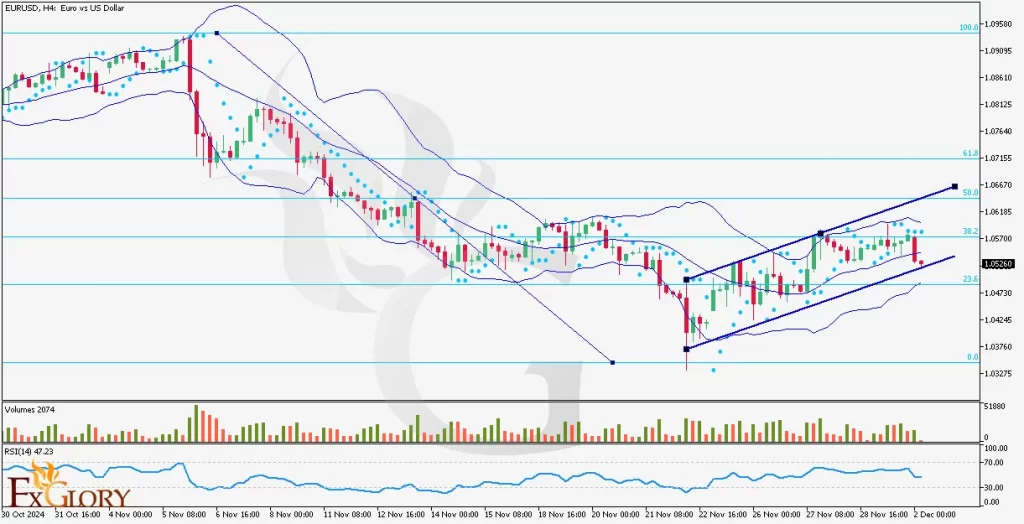
    EURUSD H4 Technical and Fundamental Daily Analysis for 12.02.2024


    Time Zone: GMT +2
    Time Frame: 4 Hours (H4)


    Fundamental Analysis:
    The EURUSD pair, reflecting the exchange rate between the Euro and the US Dollar, remains a focus for traders due to upcoming high-impact economic data from both regions. For the Eurozone, recent PMI data reflects contraction in the manufacturing sector, raising concerns about economic stagnation. Unemployment reports from Eurostat provide mixed signals, highlighting limited growth in labor market conditions. For the US Dollar, attention shifts to today’s ISM Manufacturing PMI and Construction Spending data. If these reports exceed expectations, the USD could gain strength, driven by positive economic momentum in the US manufacturing sector.
    With divergent economic trajectories, the EURUSD is likely to face significant volatility as traders evaluate the implications of PMI data for future monetary policies by the European Central Bank (ECB) and the Federal Reserve. A stronger-than-expected PMI release from the US could push the EURUSD lower, while weak data could favor the Euro.


    Price Action:
    The EURUSD H4 chart indicates a moderately bullish trend within a rising channel. Recent candles show consolidation near the middle Bollinger Band, suggesting a slowdown in bullish momentum. Price action has remained within the upper half of the Bollinger Bands for most of the current trend, confirming positive sentiment. However, the last two candles have shown bearish pressure, with the price nearing the middle band, signaling possible short-term consolidation or retracement.


    Key Technical Indicators:
    Bollinger Bands: The price has been trading in the upper half of the Bollinger Bands for the past several sessions, reflecting bullish momentum. The recent candles, however, are near the middle band, indicating reduced momentum and potential consolidation. A breakdown below the middle band could lead to further downside toward the lower band.
    RSI (Relative Strength Index): The RSI is currently at 47.23, signaling neutral momentum. The indicator is neither overbought nor oversold, suggesting that the EURUSD could move in either direction depending on market sentiment and upcoming data.
    Volumes: Volume analysis shows a decline in activity during the recent consolidation phase, reflecting uncertainty in market sentiment. A spike in volume could indicate a breakout in either direction.
    Parabolic SAR: Parabolic SAR dots are currently positioned above the price, reinforcing bearish pressure in the short term. A reversal in these dots below the price would signal a renewed bullish trend.

    Support and Resistance Levels:
    Support: Immediate support is located at 1.0520, aligning with the 23.6% Fibonacci retracement level and serving as a key psychological zone. If this level is breached, the next significant support could be lower, near the 1.0480 area.
    Resistance: Intermediate resistance is at 1.0570, corresponding to the 38.2% Fibonacci retracement level, which has acted as a short-term ceiling. Key resistance lies at 1.0618, near the 50.0% Fibonacci level, representing a crucial barrier for further bullish momentum.


    Conclusion and Consideration:
    The EURUSD H4 analysis suggests that while the pair remains within an ascending channel, the recent price action indicates waning bullish momentum. Traders should watch for a potential breakdown below the middle Bollinger Band, which could lead to a test of the 23.6% Fibonacci support at 1.0520. On the other hand, a bullish breakout above 1.0570 could open the door for further gains toward 1.0618. Upcoming PMI and Construction Spending data will likely dictate near-term direction. Traders should approach with caution and adjust their strategies based on the evolving market environment.


    Disclaimer: The analysis provided for EUR/USD is for informational purposes only and does not constitute investment advice. Traders are encouraged to perform their own analysis and research before making any trading decisions on EURUSD. Market conditions can change quickly, so staying informed with the latest data is essential.


    FXGlory
    12.02.2024

  6. #156
    Senior Member FXGlory Ltd's Avatar
    Join Date
    Mar 2024
    Posts
    157

    Visit FXGlory Ltd's Youtube Channel
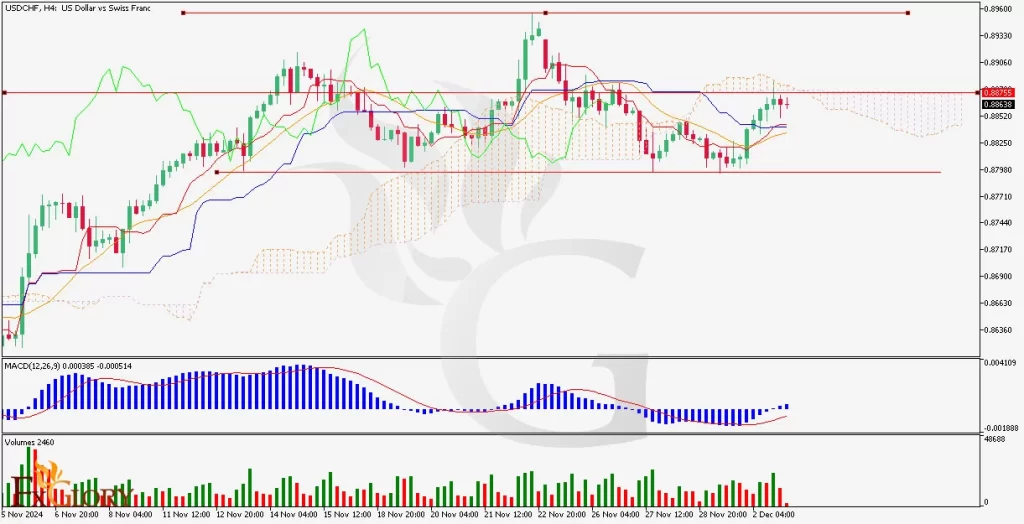
    USDCHF H4 Technical and Fundamental Analysis for 12.03.2024


    Time Zone: GMT +2
    Time Frame: 4 Hours (H4)


    Fundamental Analysis:
    The USD/CHF currency pair is set to experience significant movements today influenced by key economic indicators. The United States will release the JOLTS Job Openings at 3:00 PM, with expectations slightly higher at 7.49M compared to the previous 7.44M. An increase in job openings typically signals a strengthening labor market, potentially boosting the USD. Concurrently, Switzerland will publish its Consumer Price Index (CPI) at 7:30 AM, remaining steady at -0.1%. The unchanged CPI suggests stable inflationary pressures in Switzerland, which may support the Swiss Franc (CHF) if economic stability persists. Traders will closely watch these releases as they are critical for determining the future direction of the USDCHF pair in the H4 timeframe.


    Price Action:
    On the H4 chart, USDCHF shows a transition from a recent bearish phase to consolidation with a slight upward bias. The price is testing a resistance zone near 0.88625, while maintaining support levels within the Ichimoku Cloud. The candles indicate indecision, with lower wicks suggesting buying pressure and upper wicks highlighting resistance. This price action reflects a potential preparation for a breakout.


    Key Technical Indicators:
    Ichimoku Cloud:
    The Ichimoku Cloud shows mixed signals. The price is trading near the lower boundary of the cloud, suggesting weak bullish momentum. The Tenkan-sen (red line) is above the Kijun-sen (blue line), indicating a possible bullish continuation. However, the overall structure suggests caution as the price remains below the cloud's upper boundary, which could act as resistance.
    MACD (Moving Average Convergence Divergence): The MACD shows a slight bullish bias. The MACD line has crossed above the signal line, and the histogram is printing small positive bars, signaling mild bullish momentum. However, the momentum is not strong, and traders should watch for potential shifts if the histogram weakens or reverses.
    Volumes: The volume indicator reflects moderate buying interest, with green bars outpacing red in recent candles. However, the volume has not seen a significant spike, indicating that the current upward move lacks strong market conviction. An increase in volume near key levels would be a better confirmation of a breakout.


    support and Resistance Levels:
    Support:
    Immediate support is located at 0.88050, which aligns with the lower Ichimoku Cloud boundary and recent price lows. Additional support levels are found at 0.87925 and 0.87800, acting as key zones for potential rebounds if the price moves downward.
    Resistance: The nearest resistance level is at 0.88625, coinciding with the top of the current consolidation range. Further resistance levels are identified at 0.88888, which is a key swing high, and 0.89567, marking a previous significant high.


    Conclusion and Consideration:
    The USDCHF pair on the H4 chart is at a critical juncture, with the price consolidating near resistance while supported by moderate bullish signals from technical indicators. The Ichimoku Cloud and MACD suggest a cautious bullish bias, while volume indicates limited momentum. Key economic data releases for USD and CHF today are likely to trigger significant moves, and traders should watch for a breakout above 0.88625 or a drop below 0.88050 to confirm the next trend. It is essential to monitor volume and indicator reactions near these levels for clearer signals.


    Disclaimer: The analysis provided for USD/CHF is for informational purposes only and does not constitute investment advice. Traders are encouraged to perform their own analysis and research before making any trading decisions on USDCHF. Market conditions can change quickly, so staying informed with the latest data is essential.


    FXGlory
    12.03.2024

Page 16 of 16 FirstFirst ... 6 14 15 16

Bookmarks

Posting Permissions

  • You may not post new threads
  • You may not post replies
  • You may not post attachments
  • You may not edit your posts
  •