
 LinkBack URL
 About LinkBacks


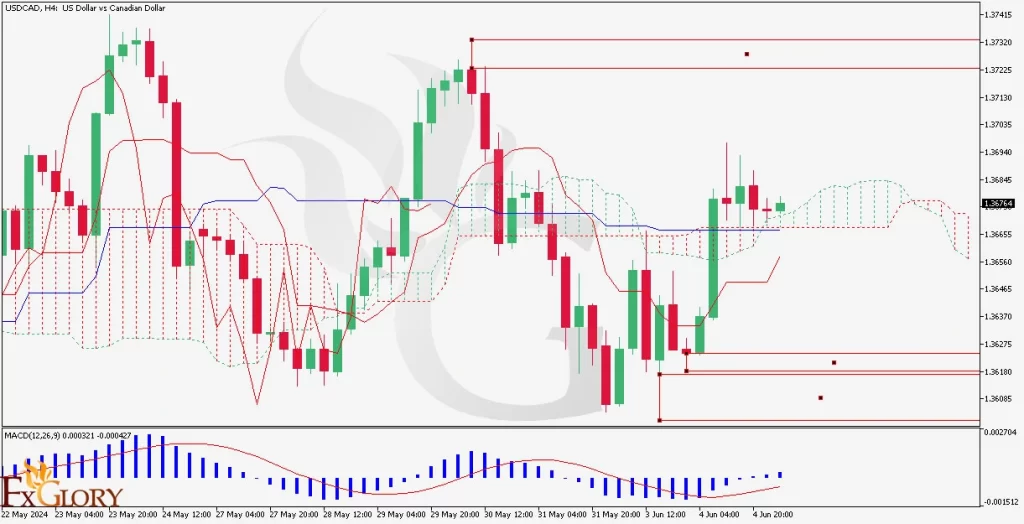
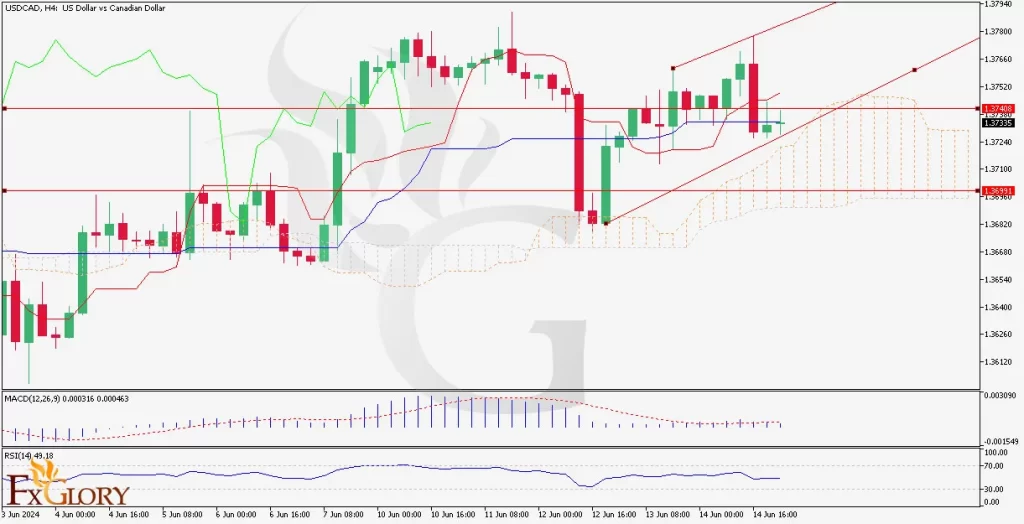
USDCAD Price Analysis for 05.06.2024
Time Zone: GMT +3
Time Frame: 4 Hours (H4)
Fundamental Analysis:
The USDCAD pair continues to be influenced by a combination of economic data and geopolitical factors. Recent US economic reports, such as strong employment figures and ongoing inflation concerns, are pushing the Federal Reserve towards potential interest rate hikes, thereby strengthening the US Dollar. This, in turn, affects the USDCAD currency trend. Additionally, Canadian economic data and oil prices play significant roles in shaping the pair's movements. Staying updated with the USDCAD news analysis is crucial for understanding the broader market dynamics.
Price Action:
On the H4 timeframe, USDCAD is showing a mixed market sentiment. While the price is above the Ichimoku cloud, suggesting an uptrend, the red cloud indicates potential future bearishness. The candles are above the cloud, with the base line (Kijun-sen) in the cloud and the conversion line (Tenkan-sen) below the candles. The market appears to be ranging, awaiting a clear direction.
[B]Key Technical Indicators: [B]
Ichimoku Cloud: The last cloud on the USDCAD chart is red, signaling possible future bearish sentiment. The candles are above the cloud, indicating a current uptrend. The base line is in the cloud, and the conversion line is below the candles, suggesting consolidation.
Order block: Identified order blocks indicate key support and resistance areas. Monitoring the markets reaction to these areas is crucial for potential trading opportunities.
Support and Resistance:
Support Levels: Watch for reactions around key support zones, which may provide buy opportunities if the price bounces.
Resistance Levels: Key resistance areas could serve as sell points if the price fails to break through.
[B]Conclusion and Consideration: [B]
The USDCAD pair exhibits a mixed sentiment on the H4 chart. While the current uptrend is indicated by the price being above the Ichimoku cloud, the red cloud suggests caution due to potential bearish future movements. The MACD also points to a downtrend, adding to the mixed signals. Traders should closely watch the market's reaction to the identified order blocks and key support and resistance levels.
Disclaimer: This analysis is for informational purposes only and does not constitute investment advice. Traders should conduct their own research and analysis before making any trading decisions.
FxGlory
05.06.2024


 Reply With Quote


Bookmarks