Page 8 of 15 FirstFirst ... 6 7 8 9 10 ... LastLast
Results 71 to 80 of 150

Daily Forex Analysis By FXGlory

This is a discussion on Daily Forex Analysis By FXGlory within the Analytics and News forums, part of the Trading Forum category; GBPUSD H4 Technical and Fundamental Analysis for 07.11.2024 Time Zone: GMT +3 Time Frame: 4 Hours (H4) Fundamental Analysis: The ...


  1. #71
    Senior Member FXGlory Ltd's Avatar
    Join Date
    Mar 2024
    Posts
    151

    Visit FXGlory Ltd's Youtube Channel

    Daily Forex Analysis By FXGlory

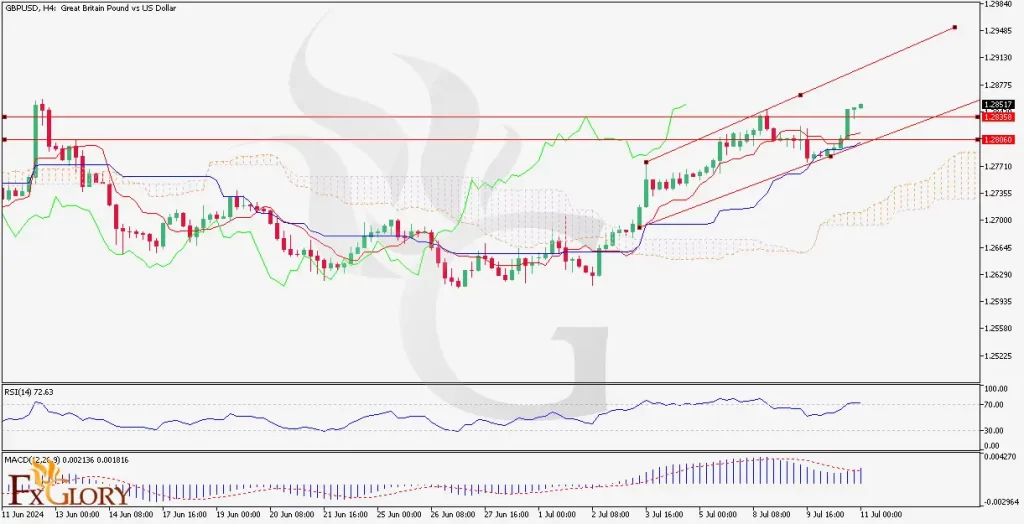
    GBPUSD H4 Technical and Fundamental Analysis for 07.11.2024


    Time Zone: GMT +3
    Time Frame: 4 Hours (H4)


    Fundamental Analysis:

    The GBP/USD news analysis today is influenced by various economic indicators and news events from both the United Kingdom and the United States. The UK economy is currently facing challenges related to inflation, GDP growth, and trade balance, while the US is experiencing fluctuations due to inflation data, employment figures, and Federal Reserve policies. Today's economic calendar for the USD includes high-impact events such as the Core CPI, CPI m/m, and CPI y/y reports, which are critical indicators of inflation and can significantly impact the USD's value. Additionally, the Unemployment Claims report is expected, which will provide insights into the US labor market. For the GBP, recent releases include GDP, construction output, and trade balance data, which collectively shape the market sentiment toward the GBP.


    Price Action:

    The GBP/USD H4 chart reveals the pair’s strong bullish trend with the Cable’s price action moving within an ascending channel. The pair has recently bounced off the lower boundary of the channel, indicating a potential continuation of the upward movement. The price is currently testing a key resistance level around 1.2850. A breakout above this level could lead to further gains, while a rejection might see the price retrace towards the support level.


    [B]Key Technical Indicators: [B]

    Ichimoku Cloud:

    The price is above the Kumo (cloud), indicating a bullish trend. The Tenkan-sen (red line) is above the Kijun-sen (blue line), further supporting the bullish momentum. The Chikou Span (green line) is also above the price, confirming the uptrend.

    RSI (Relative Strength Index):
    The RSI is currently at 72.63, indicating overbought conditions. This suggests that the price may face some resistance and could potentially see a pullback or consolidation before resuming its upward trend.

    MACD (Moving Average Convergence Divergence):
    The MACD histogram is positive, and the MACD line is above the signal line, indicating bullish momentum. This supports the continuation of the upward movement in the GBP/USD pair.


    [B]Support and Resistance: [B]

    Support Levels:
    The nearest support level is at 1.2806, followed by a stronger support around 1.2700, which is aligned with the lower boundary of the ascending channel.

    Resistance Levels:
    The immediate resistance level is at 1.2850. If the price breaks above this level, the next significant resistance is around 1.2940.


    Conclusion and Consideration:

    The GBP/USD forecast today on the pair’s H4 chart is exhibiting strong bullish momentum, supported by positive signals from the Cable’s technical analysis today, and key indicators such as the RSI, Ichimoku Cloud, and MACD. Traders should
    monitor the price action around the 1.2850 resistance level for potential breakouts or reversals. Given the overbought condition indicated by the RSI, a pullback to support levels around 1.2806 or 1.2700 is possible before the pair resumes its upward trend. It's crucial to stay updated with the upcoming high-impact economic releases from the US, particularly the CPI reports and Unemployment Claims, as they can significantly influence the USD and, consequently, the pair itself.


    Disclaimer: The provided analysis is for informational purposes only and does not constitute investment advice. Traders should conduct their own research and analysis before making any trading decisions.


    FXGlory
    07.11.2024

  2. #72
    Senior Member FXGlory Ltd's Avatar
    Join Date
    Mar 2024
    Posts
    151

    Visit FXGlory Ltd's Youtube Channel
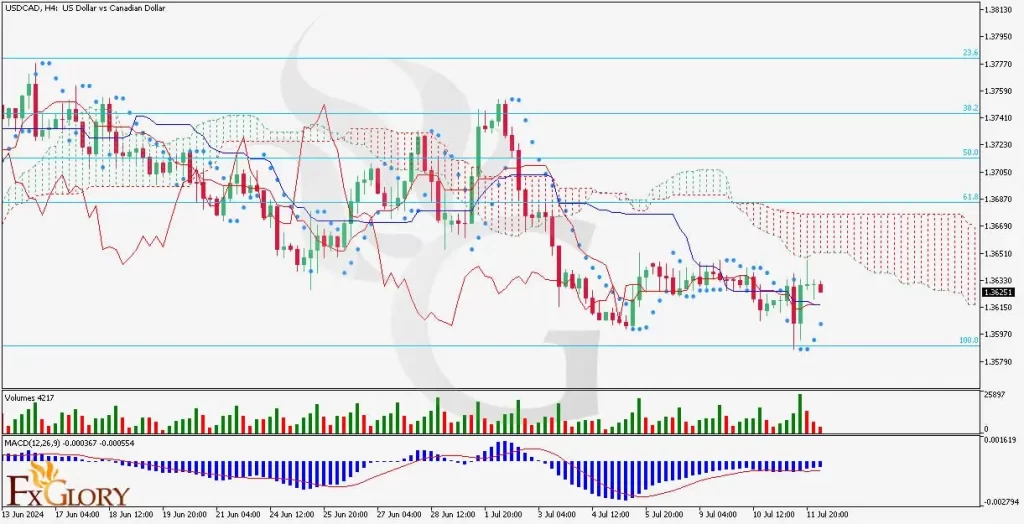
    USDCAD H4 Daily Fundamental and Technical Analysis for 12.07.2024


    Time Zone: GMT +3
    Time Frame: 4 Hours (H4)


    Fundamental Analysis:
    The USDCAD forex pair represents the exchange rate between the US Dollar (USD) and the Canadian Dollar (CAD). Today, significant attention will be on USD due to high-impact economic releases including Core PPI (forecasted at 0.2%), PPI (forecasted at 0.1%), and Preliminary UoM Consumer Sentiment (forecasted at 68.5). These releases are crucial as they provide insights into producer inflation and consumer sentiment, which are leading indicators of overall economic activity. Positive figures can strengthen USD, leading to upward pressure on the USDCAD pair. On the CAD side, low impact is expected from the Building Permits m/m release, forecasted at -5.0%, which could show a slight downturn in construction activity.


    Price Action:
    The USDCAD H4 chart shows the price action moving within a defined range, with recent candles indicating consolidation. The price recently touched the support levels around 1.3580 before attempting a recovery. However, the bearish momentum appears to dominate, with resistance levels near 1.3687 acting as a barrier for further upward movement.


    Key Technical Indicators:
    Parabolic SAR (0.2): The last four dots of the Parabolic SAR have been under the candles, indicating a bullish reversal attempt. However, the overall trend remains uncertain as these signals often need confirmation from other indicators.
    Ichimoku Cloud: The Ichimoku Cloud is red and has widened, indicating bearish momentum. The candles are positioned below the cloud, reinforcing the bearish sentiment in the market.
    Volumes: Trading volume has shown fluctuations, with recent bars indicating lower activity, which may suggest a lack of strong buying interest or a consolidation phase before a potential breakout.
    MACD: The MACD indicator shows the MACD line slightly below the signal line with a histogram indicating weak bearish momentum. This suggests that while the overall trend is bearish, there could be room for a short-term bullish correction.


    Support and Resistance:
    Support Levels: The immediate support is at 1.3580, followed by a stronger support level at 1.3579.
    Resistance Levels: The key resistance levels are at 1.3687 (aligned with the 61.8% Fibonacci retracement level) and 1.3720.


    Conclusion and Consideration:
    The USDCAD pair is currently facing mixed signals. Fundamentally, USD has the potential for strengthening due to positive economic data, while CAD is expected to show minimal impact from the Building Permits release. Technically, indicators suggest bearish momentum but with signs of a potential short-term bullish correction. Traders should monitor the high-impact USD data releases closely as they are likely to influence the pair's direction significantly.


    Disclaimer: The USDCAD provided analysis is for informational purposes only and does not constitute investment advice. Traders should conduct their own research and analysis of USDCAD before making any trading decisions. Market conditions can change rapidly, and it is essential to stay updated with the latest information.


    FXGlory
    12.07.2024
    Attached Thumbnails Attached Thumbnails Daily Forex Analysis By FXGlory-usdcad_h4_daily_fudamental_and_technical_analysis_for_12_07_2024.jpg  
    Last edited by FXGlory Ltd; 07-13-2024 at 09:00 PM.

  3. #73
    Senior Member FXGlory Ltd's Avatar
    Join Date
    Mar 2024
    Posts
    151

    Visit FXGlory Ltd's Youtube Channel

    Daily Forex Analysis By FXGlory

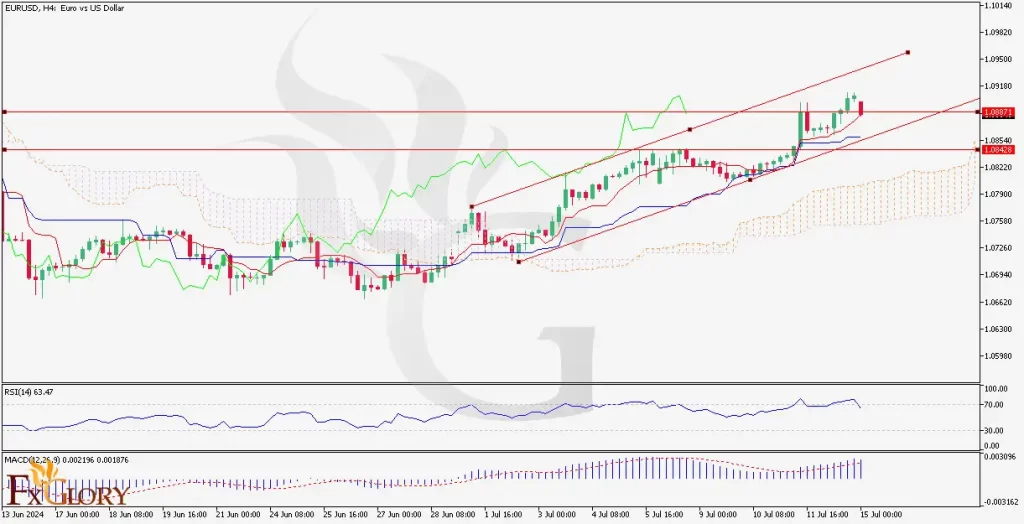
    EURUSD H4 Technical and Fundamental Analysis for 07.15.2024


    Time Zone: GMT +3
    Time Frame: 4 Hours (H4)


    Fundamental Analysis:

    The EUR/USD news analysis today is influenced by several fundamental factors. Recent data from Eurostat indicates changes in the industrial production of the Eurozone, with the latest figures showing a positive trend, suggesting economic recovery. The upcoming Eurogroup meeting could further impact the EUR/USD forecast today as finance ministers discuss economic policies. On the USD side, key events include the Empire State Manufacturing Index, which provides insights into business conditions in New York state, and speeches by Federal Reserve officials, including Jerome Powell and Mary Daly, which could provide clues about future monetary policy.


    Price Action:

    The EUR/USD H4 chart shows a consistent uptrend within a rising channel. The price has been making higher highs and higher lows, indicating the Fiber’s strong bullish trend. Currently, the pair’s price action shows that it is testing the upper boundary of the channel, suggesting potential resistance. A correction may occur before the pair continues its upward trajectory.


    Key Technical Indicators:

    Ichimoku Cloud:

    The price is trading above the Ichimoku Cloud, indicating the bullish trend of the pair. The cloud itself is also rising, further supporting the bullish outlook. The conversion line (blue) is above the baseline (red), which is another bullish signal.

    RSI (Relative Strength Index):

    The RSI is at 63.47, which is in the bullish territory but not yet overbought. This suggests that there is still room for the price to move higher before hitting overbought conditions.

    MACD (Moving Average Convergence Divergence):

    The MACD line is above the signal line, and the histogram shows positive values, indicating bullish momentum. However, the histogram bars are decreasing, which may suggest a weakening in the bullish momentum.


    Support and Resistance:

    Support Levels:
    The immediate support is at 1.0843, followed by a stronger support level at 1.0750.

    Resistance Levels:
    The immediate resistance is at 1.0987. If the price breaks above this level, the next target would be 1.1050.


    Conclusion and Consideration:

    The EUR/USD technical analysis today shows the Fiber’s strong bullish signs on the H4 chart, supported by key technical indicators like the Ichimoku Cloud, RSI, and MACD. While the RSI indicates there is still room for growth, traders should watch for potential resistance at the current levels. The pair’s Fundamental factors such as economic data releases from the Eurozone and the US, as well as comments from Federal Reserve officials, could impact the pair's movement. Traders should consider these events and use proper risk management techniques, including stop losses, given the potential for volatility.


    Disclaimer: The provided analysis is for informational purposes only and does not constitute investment advice. Traders should conduct their own research and analysis before making any trading decisions.


    FXGlory
    07.15.2024

  4. #74
    Senior Member FXGlory Ltd's Avatar
    Join Date
    Mar 2024
    Posts
    151

    Visit FXGlory Ltd's Youtube Channel
    EURCAD H4 Technical and Fundamental Analysis for 07.16.2024


    Time Zone: GMT +3
    Time Frame: 4 Hours (H4)


    Fundamental Analysis:
    The EUR/CAD forecast today reflects the economic health and policy decisions of the Eurozone and Canada. For the Euro, upcoming data releases such as the IT Trade Balance, EZ Trade Balance, and ZEW Economic Sentiment Index are key indicators. Positive trade balance figures and optimistic sentiment from institutional investors can boost the Euro. Conversely, Canada's economic health is gauged by indicators like housing starts and various Consumer Price Index (CPI) measures. A higher-than-expected CPI may prompt a hawkish stance from the Bank of Canada, strengthening the CAD.


    Price Action:
    The EUR/CAD H4 chart is in a clear uptrend, characterized by higher highs and higher lows. The pair is currently trading above key support levels and is testing a significant resistance zone. The EUR/CAD price action indicates the pair’s strong bullish momentum, suggesting further potential upside.


    Key Technical Indicators:
    Parabolic SAR:
    The Parabolic SAR dots are positioned below the current price, indicating an ongoing uptrend. This supports the bullish sentiment, suggesting the trend is likely to continue unless a significant reversal occurs.
    RSI (Relative Strength Index):
    The RSI is at 80.51, indicating overbought conditions. This suggests that the bullish momentum might be due for a correction, as the price has reached an extreme level. Traders should be cautious of potential pullbacks.
    MACD (Moving Average Convergence Divergence):
    The MACD histogram is positive, with the MACD line above the signal line. This bullish crossover signals strong upward momentum, confirming the uptrend in price action.


    Support and Resistance:
    Support Levels:
    The nearest support is at 1.48143, with additional support at 1.47500. These levels are critical for maintaining the current uptrend.
    Resistance Levels:
    The pair is facing resistance at 1.48727 and a stronger resistance at 1.49300. A break above these levels could signal a continuation of the bullish trend.


    Conclusion and Consideration:
    The EUR/CAD H4 chart demonstrates its robust bullish signals, with the Parabolic SAR, MACD, and recent price action supporting further upside. However, the RSI indicates overbought conditions, suggesting a possible short-term pullback or consolidation. Traders should monitor key resistance levels for potential breakouts while setting stop losses near support levels to manage risk. The pair’s Fundamental news releases for both the Eurozone and Canada will be crucial in influencing market sentiment and price direction.


    Disclaimer: The provided analysis is for informational purposes only and does not constitute investment advice. Traders should conduct their own research and analysis before making any trading decisions.


    FXGlory
    07.16.2024
    Attached Thumbnails Attached Thumbnails Daily Forex Analysis By FXGlory-audusdh4-1024x524.jpg  
    Last edited by FXGlory Ltd; 07-17-2024 at 07:55 AM.

  5. #75
    Senior Member FXGlory Ltd's Avatar
    Join Date
    Mar 2024
    Posts
    151

    Visit FXGlory Ltd's Youtube Channel
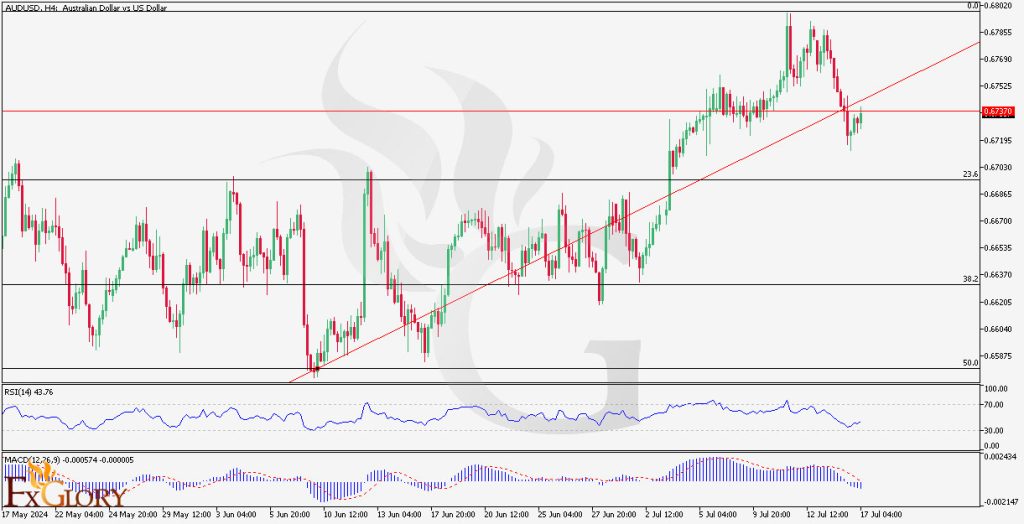
    http://AUD/USD H4 Technical and Fund...for 07.16.2024


    Time Zone: GMT +3
    Time Frame: 4 Hours (H4)


    Fundamental Analysis:
    The AUD/USD forecast today is shaped by the economic health and policy decisions in both the United States and Australia. For the US, today's data releases include Building Permits and Housing Starts, both crucial indicators of the housing market's strength. Additionally, the Industrial Production m/m and Capacity Utilization Rate are key economic indicators to watch. Statements from FOMC Members Barkin and Waller, as well as the release of the Beige Book, will provide insights into the Fed's economic outlook and potential policy changes. Crude Oil Inventories will also be monitored, given their influence on market sentiment and the broader economy.


    Price Action:
    The AUD/USD H4 chart shows a mixed sentiment, with the price recently breaking below a significant support zone. Despite this, the pair has maintained a series of higher highs and higher lows, indicating a still-bullish trend overall. However, the recent break suggests potential for a trend reversal. Traders should closely monitor the price action for further signals of a change in trend.


    Key Technical Indicators:
    RSI (Relative Strength Index): The RSI is currently at 46.54, slightly below the neutral 50 level, indicating weakening bullish momentum. This supports the potential for further bearish moves unless the RSI rebounds above 50.
    MACD (Moving Average Convergence Divergence): The MACD histogram is negative, with the MACD line below the signal line. This bearish crossover confirms the downside risk indicated by the price action and Parabolic SAR.


    Support and Resistance:
    Support Levels: The nearest support is at 0.6600, with additional support at 0.6550. These levels are crucial for maintaining the broader uptrend.
    Resistance Levels: The pair is facing resistance at 0.6700, with stronger resistance at 0.6750. A break above these levels could signal a continuation of the bullish trend.


    Conclusion and Consideration:
    The AUD/USD H4 chart presents mixed signals, with the recent price action and technical indicators suggesting a potential trend reversal. The Parabolic SAR and MACD indicate bearish momentum, while the overall trend remains bullish. Traders should watch key support and resistance levels closely for potential breakouts or further bearish developments. Fundamental news releases for both the US and Australia will be crucial in influencing market sentiment and price direction. Monitoring these developments can provide valuable insights for trading decisions.


    Disclaimer: The provided analysis is for informational purposes only and does not constitute investment advice. Traders should conduct their own research and analysis before making any trading decisions.


    FXGlory
    07.17.2024

  6. #76
    Senior Member FXGlory Ltd's Avatar
    Join Date
    Mar 2024
    Posts
    151

    Visit FXGlory Ltd's Youtube Channel

    Daily Forex Analysis By FXGlory

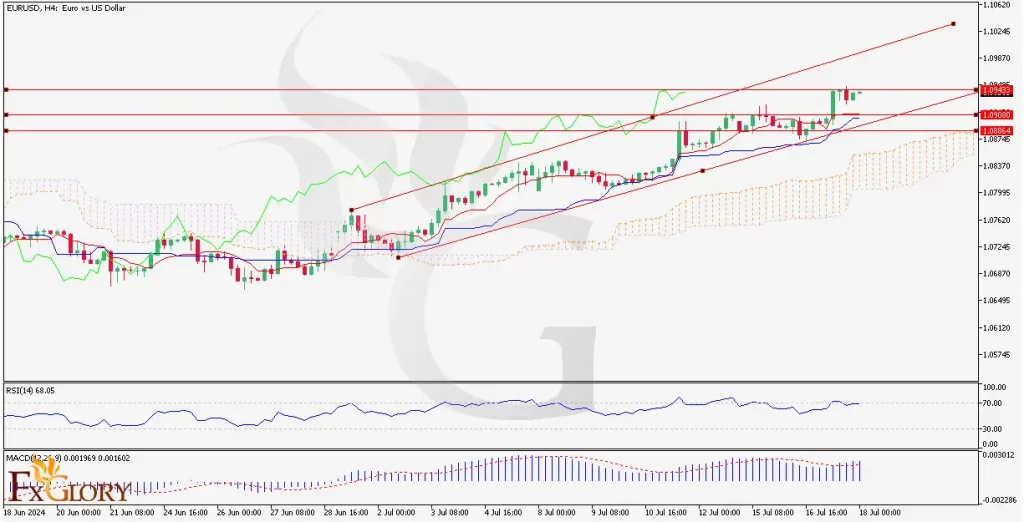
    EURUSD H4 Technical and Fundamental Analysis for 18.07.2024


    Time Zone: GMT +3
    Time Frame: 4 Hours (H4)


    Fundamental Analysis:

    The EUR/USD forecast today is heavily influenced by the economic releases from Europe and the U.S. For the Euro, factors like the results from bond auctions by the General Secretariat of the Treasury and statements from the ECB provide key insights into fiscal health and monetary policy decisions. Upcoming ECB interest rate decisions and statements could affect the Euro's strength. For the U.S., key data like unemployment claims and the Philly Fed Manufacturing Index serve as indicators of economic health, influencing the USD. Increased jobless claims could weaken the USD, whereas a positive manufacturing report could strengthen it.


    Price Action:

    The EUR/USD H4 chart timeframe shows a narrowing ascending channel pattern, indicating a steady uptrend but with resistance nearing the upper channel line. The EUR/USD pair also known as the Fiber, still has its price above the Ichimoku cloud, suggesting the pair’s bullish market environment. However, the Fiber’s price action also shows resistance levels are being tested, indicating potential points where the price momentum might pause or reverse.


    Key Technical Indicators:

    Ichimoku Cloud:

    The price is above the Ichimoku Cloud, supporting the current bullish trend. However, the narrowing of the cloud could suggest upcoming volatility or a potential trend shift.

    RSI (Relative Strength Index):

    The RSI is at 68.05, nearing the overbought territory, which could suggest a potential pullback or stabilization in price movements.

    MACD (Moving Average Convergence Divergence):

    The MACD shows a slight divergence above its signal line, indicating bullish momentum but with caution as the histogram bars are small, suggesting a lack of strong momentum.


    Support and Resistance:

    Support Levels:
    The nearest support is observed at the lower boundary of the ascending channel and the Ichimoku Cloud, around 1.0884.

    Resistance Levels:
    Immediate resistance is seen at the upper channel line and the recent high at 1.0938. A break above this could lead to further bullish movement towards the 1.1000 level.


    Conclusion and Consideration:
    The EUR/USD technical analysis today is displaying bullish signs on the H4 chart, supported by technical indicators like MACD and position above the Ichimoku Cloud. Traders should keep an eye on the resistance at 1.0938, as a breakout could confirm continued bullish trends. The EUR/USD fundamental analysis based on the recent events in the Eurozone and the U.S. could heavily influence the direction, so staying updated with these can be crucial for timely decision-making.


    Disclaimer: The provided analysis is for informational purposes only and does not constitute investment advice. Traders should conduct their own research and analysis before making any trading decisions.


    FXGlory
    18.07.2024

  7. #77
    Senior Member FXGlory Ltd's Avatar
    Join Date
    Mar 2024
    Posts
    151

    Visit FXGlory Ltd's Youtube Channel
    USDCAD Technical and Fundamental Analysis for 19.07.2024


    Time Zone: GMT +3
    Time Frame: 4 Hours (H4)


    Fundamental Analysis:
    The USD/CAD forex pair, reflecting the exchange rate between the US Dollar (USD) and the Canadian Dollar (CAD), is poised for a volatile session given today's economic data releases. The USD is under scrutiny with low-impact events such as TIC Long-Term Purchases, which came in significantly lower than forecasted at -54.6B versus the expected 98.4B. Additionally, speeches from multiple FOMC members, including Daly, Bowman, Williams, and Bostic, are expected to provide further insights into future monetary policy, potentially influencing USD volatility. On the CAD side, high-impact data such as Core Retail Sales and Retail Sales, both forecasted at -0.5%, will be pivotal. These indicators are key gauges of consumer spending and economic health, likely to cause significant market movements if the actual figures deviate from expectations.


    Price Action:
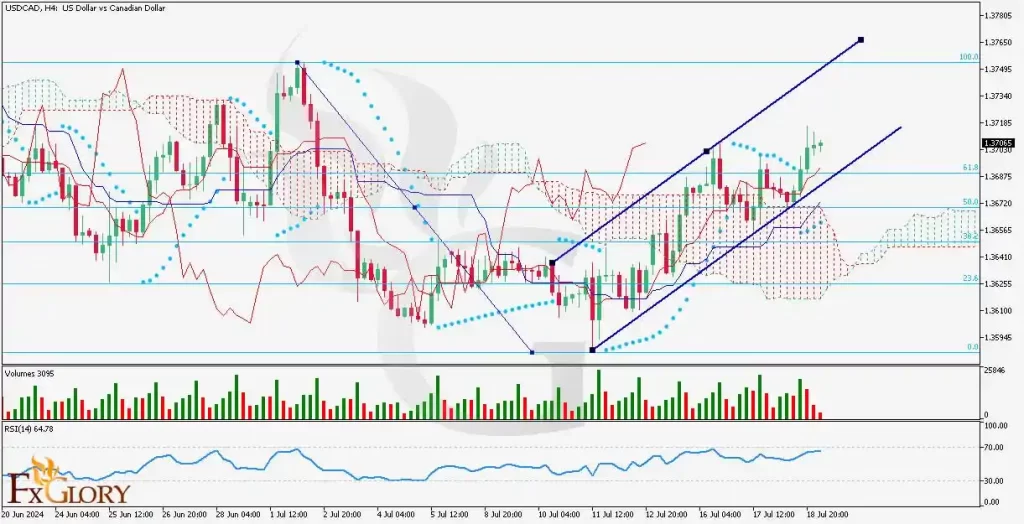
    The USDCAD H4 chart shows a clear bullish trend. Over the past five candles, all have been bullish, indicating strong upward momentum. The price has broken through and passed the Ichimoku cloud, signifying a potential shift to a stronger bullish phase. The bullish candles suggest that the buyers are in control, pushing the price higher with each session.


    Key Technical Indicators:
    Ichimoku Cloud:
    The USDCAD price has moved above the Ichimoku cloud, a strong bullish signal suggesting that the trend might continue upwards. The cloud acts as a support zone, and breaking above it indicates a shift in momentum.
    Volumes: The last three volume bars are red, indicating selling pressure despite the bullish price action. This divergence suggests caution, as increasing volume on bearish candles could signal potential weakness in the uptrend.
    RSI (Relative Strength Index): The RSI is currently at 64.78, which is below the overbought level of 70. This suggests that there is still room for further upward movement before the market becomes overbought, supporting the bullish scenario.
    Parabolic SAR: The Parabolic SAR dots are positioned below the last four candles, indicating a bullish trend. This indicator confirms the upward momentum and supports the continuation of the current trend.


    Support and Resistance:
    Support Levels:
    Immediate support is located at 1.3650, which aligns with the 50% Fibonacci retracement level and the lower boundary of the recent bullish channel.
    Resistance Levels: The nearest resistance level is at 1.3785, which corresponds with the 78.6% Fibonacci retracement level and the upper boundary of the bullish channel.


    Conclusion and Consideration:
    The USDCAD H4 chart analysis shows a strong bullish trend, supported by the Ichimoku cloud, Volume, RSI, and Parabolic SAR indicators. The pair is currently experiencing robust upward momentum, with potential to reach higher resistance levels if the bullish trend continues. However, traders should remain cautious of upcoming economic data releases and FOMC member speeches, as these could introduce volatility and impact the current trend.


    Disclaimer:
    The analysis provided for USDCAD is for informational purposes only and does not constitute investment advice. Traders should perform their own research and analysis before making any trading decisions. Market conditions can change rapidly, and it is crucial to stay updated with the latest information.


    FXGlory
    19.07.2024

  8. #78
    Senior Member FXGlory Ltd's Avatar
    Join Date
    Mar 2024
    Posts
    151

    Visit FXGlory Ltd's Youtube Channel
    BTCUSD Daily Technical and Fundamental Analysis for 22.07.2024


    Time Zone: GMT +3
    Time Frame: 4 Hours (H4)


    Fundamental Analysis:
    Today's BTC/USD pair could be significantly impacted by U.S. political developments, notably President Biden's unexpected decision to withdraw from the 2024 election and endorse Kamala Harris. This surprise political shift could introduce high volatility in the USD, potentially influencing Bitcoin as investors may look to cryptocurrencies as alternative investments during periods of uncertainty in traditional markets.


    Price Action Analysis:
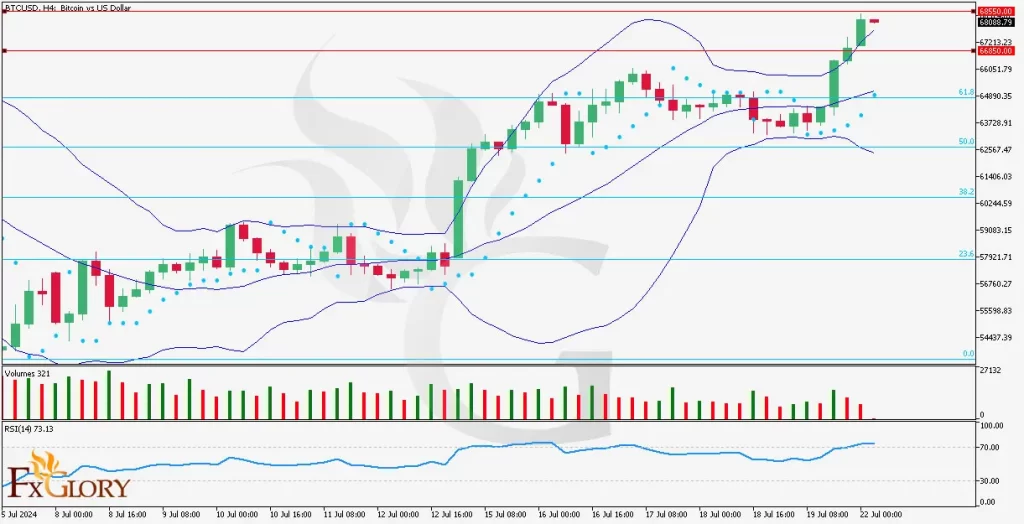
    The BTC/USD chart shows a robust uptrend in the H4 timeframe, with recent candles demonstrating strong bullish momentum. The price has repeatedly touched and exceeded the upper Bollinger Band, suggesting strong buying interest. The series of higher highs indicates a continued positive sentiment among traders, pushing the price upwards.


    Analysis of Key Technical Indicators:
    Bollinger Bands:
    The bands are widening, indicating increased market volatility. The price touching the upper band suggests a strong upward trend but also signals potential overbought conditions which could lead to a temporary pullback.
    Parabolic SAR (0.2): The positioning of the Parabolic SAR points below the candles confirms the current bullish trend, providing additional support levels for price movement.
    Volume: The last three candles show red volume bars, indicating that while the price is increasing, it might be on decreasing trading volume. This could suggest a weakening of the current trend or potential consolidation.
    RSI: The Relative Strength Index is over 70, supporting the strong bullish sentiment in the market. However, being in the overbought zone also raises the caution of a possible reversal or retracement, especially if the price faces resistance around $68,550.


    Support and Resistance Levels:
    Support:
    The primary support level is currently at around $66,850, providing a cushion should the price retract.
    Resistance: The immediate resistance is observed near $68,550. Breaking this level could lead to further highs, potentially testing new resistance levels.


    Conclusion and Consideration:
    The current technical setup in BTC/USD on the H4 chart suggests a strong bullish trend, supported by several indicators. However, the potential overbought conditions indicated by the RSI and the Bollinger Bands call for cautious trading. Investors and traders should keep an eye on the mentioned support and resistance levels for potential entry or exit points.


    Disclaimer: This analysis is for informational purposes only and should not be considered financial advice. Perform your own research and consult with a financial advisor. Market conditions can change rapidly, and it is crucial to stay informed and prepared for volatility, especially with impending significant U.S. political news.


    FXGlory
    22.07.2024

  9. #79
    Senior Member FXGlory Ltd's Avatar
    Join Date
    Mar 2024
    Posts
    151

    Visit FXGlory Ltd's Youtube Channel
    USDJPY H4 Technical and Fundamental Analysis for 07.23.2024


    Time Zone: GMT +3
    Time Frame: 4 Hours (H4)


    Fundamental Analysis:
    The USD/JPY news analysis today is influenced by several fundamental factors, including economic indicators from the United States and Japan. For the USD, upcoming data from the National Association of Realtors and the Federal Reserve Bank of Richmond are crucial. Home resales, which reflect consumer confidence and economic health, can significantly impact the USD. Similarly, the Richmond Fed Index provides insights into manufacturing activity, which is vital for economic growth. For the JPY, the S&P Global Manufacturing PMI is a key indicator. This index reflects the health of the manufacturing sector and overall economic conditions in Japan.


    Price Action:
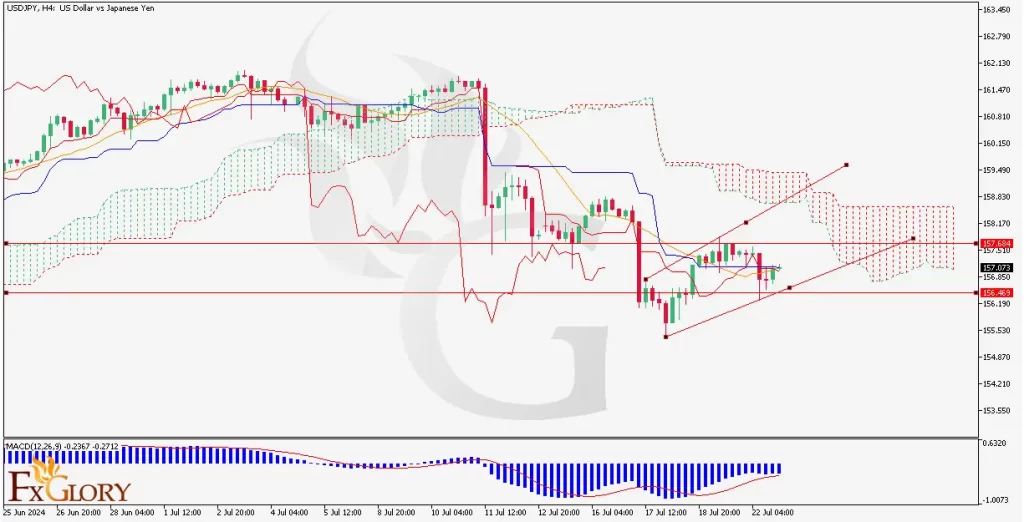
    The USD/JPY H4 chart, shows the pair’s bearish trend, with recent price movements forming lower highs and lower lows. The USD/JPY pair, also known as the Gopher has its price currently trending below the Ichimoku Cloud, indicating a bearish sentiment. The pair has recently found support near 156.46 and resistance around 157.68. The formation of a descending channel suggests further downside potential unless there is a strong reversal signal.


    Key Technical Indicators:
    Ichimoku Cloud:
    The price is below the Ichimoku Cloud on USDJPY H4 chart, indicating a bearish trend. The Tenkan-sen is below the Kijun-sen , reinforcing the bearish outlook for this pair. The Chikou Span is also below the price, further confirming the bearish sentiment for USD against JPY.
    MACD (Moving Average Convergence Divergence):
    The MACD line is below the signal line, and the histogram is negative, indicating bearish momentum. The recent contraction of the histogram suggests a potential weakening of the bearish momentum.


    Support and Resistance:
    Support Levels:
    The key support level is at 156.46, which has been tested multiple times and has held.
    Resistance Levels:
    The primary resistance level is at 157.68, with another significant level at 158.07.


    Conclusion and Consideration:
    The Gopher’s technical analysis on the H4 chart exhibits a strong bearish trend supported by the Ichimoku Cloud and MACD indicators. The USD/JPY price action suggests a continuation of the downward movement unless a significant reversal signal occurs. Traders should watch for any breakouts above the resistance level of 157.68 or below the support level of 156.46 for potential trade opportunities. It's essential to monitor upcoming economic data releases for the USD and JPY, as these can impact the pair's direction. As always, employing proper risk management strategies, including stop losses, is crucial in this volatile market.


    Disclaimer: The provided analysis is for informational purposes only and does not constitute investment advice. Traders should conduct their own research and analysis before making any trading decisions.


    FXGlory
    07.23.2024

  10. #80
    Senior Member FXGlory Ltd's Avatar
    Join Date
    Mar 2024
    Posts
    151

    Visit FXGlory Ltd's Youtube Channel

    Daily Forex Analysis By FXGlory

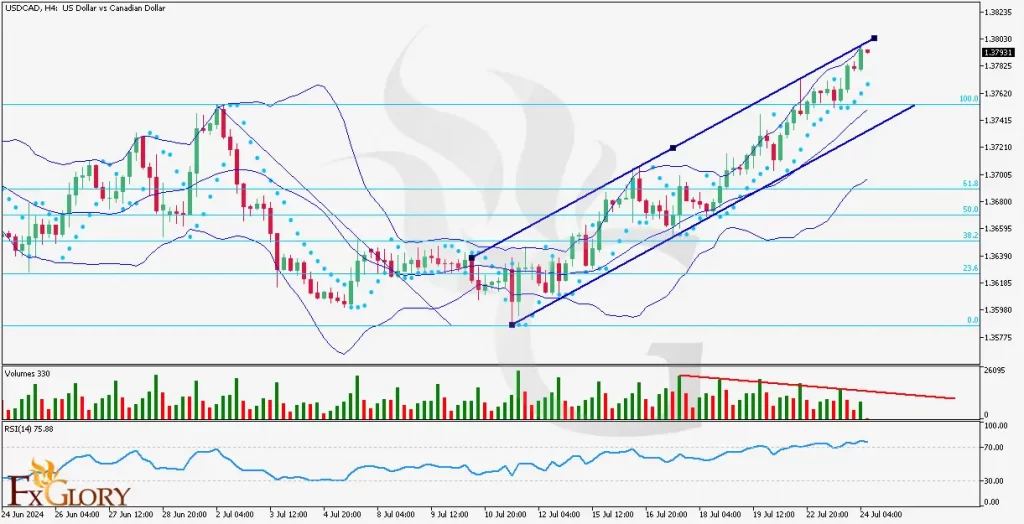
    USD/CAD H4 Technical and Fundamental Analysis for 24.07.2024


    Time Zone: GMT +3
    Time Frame: 4 Hours (H4)


    Fundamental Analysis:

    The USD/CAD news analysis today is driven by several economic indicators and significant announcements. For the Canadian dollar, the key factors affecting the value of CAD include the Bank of Canada (BoC) Monetary Policy Report, the BoC Rate Statement, and the Overnight Rate decision. These announcements will provide insights into Canada's economic outlook and monetary policy direction, directly affecting the CAD's strength. For the US dollar, critical economic data releases such as the Flash Manufacturing PMI, Flash Services PMI, and New Home Sales numbers are influential. The PMI figures are expected to show slight changes, with Manufacturing PMI forecasted at 51.6 and Services PMI at 55.3. New Home Sales are anticipated to increase from 619K to 639K, indicating growth in the housing sector. These data points will impact USD performance and the overall USD/CAD forecast today.


    Price Action:

    The USD/CAD H4 candlestick chart shows the price climbing within a bullish channel, currently facing resistance at the top of the channel. Despite the price increase, the trade volume on this pair is reducing, signaling a potential end to the bullish phase. The price is also at the top line of the Bollinger Bands, indicating overbought conditions.


    Key Technical Indicators:

    RSI (Relative Strength Index): The RSI on USDCAD chart is currently above 70, indicating overbought conditions. This suggests a potential for a price correction or a pause in the bullish momentum.

    Bollinger Bands: USDCAD price is touching the upper band, reinforcing the overbought scenario. Traders should watch for a possible price pullback to the middle or lower bands.


    Support and Resistance:

    Support Levels: The nearest support level on this pair is at 1.37610, followed by a more substantial support at 1.37300.

    Resistance Levels: The immediate resistance level for USDCAD price is at 1.37785, with a significant resistance at 1.37920, which aligns with the top of the bullish channel.


    Conclusion and Consideration:

    The USD/CAD technical analysis today indicates a strong bullish trend on the H4 chart, but with signs of overbought conditions as highlighted by the RSI and Bollinger Bands. The reducing trade volume further suggests a possible end to the bullish phase. Given the upcoming economic data releases and the BoC's announcements, traders should remain cautious. The BoC Monetary Policy Report and Rate Statement, along with USD economic indicators like the Flash PMIs and New Home Sales, will provide critical insights for trading strategies. Employ proper risk management and stay alert to news updates for informed trading decisions.


    Disclaimer: The provided analysis is for informational purposes only and does not constitute investment advice. Traders should conduct their own research and analysis before making any trading decisions.


    FXGlory
    24.07.2024

Page 8 of 15 FirstFirst ... 6 7 8 9 10 ... LastLast

Bookmarks

Posting Permissions

  • You may not post new threads
  • You may not post replies
  • You may not post attachments
  • You may not edit your posts
  •