Page 23 of 24 FirstFirst ... 13 21 22 23 24 LastLast
Results 221 to 230 of 231
Like Tree1Likes

Daily Forex Analysis By FXGlory

This is a discussion on Daily Forex Analysis By FXGlory within the Analytics and News forums, part of the Trading Forum category; GOLD (XAU/USD) H4 Technical and Fundamental Analysis for 04.10.2025 Time Zone: GMT +3 Time Frame: 4 Hours (H4) Fundamental Analysis: ...


  1. #221
    Senior Member FXGlory Ltd's Avatar
    Join Date
    Mar 2024
    Posts
    232

    Visit FXGlory Ltd's Youtube Channel
    GOLD (XAU/USD) H4 Technical and Fundamental Analysis for 04.10.2025


    Time Zone: GMT +3
    Time Frame: 4 Hours (H4)


    Fundamental Analysis:
    Gold prices are heavily influenced by economic data releases and central bank speeches, especially from the US. Today, traders are closely monitoring critical data from the US, including the Consumer Price Index (CPI) excluding food and energy, CPI overall, initial jobless claims, and several Federal Reserve members' speeches. A higher-than-expected CPI reading or hawkish comments from Fed officials could strengthen the USD and exert downward pressure on Gold, whereas weaker economic data and dovish comments might boost Gold as a safe-haven asset.
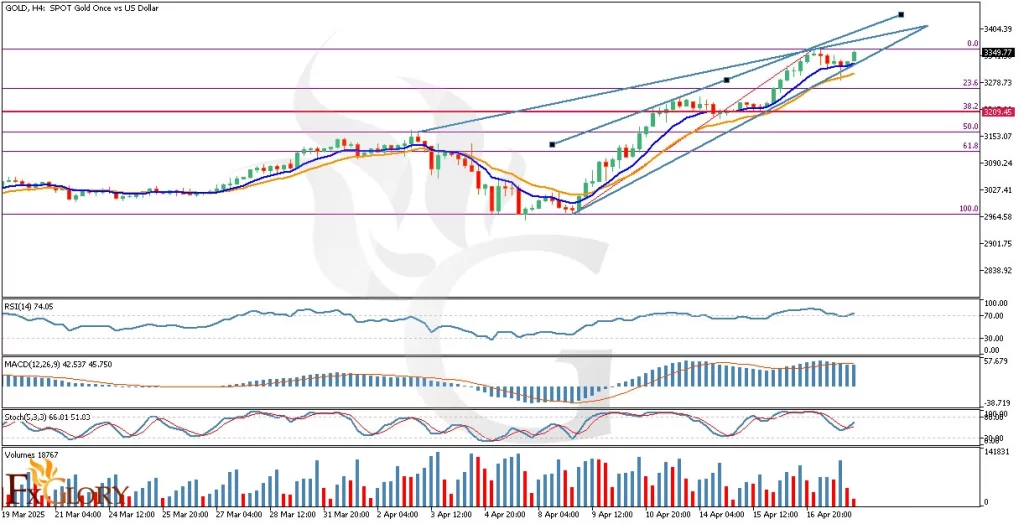

    Price Action:
    Currently, GOLD H4 analysis shows price breaking the previous support trend line, indicating a bearish shift. The recent bullish movement has retraced to the upper band of the Bollinger Bands, coinciding with the critical 23.6% Fibonacci retracement level. A red bearish pin bar confirms selling pressure, suggesting a potential move downward toward the 38.2% Fibonacci retracement level and possibly lower.


    Key Technical Indicators:
    Bollinger Bands:
    Gold price touched the upper band and is now showing signs of retracement. The narrowing of bands indicates decreasing volatility, suggesting an upcoming significant price move, likely bearish in the short term.
    Parabolic SAR: The dots are currently beneath the price candles, indicating recent bullish momentum. However, the proximity of price action suggests a possible imminent reversal to a bearish stance.
    RSI (Relative Strength Index): The RSI is at 57.21, above the neutral midpoint but not yet at overbought levels, suggesting that there is still room for upward movement, but caution is warranted as momentum may weaken.
    MACD (Moving Average Convergence Divergence): MACD remains below the zero line with decreasing bearish histograms. This indicates diminishing bearish momentum and hints at a potential short-term consolidation or reversal.
    %R (Williams Percent Range): Currently at -16.78, signaling that price is near overbought territory and may soon correct downward, aligning with bearish expectations.


    Support and Resistance Levels:
    Support:
    Immediate support at 3052.06 (38.2% Fibonacci), with deeper support seen at 3004.98 (50% Fibonacci).
    Resistance: Key resistance at 3095.14 (23.6% Fibonacci), and further strong resistance at the psychological 3122.68 level.


    Conclusion and Consideration:
    Technical indicators and recent price action analysis on GOLD H4 indicate a bearish pullback scenario in the short term. With price reacting strongly to the Fibonacci and Bollinger Band resistance, the possibility of further downside remains significant. Traders should remain vigilant for today's US economic data and Federal Reserve speakers, as these events could significantly influence volatility and the directional bias of Gold.


    Disclaimer: The analysis provided for XAU /USD is for informational purposes only and does not constitute investment advice. Traders are encouraged to perform their own analysis and research before making any trading decisions on XAUUSD. Market conditions can change quickly, so staying informed with the latest data is essential.


    FXGlory
    04.10.2025

  2. #222
    Senior Member FXGlory Ltd's Avatar
    Join Date
    Mar 2024
    Posts
    232

    Visit FXGlory Ltd's Youtube Channel
    EURUSD Daily Technical and Fundamental Analysis for 04.11.2025


    Time Zone: GMT +3
    Time Frame: 4 Hours (H4)


    Fundamental Analysis:
    EUR/USD is expected to experience increased volatility today, influenced by significant economic events. Key speeches from Federal Reserve members, including New York Fed President John Williams and St. Louis Fed President Alberto Musalem, could indicate future monetary policy stances, directly impacting the USD. Furthermore, market participants will closely watch the University of Michigan's inflation expectations, consumer sentiment reports, and the US Producer Price Index (PPI). Meanwhile, Eurozone traders will evaluate Germany’s CPI data and anticipate updates from the Eurogroup meetings. These factors will likely play significant roles in shaping EUR/USD price movements today.


    Price Action:
    The EUR USD H4 price action clearly indicates a bullish breakout. The pair recently broke through the critical daily resistance line and retested it, confirming it as new support. Subsequently, EUR-USD breached the next resistance zone with three solid bullish candles, now serving as immediate support. However, the emergence of a doji and subsequent red candle suggests potential short-term bearish corrections, with the primary target likely the recently established support zone around 1.1110.


    Key Technical Indicators:
    Bollinger Bands:
    EUR/USD is trading above the upper Bollinger Band, signifying overextension and potential correction or consolidation in the near term. Traders should remain cautious about possible reversals or sideways movement.
    Parabolic SAR: The Parabolic SAR dots remain below the current price, indicating ongoing bullish momentum in the EURUSD pair. However, traders should watch for potential reversal signs if SAR dots shift above the price.
    RSI (Relative Strength Index): RSI currently stands at 66.98, approaching the overbought level (70). While this supports bullish momentum, the nearing overbought conditions suggest potential for a corrective move soon.
    MACD (Moving Average Convergence Divergence): MACD demonstrates increasing bullish momentum, with the histogram bars expanding above the zero line. This indicates strong buyer presence, yet traders must remain cautious for any bearish divergence forming.
    Awesome Oscillator: The Awesome Oscillator indicates bullish strength, as evidenced by growing green bars above the zero line. This supports the bullish scenario but, like other indicators, advises caution for any impending correction.


    Support and Resistance:
    Support:
    Immediate support is located at the recently broken resistance turned support zone around 1.1110, followed by the significant daily level at 1.1094.
    Resistance: Current resistance stands at recent highs near 1.1200, with the psychological level of 1.1250 as the next major barrier.


    Conclusion and Consideration:
    The EURUSD pair remains bullish on the H4 chart, supported by multiple technical indicators including Bollinger Bands, MACD, RSI, Parabolic SAR, and the Awesome Oscillator. However, given the current overextended conditions and fundamental factors, traders should prepare for potential corrections toward the immediate support zone at 1.1110. Significant economic announcements and Fed member speeches scheduled for today could lead to heightened volatility, thereby warranting careful risk management.


    Disclaimer: The analysis provided for EUR/USD is for informational purposes only and does not constitute investment advice. Traders are encouraged to perform their own analysis and research before making any trading decisions on EURUSD. Market conditions can change quickly, so staying informed with the latest data is essential.


    FXGlory
    04.11.2025

  3. #223
    Senior Member FXGlory Ltd's Avatar
    Join Date
    Mar 2024
    Posts
    232

    Visit FXGlory Ltd's Youtube Channel
    SILVER (XAG/USD) Technical and Fundamental Analysis for 04.14.2025


    Time Zone: GMT +3
    Time Frame: 4 Hours (H4)


    Fundamental Analysis:
    Silver (XAG/USD) today may experience volatility due to scheduled remarks from Federal Reserve Bank of Richmond President Thomas Barkin and Federal Reserve Governor Christopher Waller. Both are expected to speak about the economic outlook and monetary policy, potentially impacting USD strength. Hawkish comments could boost the dollar, putting downward pressure on Silver prices. Traders should closely monitor these speeches as they may contain subtle clues on future monetary policy actions, significantly influencing Silver's short-term price direction.


    Price Action:
    XAG/USD H4 analysis indicates a strong bullish momentum after a robust reaction at the support line around 28.759. Following this reaction, an impressive engulfing candle initiated a steady upward trend, effortlessly breaching the first resistance level at 30.928. Currently, Silver prices are approaching Resistance Line 2 at 32.272, demonstrating a clear intent to break above it, supported by multiple consecutive green candles. However, traders should watch for a possible correction around Resistance 2, with the Ichimoku cloud potentially serving as a target for retracement.


    Key Technical Indicators:
    Ichimoku: Silver prices on the H4 timeframe have successfully broken through the Ichimoku cloud, signaling strong bullish sentiment. The cloud's bullish crossover (Kumo Twist) further supports the potential continuation of upward movement. However, the cloud also suggests potential retracement targets, indicating caution around the upcoming resistance.
    RSI (Relative Strength Index): The RSI currently stands at 69.41, approaching the overbought threshold of 70. This indicates strong bullish momentum but also warns of possible short-term corrective moves due to potential profit-taking at elevated levels. Traders should remain vigilant for signs of RSI reversal.
    StdDev (Standard Deviation): The Standard Deviation indicator is at 0.7037, signaling relatively moderate volatility. The current moderate increase in StdDev suggests traders should prepare for potential volatility spikes as prices approach critical resistance levels, potentially prompting significant price actions.


    Support and Resistance:
    Support:
    Immediate support is identified at 30.928 (previous resistance turned support), followed by stronger support at 28.759.
    Resistance: Immediate resistance at 32.272 (Resistance 2), with a potential further target at 33.182 if a breakout occurs.


    Conclusion and Consideration:
    The SilverH4 chart analysis demonstrates significant bullish strength, reinforced by favorable technical indicators such as Ichimoku, RSI, and StdDev. Despite the bullish bias, traders should cautiously monitor price actions near Resistance Line 2 (32.272), as a correction towards the Ichimoku cloud may unfold. Upcoming Fed speeches today could also influence Silver price movements, emphasizing careful risk management strategies.


    Disclaimer: The analysis provided for XAG/USD is for informational purposes only and does not constitute investment advice. Traders are encouraged to perform their own analysis and research before making any trading decisions on XAGUSD. Market conditions can change quickly, so staying informed with the latest data is essential.


    FXGlory
    04.14.2025

  4. #224
    Senior Member FXGlory Ltd's Avatar
    Join Date
    Mar 2024
    Posts
    232

    Visit FXGlory Ltd's Youtube Channel
    USDCAD Daily Technical and Fundamental Analysis for 04.15.2025


    Time Zone: GMT +3
    Time Frame: 4 Hours (H4)


    Fundamental Analysis:
    The USD/CAD currency pair is poised for volatility as significant economic data is anticipated from Canada. Upcoming key releases include housing starts from CMHC, consumer price index (CPI) metrics, and manufacturing sales data from Statistics Canada. These indicators will offer insights into Canada's economic health and inflation trends, influencing the Bank of Canada's future interest rate decisions. Additionally, today, remarks from Federal Reserve members Patrick Harker and Raphael Bostic, along with the New York Manufacturing Index and Import Price Index releases, could introduce volatility into the USD and indirectly affect USD-CAD movements.


    Price Action:
    Analyzing USDCAD H4 price action, after breaking the previous ascending trend line, the pair has begun a clear downtrend. The price reacted notably at the 61.8% Fibonacci retracement level, suggesting strong buying interest. Currently, price action indicates a possible retracement towards the next resistance, which aligns with the 50% Fibonacci level and EMA 21. A noticeable divergence is observed between price action and RSI, signaling potential bullish retracement.


    Key Technical Indicators:
    EMA 21:
    The price remains below the 21-period Exponential Moving Average (EMA), affirming a bearish sentiment. The EMA currently serves as dynamic resistance, and a retest at this EMA could determine the sustainability of the downtrend.
    RSI: The Relative Strength Index (RSI) registers at 36.03, showing bearish sentiment but nearing oversold territory. Notably, divergence between price and RSI signals a potential bullish correction, suggesting traders should watch for reversal signals carefully.
    MACD: The Moving Average Convergence Divergence (MACD) histogram indicates bearish momentum is slowing, as bars are reducing in size. This reduction suggests sellers' weakening control, highlighting the possibility of an upcoming bullish correction.
    Stochastic: The Stochastic oscillator recently turned upwards from oversold territory, signaling short-term bullish momentum. This complements RSI's divergence, hinting at possible short-term upside movement.


    Support and Resistance:
    Support: Immediate support: 1.38135 (61.8% Fibonacci retracement) and secondary support are recent lows around 1.3770.
    Resistance: Immediate resistance: 1.39645 (50% Fibonacci retracement, EMA 21) and secondary resistance could be 1.41155 (38.2% Fibonacci retracement).


    Conclusion and Consideration:
    In conclusion, the technical analysis for the USD/CAD H4 timeframe indicates a bearish trend continuation with potential for short-term bullish correction based on the EMA 21, RSI divergence, MACD weakening bearish momentum, and bullish Stochastic signals. Traders should consider upcoming economic releases from Canada and remarks from Federal Reserve members, which could significantly influence volatility. Proper risk management and close monitoring of these key indicators and news events are advised.


    Disclaimer: The analysis provided for USD/CAD is for informational purposes only and does not constitute investment advice. Traders are encouraged to perform their own analysis and research before making any trading decisions on USDCAD. Market conditions can change quickly, so staying informed with the latest data is essential.


    FXGlory
    04.15.2025

  5. #225
    Senior Member FXGlory Ltd's Avatar
    Join Date
    Mar 2024
    Posts
    232

    Visit FXGlory Ltd's Youtube Channel
    GBPUSD H4 Technical and Fundamental Analysis for 04.16.2025


    Time Zone: GMT +3
    Time Frame: 4 Hours (H4)


    Fundamental Analysis:
    Today is a pivotal day for the GBPUSD pair, as both the British Pound (GBP) and the US Dollar (USD) face key economic data releases. For the UK, inflation-related indicators including CPI y/y (2.7% vs 2.8% forecast), Core CPI y/y (3.4% vs 3.5%), RPI y/y (3.2% vs 3.4%), and HPI y/y (5.1% vs 4.9%) were released in the early hours. The slightly lower-than-expected CPI figures may reduce pressure on the Bank of England to hike rates, potentially weighing on the GBP. Later in the US session, the USD will be influenced by critical releases such as Retail Sales m/m, Core Retail Sales, and Fed Chair Powell’s speech, along with industrial production data and oil inventories. Strong US data may bolster the USD, while dovish or weaker results could sustain bullish momentum for GBPUSD.


    Price Action:
    The GBPUSD H4 chart shows a strong and steady bullish trend over the past few sessions. The pair has been posting consecutive higher highs and higher lows, confirming bullish momentum. Price action is consistently hugging the upper Bollinger Band, indicating strong buying pressure. The candles have shown minimal retracements, with smaller-bodied red candles suggesting shallow corrections within the ongoing uptrend.


    Key Technical Indicators:
    Bollinger Bands: The GBPUSD price is trending close to the upper Bollinger Band, indicating a continuation of bullish momentum. The bands are widening, suggesting increasing volatility and the potential for further upside. The price staying above the midline signals persistent buying interest.
    MACD (12,26,9): The MACD histogram bars are increasing positively, and the MACD line remains above the signal line, reinforcing the bullish bias. There is no sign of divergence, and the indicator confirms strong momentum behind the GBPUSD uptrend on the H4 chart.
    RSI (14): The RSI stands at 73.14, moving into overbought territory. This suggests that while the bullish trend is strong, the pair might be susceptible to a short-term pullback or consolidation. Traders should be cautious of potential profit-taking at this level.


    Support and Resistance:
    Support: Immediate and next support levels are found at 1.3180, aligned with the Bollinger Bands’ midline and recent consolidation, and 1.3100, a prior structure high near the lower Bollinger Band.
    Resistance: Immediate resistance: 1.39645 (50% Fibonacci retracement, EMA 21) and secondary resistance could be 1.41155 (38.2% Fibonacci retracement).


    Conclusion and Consideration:
    The GBPUSD H4 technical and fundamental analysis indicates that the pair is in a strong bullish phase, backed by robust price action, bullish momentum indicators, and widening Bollinger Bands. However, the RSI entering overbought territory and the high-impact news scheduled for both GBP and USD today suggest caution. Traders should monitor the upcoming US retail sales and Powell’s speech for potential volatility. A break above 1.3260 may open doors to further upside, while a rejection could initiate a pullback towards 1.3180.


    Disclaimer: The analysis provided for GBP/USD is for informational purposes only and does not constitute investment advice. Traders are encouraged to perform their own analysis and research before making any trading decisions on GBPUSD. Market conditions can change quickly, so staying informed with the latest data is essential.


    FXGlory
    04.16.2025

  6. #226
    Senior Member FXGlory Ltd's Avatar
    Join Date
    Mar 2024
    Posts
    232

    Visit FXGlory Ltd's Youtube Channel
    AUDUSD Daily Technical and Fundamental Analysis for 04.17.2025


    Time Zone: GMT +3
    Time Frame: 4 Hours (H4)


    Fundamental Analysis:
    Today, the AUD/USD pair faces significant volatility from critical economic news releases from Australia and the US. From Australia, employment data, including Employment Change and Unemployment Rate, will be in focus. Better-than-expected employment figures and a lower unemployment rate could strengthen the Australian Dollar, reflecting positive economic health and potentially increased consumer spending. Additionally, the NAB Business Confidence survey provides insights into the sentiment among Australian businesses, serving as a leading indicator for economic activity. On the US side, investors will closely watch the Treasury International Capital (TIC) data, Initial Jobless Claims, Philadelphia Fed Manufacturing Index, Residential Building Permits, Housing Starts, and Natural Gas Storage reports. Furthermore, speeches from Federal Reserve officials Michael Barr and Jeffrey Schmid will be scrutinized for signals on future monetary policy direction. Positive US data or hawkish Fed commentary could bolster the US Dollar, impacting AUDUSD price dynamics significantly.


    Price Action:
    The AUD-USD H4 chart has exhibited bullish momentum after shaping a clear double-bottom pattern, indicating a significant trend reversal. The price has recently breached the lower boundary of its ascending channel and is currently attempting a pullback towards the previously broken support level at 0.62286. At present, price action remains within a key resistance zone. If bullish momentum persists and the resistance is convincingly broken, the next potential target would be the upper boundary of the ascending channel. Conversely, failure to break this resistance could push the pair down to retest the EMA21 line or further down to the key level at 0.62286.


    Key Technical Indicators:
    EMA 21: The EMA 21 line is currently below the price, providing dynamic support and confirming the ongoing bullish momentum. Traders should watch for interactions with this line as a potential turning point.
    Parabolic SAR: The Parabolic SAR dots remain below the price candles, indicating bullish sentiment remains intact for now. Traders should look for any flips of SAR dots to signal possible short-term reversals.
    RSI: The RSI currently stands at 64.18, indicating moderately bullish momentum without being overbought. This suggests the pair may still have room for further upward movement before encountering significant selling pressure.
    MACD: The MACD histogram is positive but declining, hinting at diminishing bullish momentum. Traders should watch closely for a potential bearish crossover, which could signal the onset of a corrective move or bearish reversal.


    Support and Resistance Levels:
    Support: Immediate dynamic support is at the EMA 21 line, followed by a key support level at 0.62286.
    Resistance: Current resistance lies within the range of 0.6370 to 0.6380, coinciding with recent price action highs. Further resistance could be encountered at the upper channel boundary around 0.6400-0.6410.


    Conclusion and Consideration:
    The AUD USD pair remains bullish on the H4 timeframe, supported by price action and technical indicators. Traders should closely monitor today's significant USD news events, which are likely to increase volatility and could influence directional moves. If resistance at the 0.6370-0.6380 zone breaks, traders can expect further bullish continuation towards the channel's upper boundary. However, caution is advised due to the weakening MACD momentum and potential fundamental disruptions.


    Disclaimer: The analysis provided for AUD/USD is for informational purposes only and does not constitute investment advice. Traders are encouraged to perform their own analysis and research before making any trading decisions on AUDUSD. Market conditions can change quickly, so staying informed with the latest data is essential.


    FXGlory
    04.17.2025

  7. #227
    Senior Member FXGlory Ltd's Avatar
    Join Date
    Mar 2024
    Posts
    232

    Visit FXGlory Ltd's Youtube Channel
    USDJPY Daily Technical and Fundamental Analysis for 04.18.2025


    Time Zone: GMT +3
    Time Frame: 4 Hours (H4)


    Fundamental Analysis:
    Today’s USDJPY fundamental analysis centres on two potential catalysts. In Tokyo, traders await Japan’s Core CPI, the inflation yardstick that omits fresh‑food prices; a hotter‑than‑forecast print usually lifts the yen as bets on tighter Bank of Japan policy return. Stateside, attention turns to FOMC member Mary Daly’s remarks at UC Berkeley. Any hint of a more hawkish stance could bolster the dollar. The push‑and‑pull between an inflation‑sensitive JPY and a policy‑driven USD sets the stage for elevated volatility on the USD-JPY H4 chart in today’s session.


    Price Action
    From a USD JPY price‑action perspective, the pair has respected a well‑defined descending channel since late March, carving out successive lower highs and lower lows. Price is grinding along the channel’s mid‑line after slipping beneath the 61.8 % Fibonacci retracement at 143.75 and tagging a fresh swing low near 141.90. Candles remain predominantly bearish, with short‑lived upticks capped by the channel’s upper boundary—evidence that sellers still dominate intraday order flow.


    Key Technical Indicators
    Moving Averages:
    The 9‑period EMA (blue) stays beneath the 17‑period EMA (orange), reinforcing the prevailing bearish trend; every attempt to reclaim the faster average has stalled, turning these MAs into dynamic resistance.
    RSI (14): Hovering around 40, the RSI reflects lingering downside momentum without dipping into oversold terrain, implying room for another leg lower before bullish exhaustion signals emerge.
    Stochastic (5,3,3): The oscillator has rolled over from the 70‑zone and is crossing south of its signal line near 45, hinting that the latest corrective bounce is losing steam.


    Support and Resistance
    Support:
    Support sits around the confluence of the channel base and the 100 % Fibonacci level at 140.85‑141.00.
    Resistance: Resistance is found at 143.75—the 61.8 % retracement—followed by 145.65 at the 50 % level and the channel’s upper trend‑line.


    Conclusion and Consideration
    Current USD/JPY H4 technical analysis underscores a dominant down‑trend, validated by converging indicators and persistent supply at moving‑average resistance. Unless Core CPI disappoints or Daly strikes an unexpectedly dovish tone, rallies toward 143.75 may tempt sellers targeting 141.00 and potentially 140.00. Intraday traders should track channel boundaries closely, while swing participants may wait for a confirmed break of either 143.75 or 140.85 before committing fresh positions in this USDJPY trading strategy.


    Disclaimer: The analysis provided for USD/JPY is for informational purposes only and does not constitute investment advice. Traders are encouraged to perform their own analysis and research before making any trading decisions on USDJPY. Market conditions can change quickly, so staying informed with the latest data is essential.


    FXGlory
    04.18.2025

  8. #228
    Senior Member FXGlory Ltd's Avatar
    Join Date
    Mar 2024
    Posts
    232

    Visit FXGlory Ltd's Youtube Channel
    GOLDUSD H4 Technical and Fundamental Analysis for 04.21.2025


    Time Zone: GMT +3
    Time Frame: 4 Hours (H4)


    Fundamental Analysis:
    XAUUSD (Gold vs. US Dollar) traders are closely monitoring today's key economic events impacting the USD. The upcoming speech by Federal Reserve Bank of Chicago President Austan Goolsbee may provide crucial insights into future monetary policy. Hawkish statements may strengthen the USD, potentially putting pressure on Gold prices. Additionally, the release of the Conference Board's Leading Indicators Index will give investors further clarity on the US economy’s trajectory, possibly affecting USD strength and subsequently influencing Gold market sentiment. Moreover, IMF meetings discussing global economic stability, monetary policy, and geopolitical risks could significantly impact market volatility for XAU/USD.


    Price Action:
    XAU-USD on the H4 chart demonstrates a clear bullish trend, steadily approaching its previous all-time high (ATH). The price action shows consistent upward movement with minor corrective pullbacks, confirming the resilience of the bullish momentum. Currently, the price is nearing the Fibonacci 0 level, indicating strong bullish sentiment. The short-term Moving Average (MA 9, blue) has crossed above the longer-term Moving Average (MA 17, orange), signaling bullish continuation potential.


    Key Technical Indicators
    Moving Averages (MA):
    On the H4 timeframe, the short-term MA (9-period, blue) has decisively crossed above the long-term MA (17-period, orange), confirming bullish momentum. This bullish crossover is typically viewed as a strong positive signal by traders, indicating the potential for further upward price movements.
    RSI (Relative Strength Index): The RSI currently stands at 74.05, signaling strong bullish momentum and slightly overbought conditions. This implies that although bullish sentiment dominates, traders should remain cautious of potential corrective pullbacks due to overbought conditions.
    MACD (Moving Average Convergence Divergence): The MACD indicator remains positive, with the MACD line clearly above the signal line, highlighting strong upward momentum. The histogram also supports ongoing bullish strength but traders should monitor for decreasing momentum as the price approaches resistance levels.
    Stochastic Oscillator: The stochastic oscillator is positioned at 66.01, exhibiting upward momentum without being excessively overbought. This suggests room for further bullish advancement but advises caution as the indicator approaches higher threshold values.
    Volume: Trading volumes have been stable, supporting the recent bullish price movements. Consistent volumes confirm sustained market interest, adding reliability to the ongoing bullish trend for XAUUSD.


    Support and Resistance
    Support: Immediate support lies around the 3278.73 level (Fibonacci 23.6%), aligning with recent consolidation zones.
    Resistance: Critical resistance is the current ATH around the 3340.39 mark, where significant selling pressure may appear.


    Conclusion and Consideration
    The XAUUSD/GOLDUSD H4 analysis suggests bullish market conditions remain intact, reinforced by bullish MA crossover, strong RSI, MACD positivity, and supportive volumes. However, traders should closely watch key economic events today, including the Fed speech, Leading Indicators release, and IMF meetings, which could create considerable market volatility. Due to RSI's overbought conditions, traders are recommended to consider prudent risk management strategies for potential short-term pullbacks around the resistance levels.


    Disclaimer: The analysis provided for XAU/USD is for informational purposes only and does not constitute investment advice. Traders are encouraged to perform their own analysis and research before making any trading decisions on XAUUSD. Market conditions can change quickly, so staying informed with the latest data is essential.


    FXGlory
    04.21.2025

  9. #229
    Senior Member FXGlory Ltd's Avatar
    Join Date
    Mar 2024
    Posts
    232

    Visit FXGlory Ltd's Youtube Channel
    EURUSD H4 Technical and Fundamental Analysis for 04.22.2025


    Time Zone: GMT +3
    Time Frame: 4 Hours (H4)


    Fundamental Analysis:
    Today, significant volatility could impact EUR vs. USD due to crucial speeches from ECB President Christine Lagarde and multiple Federal Reserve officials. Christine Lagarde’s speech, closely followed by traders, may provide insights into future ECB monetary policy, influencing the Euro significantly. Simultaneously, speeches from Federal Reserve officials including Governor Philip Jefferson and presidents Patrick Harker and Neel Kashkari will offer insights into the Fed’s monetary policy stance and economic mobility objectives, influencing the USD’s strength and market expectations. Traders should closely monitor these events for potential market shifts.


    Price Action:
    EUR/USD price action on the H4 timeframe demonstrates a consolidation pattern between two key trend lines. After encountering strong resistance at the Fibonacci Expansion (FE) 61.8% level, the pair has retraced downwards. The support trend line below is likely to attract buyers, potentially ending the correction phase and prompting the pair to retest the resistance at the FE 61.8% level. Successful bullish momentum above this resistance could propel EUR/USD toward the FE 100% expansion target, marking significant upside potential.


    Key Technical Indicators:
    MACD:
    The MACD indicator currently shows declining bullish momentum with the histogram bars decreasing in height, suggesting the ongoing bullish trend is losing strength. Traders should monitor closely for a potential bearish crossover that might indicate a temporary shift towards bearish sentiment.
    RSI: The Relative Strength Index (RSI) is at 67.29, approaching overbought territory but still providing room for further upward movement. This indicates underlying bullish momentum, yet caution is recommended due to the proximity to overbought conditions, potentially signaling a short-term price correction.
    Williams %R: The Williams %R indicator stands at -26.18, highlighting moderate bullish sentiment. However, it is gradually declining, indicating a decrease in bullish strength and the possibility of price consolidation or correction before the next bullish advance.


    Support and Resistance:
    Support:
    Immediate support is located near the ascending trend line at approximately 1.1500, providing a critical area for buyers to re-enter the market.
    Resistance: The immediate resistance is set at the FE 61.8% Fibonacci Expansion level around 1.1568, acting as a formidable barrier for bulls. A break above this level targets the FE 100% expansion at approximately 1.1750.


    Conclusion and Consideration:
    EUR-USD technical analysis for the H4 timeframe reveals a bullish bias with current consolidation near key Fibonacci resistance levels. While the MACD indicates weakening bullish momentum and RSI nearing overbought conditions, the broader bullish trend remains intact, supported by price action analysis. Traders should exercise caution due to high-impact news events from the ECB and Federal Reserve officials, potentially leading to increased volatility. Monitoring closely for clear breakout signals above resistance or bounce confirmations at support is recommended for optimal trading strategies.


    Disclaimer: The analysis provided for EUR/USD is for informational purposes only and does not constitute investment advice. Traders are encouraged to perform their own analysis and research before making any trading decisions on EURUSD. Market conditions can change quickly, so staying informed with the latest data is essential.


    FXGlory
    04.22.2025

  10. #230
    Senior Member FXGlory Ltd's Avatar
    Join Date
    Mar 2024
    Posts
    232

    Visit FXGlory Ltd's Youtube Channel
    GBPUSD Daily Technical and Fundamental Analysis for 04.23.2025


    Time Zone: GMT +2
    Time Frame: 4 Hours (H4)


    Fundamental Analysis:
    The GBP/USD currency pair reflects the exchange rate between the British Pound (GBP) and the US Dollar (USD). Today’s UK Flash Manufacturing PMI fell to 44.0 (from 44.9), reinforcing concerns over a contraction in UK industrial output, while the Flash Services PMI dipped to 51.5 (from 52.5), suggesting softer service sector growth. Meanwhile, US Flash Manufacturing and Services PMIs also disappointed at 49.0 and 52.8 respectively, below forecasts, which may dampen USD demand ahead of Fed speakers Goolsbee and Waller this afternoon. Later UK events, including BOE Governor Bailey’s remarks at 21:00 and MPC Member Breeden at 11:30, could reignite pound volatility if hawkish or dovish cues emerge. Overall, mixed PMI signals and high profile central bank commentary are set to drive market volatility and directional bias in this GBPUSD H4 forex analysis.


    Price Action:
    On the GBPUSD H4 chart, price action shows a decisive bullish breakout above a key resistance zone around 1.2700, confirming a shift in market sentiment. The price line is currently holding above the 100 period moving average (MA100), indicating medium term bullish momentum on the daily chart. The last three candlesticks suggest a potential pullback toward the broken resistance—now acting as support—and the MA100 before the next leg higher. This behavior underscores classic retest dynamics, often seen in professional technical analysis of forex pairs.


    Key Technical Indicators:
    100 Period Moving Average (MA100):The price line has recently broken above a strong resistance band and is now positioned comfortably above the MA100 on the H4 chart. This crossover signals a bullish trend in the medium term, suggesting buyers are firmly in control. Traders often view a sustained close above the MA100 as confirmation of upward momentum in GBPUSD H4 technical analysis.
    MACD (Moving Average Convergence Divergence):The MACD line sits above its signal line, and the histogram bars are expanding, reflecting growing bullish power. This bullish MACD configuration aligns with the breakout, reinforcing the momentum case for GBPUSD. Watch for any narrowing of the histogram, which could herald a short term consolidation or retest before continuation.


    Support and Resistance:
    Support: Immediate support levels are identified at 1.32300 and 1.32000. These areas could serve as potential entry points on a pullback.
    Resistance: Resistance levels are located at 1.33000 and 1.34000. A sustained break above these levels would confirm further bullish momentum.


    Conclusion and Consideration:
    The GBPUSD H4 technical analysis reveals sustained bullish momentum, confirmed by the MA100 breakout, bullish MACD, and supportive RSI levels. A healthy retest of the 1.2700 support—aligned with the MA100—could offer an optimal entry for buyers looking to capitalize on the next bullish wave. However, traders should exercise caution around the upcoming fundamental catalysts: US Fed speakers Goolsbee and Waller, UK BOE Governor Bailey, and PMI data that have already underperformed. Volatility spikes are likely, making strict risk management essential in this daily chart analysis for GBPUSD H4.


    Disclaimer: The analysis provided here is for informational purposes only and should not be considered financial advice. Market conditions can change rapidly, and traders should perform their own research and analysis before making trading decisions. Past performance is not indicative of future results. Always trade responsibly.


    FXGlory
    04.23.2025

Page 23 of 24 FirstFirst ... 13 21 22 23 24 LastLast

Bookmarks

Posting Permissions

  • You may not post new threads
  • You may not post replies
  • You may not post attachments
  • You may not edit your posts
  •