Page 2 of 5 FirstFirst 1 2 3 4 ... LastLast
Results 11 to 20 of 49

Pivot Points Forex Strategies

This is a discussion on Pivot Points Forex Strategies within the Trading Systems forums, part of the Trading Forum category; Talking Points: Price action is an extremely common tool for day-traders’ (scalpers) risk management approaches. Moving averages and psychological support ...


  1. #11
    member ForeCastle's Avatar
    Join Date
    Apr 2013
    Posts
    1,077
    Blog Entries
    236

    The Three Most Popular Indicators for Day-Trading

    Talking Points:

    • Price action is an extremely common tool for day-traders’ (scalpers) risk management approaches.
    • Moving averages and psychological support and resistance can assist with entry and trade management.


    Price Action

    The first indicator is more than an indicator, and closer to a ‘field-of-study’ within technical analysis. Because trading on short-term time frames exposes traders to the complexity of ‘lag’ within a market, price action is one of the more popular ways of performing technical analysis with a short-term approach.

    The reason this is so popular is because price action removes technical indicators from the equation and instead focuses on price and price alone. Price action can be used to grade trends, identify support and resistance levels, and to show traders potential entry opportunities in markets.

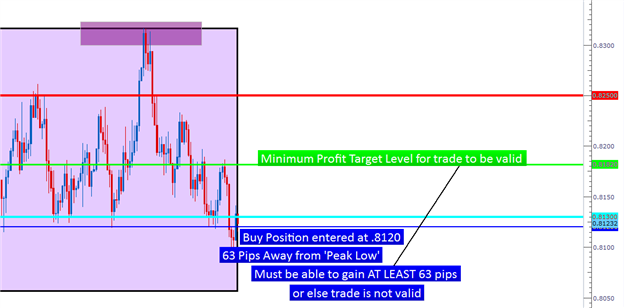
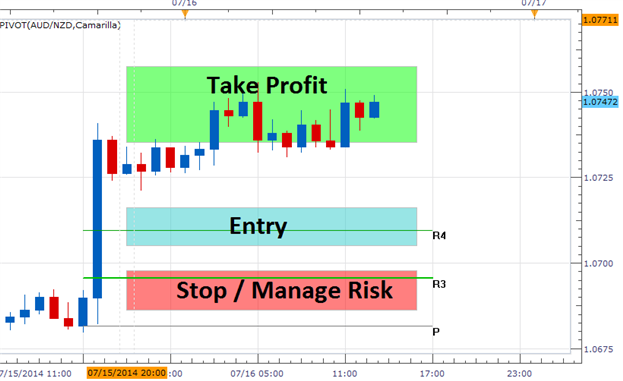
    Where price action can come in as especially valuable for a short-term trader is in the realm of trade and risk and trade management. By noting price levels with which reversals or changes in market direction have taken place in the past, traders can look to place stops on positions so that if the market breaks against them (if a new low is put in while in a long position, or a new high while in a short position), the trade can be closed in an effort to mitigate the loss.

    Price action can be a valuable tool for risk and trade management


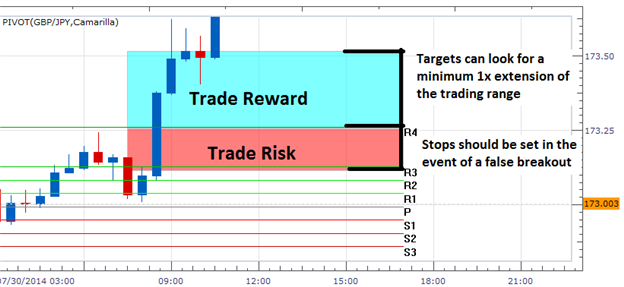
    If the market does trend in the direction that you’re looking for, price action can also help with adjusting stops and profit-taking.

    Short-term traders will often look to execute a quick break-even stop to remove their initial risk from the trade. And after prices do continue to move, traders can look at moving the stop even deeper in-the-money as the trade works in the trader’s favor.

    Moving Averages


    Another indicator that’s simple to use and attempts to marginalize the lag that is ever-present with the usage of indicators, the moving average is a common chart component of short-term traders.

    Moving averages are commonly used for trend diagnoses, so that if prices are above the moving average the trend is diagnosed as being ‘up,’ and if prices are below the trend is considered being ‘down.’ This can work phenomenally with a multiple time frame approach in which trends are being graded on a longer-term chart (like the hourly or 4-hour), and entries performed on the shorter-term chart.

    Traders can also use moving averages to trigger into new positions. The moving average crossover is one of the more common ways of doing so and with this method; traders are simply looking for price to cross the moving average to initiate the position.

    This strategy uses Moving Averages for trend filter and entry trigger, and price action for risk management


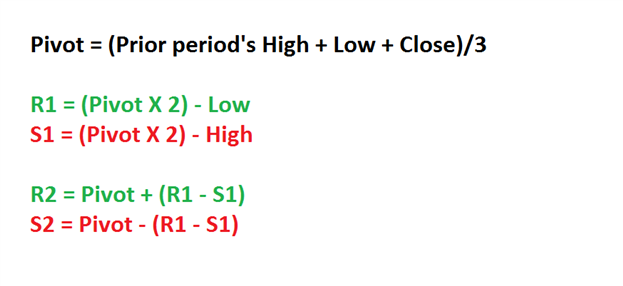
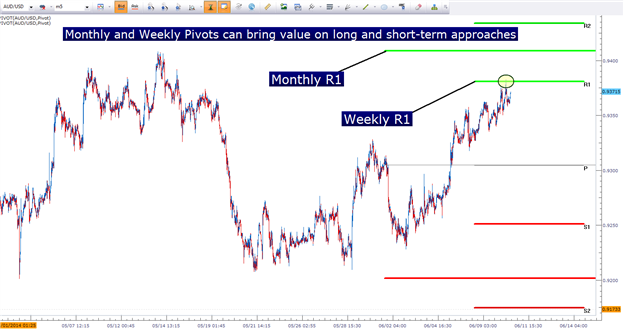
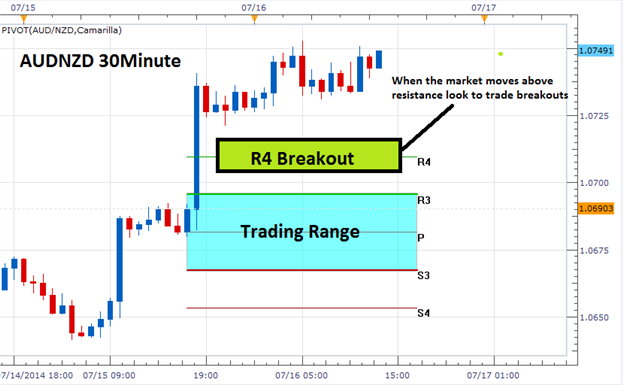
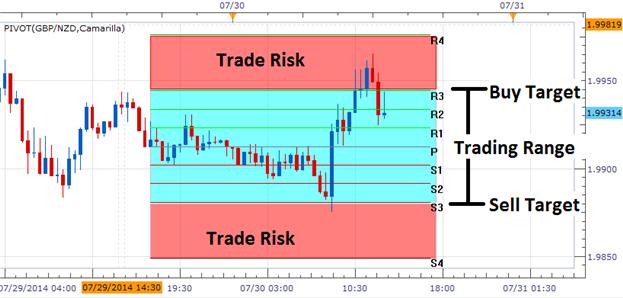
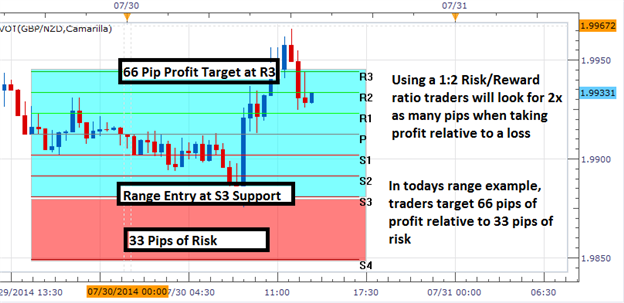
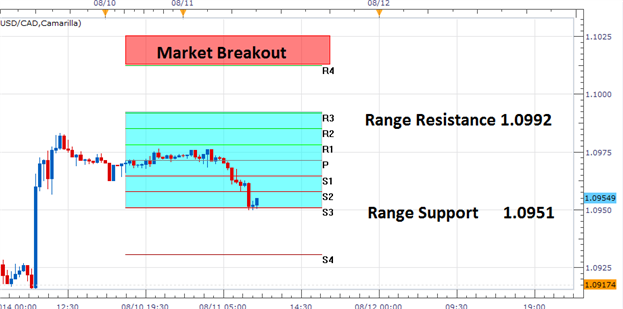
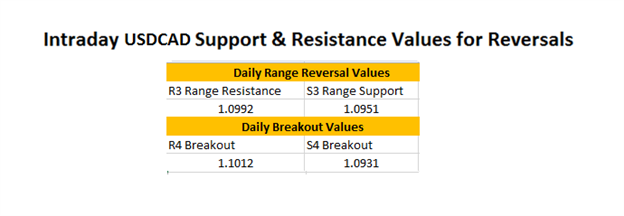
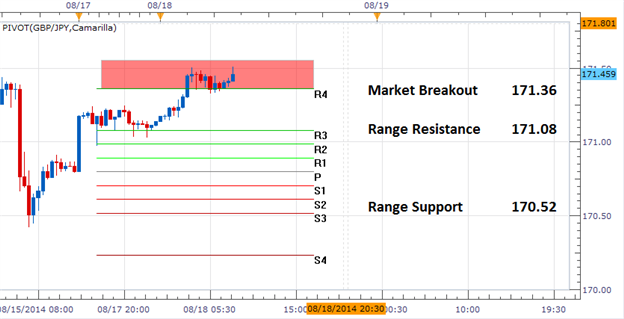
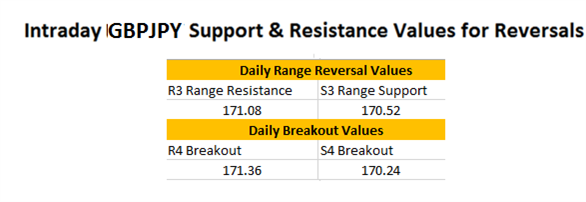
    Support and Resistance via Psychological Whole Numbers, and Pivot Points

    Have you ever been in a trade that’s working out great, only to see that up-trend stop dead-in-its-tracks? And after price struggles to continue moving up, it begins to oscillate before reversing and moving down.

    This is the story of support and resistance, and to short-term traders this can take on extreme importance because failure to see ‘the bigger picture’ can lead to confusion and losses on the shorter-term charts.

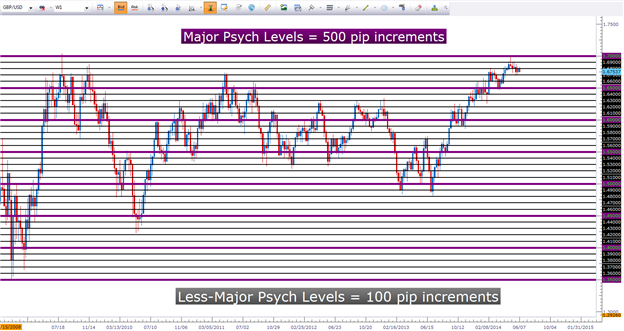
    There are numerous ways to identify support and resistance, and traders can use price action to validate any particular level; but this really only comes into play after-the-fact. Of particular interest to short-term traders are ‘psychological whole numbers.’

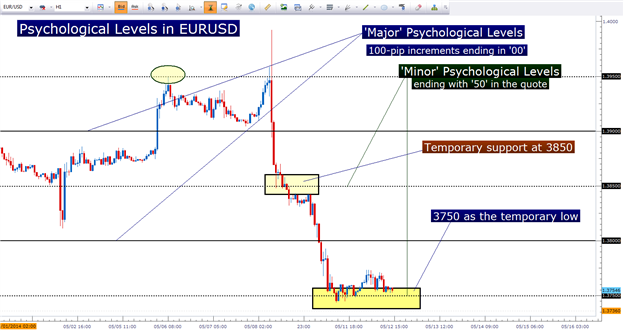
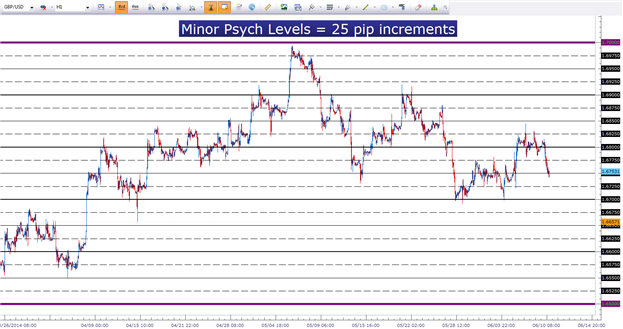
    Psychological whole numbers are simply even, rounded values on the chart. As an example 1.3900, 1.3800 and 1.3700 are ‘round’ whole numbers in EURUSD, as each of these prices end in ’00.’ But we can take this a step further with the values mid-way between these three levels, 1.3850 and 1.3750 are also ‘rounded whole numbers.’

    Take a look at the most recent move in EURUSD in the chart below, and notice how even in a strong-trending market the level of 1.3850 offered temporary support as the pair could not break through. Eight hours later that momentum came back in the market as the level finally yielded to selling, only to see 1.3750 come in as support shortly thereafter.

    Psychological levels can have a huge bearing on price action


    At this point, the pair has still failed to break below 1.3750 as support has come into the market after the most current 200+ pip run to the down-side.

    Will every price ending in ‘50’ or ‘00’ elicit support or resistance? No. But short-term traders need to remain cognizant of the potential for support and resistance to develop at these values as trends move into new territory.
    If a trend appears as though it may have run into a brick wall of support or resistance, traders can use this opportunity to scale out of a position, adjust stops, and or plan re-entries after prices finish retracing and continue moving in the trend-side direction.

    --- Written by James Stanley

    More...

    ---------

    Psychological Levels
    - PsyLevels_v2 indicator with template is here.
    - PsyLevels_Dashboard_v1 indicator is on this post. Indicator is having the ability to watch the breakout and/or bounce levels on any number of currency pairs. Plus you can watch the candle direction on any number of time frames. The dashboard also have the popup/email alerts when the breakout/bounce direction matches with all candle directions.
    - PsyLevels_v2.1 indicator is here. This version works with Metatrader 4 build 600 and above.

    Pivot Points Forex Strategies-psylevels_db_1.png

  2. #12
    member ForeCastle's Avatar
    Join Date
    Apr 2013
    Posts
    1,077
    Blog Entries
    236

    Should You Exit Your FX Trade On Strength Or Weakness?

    Talking Points:
    -Why Traders Neglect the Exit
    -Two Exit Approaches
    -Specific Tools for Both Exit Strategies

    “You can’t control what the market does, but you can control your reaction to the market. I examine what I do all the time. That’s what trading is all about.”
    -Steve Cohen, Hedge Fund Manager

    In my experience, the more years a trader has under their belt, the more attention they pay to the exit on their trade. It’s not that the entry isn’t important, it’s just that there’s a direct profit impact based on your exit. This article will breakdown two methodologies for exiting your forex trades so that you can choose the one that aligns best with your personality & goals.

    Why Traders Neglect the Exit

    As a trader, it’s easy to focus on entering the trade. After all, you’ve got to be in it to when it and the only way to be in it is to find an entry. And when it comes to entering into a trade, your mind is likely to race to different outcomes about whether or not this trade will be a home-run that “can’t fail” or whether you’re not 100% sure on the trade and therefore, should either hold-off or enter with a smaller trade size. For what it’s worth, regardless of your analysis, the second attitude used as an example is the healthier approach.


    However, it’s probably best to take the pressure of yourself regarding the entry. Why? Because, you likely will get at best a decent entry unless you’re counter-trend trading. It’s an irony or paradox of trading that most new traders fret about the entries but where they decide to exit is the most crucial point.

    Learn Forex: EURUSD SSI overlaid on EURUSD Spot Price


    This is an opportunity to offer you some tough love. You’re likely going to have poor entries. According to the trend of EURUSD (higher from July 9th, 2013) and trading positioning (net short since July 10th, 2014) most traders have had pretty poor entries seeing that a majority were short in an uptrend. However, the key difference between those who lost capital and survived to trade the next day or better yet trade with the trend and against the majority likely had clear exits planned out.

    Two Exit Approaches

    This part is simple. As far as I’m concerned, there are only two ways that you can decide to exit a trade (well, three if not having a plan is a way to exit). The first method benefits short term traders and that is exiting on strength in the direction of your entry. Therefore, if you’re buying, you can look for clear resistance points or other methods to exit when others are jumping in. The drawback to this methodology is that you could be exiting as the move is just getting started.

    The second method is to the benefit of swing style or longer term traders. The preferred exit methodology for longer-term traders is to exit on weakness or a correction in the trend that you’re entering. Exiting on weakness has two distinct drawbacks and that is you either get taken out on a wick low before the trend resumes and / or, you find yourselves leaving a large portion of your paper profits on the table.

    Specific Tools for Both Exit Strategies

    We just discussed that you can either decide to exit your trades on strength or weakness. To exit on strength, here are a few methodologies you can use that I’ve found favorable over the years:

    My preferred methodology is Pivot targets. In a normal uptrend, I’ll look to exit at the weekly R1 level and in a strong uptrend, my preferred exit is the R2 (reversed for downtrends with S1 & S2). The other two methods have been used successfully by many traders.

    For exiting on weakness, the most favored methodologies is a daily close below (above in downtrend):
    Emotionally, I believe it’s harder for new traders to exit on weakness. The reason is that it’s easy to beat yourself up for letting so much of your paper profits go away. In order to be comfortable exiting on strength, it’s best to not look at the chart after you exit for a few hours because you don’t want to beat yourself for taking money out of the market. That’s what we’re doing here in the first place!

    Happy Trading!
    ---Written by Tyler Yell, Trading Instructor

    More...

  3. #13
    member ForeCastle's Avatar
    Join Date
    Apr 2013
    Posts
    1,077
    Blog Entries
    236

    Static Support and Resistance in the Forex Market

    Talking Points:

    • Traders can use support and resistance to grade market conditions, define trends, and enter positions.
    • We discuss ‘static’ methods of support and resistance in the below article.
    • We delve into pivot points, and psychological support/resistance analysis.


    One of the first aspects of technical analysis that most new traders learn is the field of support and resistance.

    After all, if price has hit a floor with which it may have difficulty breaking through (support) or a ceiling with which it may not be able to rise above (resistance); this can offer a plethora of trade ideas and setups.

    Unfortunately, most new traders learn one or two ways of identifying support or resistance; and when they see that it doesn’t work all-of-the-time, they abandon such studies in hopes of finding ‘holy grails’ elsewhere.

    Well, holy grails don’t really exist. It often takes the new trader some time to learn this lesson the hard way: There is no strategy or approach or indicator that will allow a trader to always win, no matter how strong the analytical method being employed. Rather, trading is about probabilities and attempting to get them on your side or in your favor as much as humanely possible using this analysis.

    Support and resistance has a special role in this analysis. It can be used to grade market conditions, determine trends, identify entry and exit points along with a bevy of other options.

    Pivot Points

    This is one of the more common mannerisms of identifying support and resistance, and it’s also one of the oldest. Pivot points originated before computers became common in financial markets as floor traders need a quick and easy way to see if prices were ‘cheap’ or ‘expensive.’

    So these floor traders developed a short-hand manner of getting support (cheap) and resistance (expensive) levels.

    These floor traders would take the previous day’s high, low, and closing prices and would average these
    values together to find the ‘pivot’ for the next trading day. Price action trading above this pivot would be ‘bullish’ while prices below would be ‘bearish.’

    While this is fine and good, it doesn’t tell us much about support or resistance yet; so to take this a step further, traders would then multiply the pivot by two, and would then subtract the previous day’s low to get the first level of resistance (R1). They can then do the same to find the first level of support (S1), multiplying the pivot value times two and then subtracting the previous day’s high.

    After the R1 and S1 values are solved, traders can then move on to the next levels of support and resistance. To find the second level of resistance (R2), traders can add the pivot value to the difference between R1 and S1; and the second level of support could be found by subtracting the difference between R1 and S1 from the pivot value. The full equation is below:


    As you can see from the equation, pivot points use very basic math to find potential support and resistance levels. Luckily for traders, most charting packages will automatically do this math for us while plotting the support and resistance levels at appropriate intervals.

    Pivot Points can be generated for a variety of time frames, and the longer-term pivots will often work best as more traders may be seeing and reacting to those levels.

    As with most forms of technical analysis, the longer the term being used in the analysis the stronger the response that may be elicited. Pivot points of monthly and weekly flavors will often attract significant interest, and should be followed by traders even if using shorter-term hourly and four-hour charts.

    Monthly and Weekly Pivot Points can bring value on long as well as short time frames


    Psychological Levels

    One of the most alluring aspects of technical analysis is the ability of statistics and mathematics to show patterns in human behavior. Nowhere is this more prominent than in the study of ‘psychological’ levels in financial markets.

    Most human beings think in even rounded whole numbers. We can’t help it; our species has evolved to value simplicity. As an example, ask someone how much they paid for their car or their jacket, or even their latte.

    They’ll likely round their answer up (or down) to the nearest round number. This type of rounding will often happen in markets as well; as traders place their stops or entry orders at or around these levels in the same way that most human beings will respond when asked how much they paid for their coffee.

    GBPUSD Weekly chart with ‘Major,’ and ‘Less Major’ levels identified


    As you can see, these levels can come up quite often in a market, particularly during strong trends as new prices run into fresh resistance levels (or support levels in the case of a down-trend).

    This study of support and resistance can be taken a step further with the ‘minor’ prices that are set in 25-pip increments; known as the ‘minor’ psychological levels. In the chart below, we’ve moved down to the hourly chart in the same market looked at above (GBPUSD) with the addition of these more granular ‘minor’ levels:

    Hourly GBPUSD with Minor psychological levels added (25-pip increments)


    With psychological levels taking place every 25 pips, there are numerous opportunities for traders to ‘catch swings’ in a market.

    To put more power behind psychological levels or pivot points, traders can look for confluence amongst these analytical methods; including the dynamic support and resistance mechanisms that we’ll investigate in our next installment.

    --- Written by James Stanley

    More...

  4. #14
    member ForeCastle's Avatar
    Join Date
    Apr 2013
    Posts
    1,077
    Blog Entries
    236

    Allow Pivot Points to keep your Emotions in Check for Better Entries

    Talking Points:

    • Emotions Gone Wild
    • Using Pivots to See Common Chart Points
    • Finding Great Range Entries of Pivots

    There’s a common belief that most market moves are the result of two emotions, greed and fear. However, it may be appropriate to look at greed as another side to the same coin of fear because greed is often acted on in the fear of missing out of a ripe trade. Naturally, emotionally entries are rarely good entries and we’ll take a look at using pivots to keep your emotional reaction out of trading so that you can objectively find good entries on the emotional extremes of others.

    Emotions Gone Wild


    Recently, a very important question was asked. The question could be boiled down to, why do low balance traders consistently underperform high-balance traders across the board? The answer is important for traders of all balances.

    The answer summed up is that traders with a low balance are more likely to need the money in their account for other expenses and thus are more likely to act on fear. The antithesis is the high balance accounts that have a specific advantage over the little balanced traders. In one phrase, they do no need the money or the markets and can therefore, act with little or no emotion. Put another way, traders who don’t need the market are “Fearless.”

    Using Pivots to See Common Technical Extremes

    Without pivots, it’s easy to chase price. If you’re not familiar with the concept of chasing price, it is akin to entering on an extended move. However, a similar flaw that many traders come up against is fading a strong trend. These seem like opposing forces and therefore, at least one of these groups of traders should overall be successful. However, if traders are emotionally guided, they will continue to enter and exit on excitement, which can be fatal to growing an account balance.

    Learn Forex: Weekly Pivots on USDCHF Allows Traders to See the Forest for the Trees


    This morning saw one of the more aggressive USD selling routs of 2014. While there are a handful of explanations to the selling, the emotional pull to chase price and sell on an extended move warrants caution. As you can see above, the weekly pivot S2 level was hit on Monday morning of the week of June 30th. This means an extended move opening the week and chasing that price could prove costly when you consider recent extreme moves in relation to weekly pivots.

    Learn Forex: Historical Pivots on USDCHF Favor Fighting the Temptation to Chase


    Finding Great Range Entries of Pivots

    One way to be methodical is to wait for a favorable entry that aligns with a technical convergence through pivots and or other levels. Only then, you can take a low risk: high reward trade that over time can help you trade your way toward your trading goals.

    Learn Forex: Many Levels Align on EURUSD for the Patient FX Trader


    Over time, waiting for set-ups like these to unfold can help the market come to you as opposed to you chasing the market.

    Happy Trading!

    ---Written by Tyler Yell, Trading Instructor

    More...

  5. #15
    member ForeCastle's Avatar
    Join Date
    Apr 2013
    Posts
    1,077
    Blog Entries
    236

    Trade Breakouts with Pivot Points

    Talking Points

    • An increase in volatility can cause price to breakout
    • Camarilla Pivots can be designated for planning order entries
    • Traders can use 1x extension of the trading range for profit targets

    While price may spend the majority of its time reversing between lines of support and resistance, there will also be periods of volatility when price breaks out. A price breakout simply refers to the price of a traded asset moving through a pre-designated area of either support or resistance. Savvy traders can then prepare to look for these opportunities by finding these values on their graph. To help plan for a breakout, we will continue our review of camarilla pivots.

    AUDNZD Breakout


    Support, Resistance, & Breakouts

    We will first need to identify existing points of support and resistance. When added Camarilla pivot points to the graph, these pivots will allow traders to spot a breakout using the R4 and S4 lines now available on their graph. Now traders can consider a series of options for trading.

    The easiest way to trade breakouts is through the use of a series of order entries. Entry orders set above resistance will be waiting to buy the market in the event price moves to higher highs.

    Conversely, orders to sell below the S4 line of support will be triggered upon the market moving to lower lows. Traders that would like more confirmation may also consider waiting for a candle close, then triggering a market order. The key is to get into the market on a new surge in price, which generally transpires along with an economic announcement.

    AUDNZD Entry and Target


    Risk & Profit Targets

    As with any trading strategy, traders should spend as much time planning their exits as they do their entry orders. Through the use of Camarilla Pivots, traders again can develop a very systematic methodology for exiting the market. Since the market is breaking out, risk can be managed by placing stop orders inside of the designated trading range. The rationale behind this is that if market conditions change, traders should close their positions and look for other opportunities.

    Once a stop is found, traders can then set a profit target. Since our pivot points are calculated using a fraction of the previous day’s trading range, we can again use the designated values for profit targets. Traders can look for a minimum of 1 times the denoted range, which in the example of the AUDNZD above would be 28 pips. This would equate to a 1:2 risk reward ratio when used with a standardized stop.


    ---Written by Walker England, Trading Instructor

    More...

  6. #16
    member ForeCastle's Avatar
    Join Date
    Apr 2013
    Posts
    1,077
    Blog Entries
    236

    Pivot Points for Risk Management

    Talking Points

    • Pivots Can Identify Changes in Trading Conditions
    • Stops Should Be Used When a Trade Idea is Invalidated
    • Traders Should Look for a 1:2 Risk/Reward Ratio or Better

    Managing risk is a concept all traders need to come to grips with when creating an active trading plan. This is especially important when trading a scalping or day trading based strategy. Market conditions can change rapidly, and when the market is moving against you, it is better to already have a plan to exit losing positions. This way you know exactly when and at what price you wish to close your trades before the market gets to that point. Today we will continue our look at camarilla pivots by learning how to manage risk in both range and breakout price reversal scenarios.
    Let’s get started!

    GBPJPY Breakout


    Risk and Breakouts

    For traders implementing a breakout strategy, a false breakout is always a major concern. A false breakout consists of a trade which is entered on price moving through a value of support or resistance, and then moving immediately back through this value. While there is no way to prevent a false breakout, traders can set stops to exit the market in the event breakout conditions end.

    Above we can see an example of how risk can be contained in the event of a breakout. Stop orders can be set inside of the previously identified trading range using camarilla pivots. This area has been selected for stop order placement, because it identifies an area where market conditions are changing. When the market is ranging, traders should not be holding onto breakout positions. This means in the event price drops back below the R3 value, any existing breakout positions should be closed.

    GBPNZD Range


    Risk and Ranges

    Traders using camarilla pivots also have the ability to identify and trade daily ranges. Just like our breakout example, risk should be monitored and contained through the use of a stop loss. While breakout traders look for breaches of support and resistance, range traders look for price to stay inside of these pre identified price levels. In the event of a price breakout, traders should be able to identify the changing market conditions and again manage risk on any existing positions.

    Above we can see a range reversal playing out on the GBPNZD. Price is continuing to ping between values of support and resistance. While price targets can be set at the opposing side of a range, positions should be exited in the event of a breakout. Traders can use the S4 and R4 camarilla pivots for this task. Stops can be set at these values and if price makes a higher high or lower low, any existing range trades can be closed.


    Risk and Reward

    The next step to managing risk is understanding Risk/Reward ratios. A Risk/Reward ratio simply compares the amount of pips your risk on a trade, relative to your profit target in pips. For instance in the example above, traders would be risking 33 pips while looking for a 66 pip profit target on the GBPNZD. When we ultimately look at the ratio, it creates a 1:2 Risk/Reward ratio. This means we were looking for 2x as many pips in profit for every pip placed at risk.


    More...

  7. #17
    member ForeCastle's Avatar
    Join Date
    Apr 2013
    Posts
    1,077
    Blog Entries
    236

    FX Reversals: USDCAD Tests Support

    Talking Points

    • USDCAD Tests S3 Support
    • Range Resistance Found at 1.0992
    • Prices above R4 Signal a Breakout

    USDCAD 30min Chart


    As seen in the chart above, the pair has retraced to its daily range support found at the S3 camarilla pivot near 1.0951. If support holds, traders may look for price to bounce back towards resistance. Range resistance is currently found at 1.0992, which can also be used as a primary target for range reversal traders.

    Next, traders should pay attention to today’s two breakout values. A break of price above R4 at 1.1012 would show a strong bullish continuation with the creation of new higher highs. This directly contrasts with a break below S4 at 1.0931. A move below last support would potentially expose the market to a broader market reversal. In the event of a breakout, it should be noted that market conditions are changing and signal an end of range bound markets. Traders can then consider positioning themselves with new market momentum.


    ---Written by Walker England, Trading Instructor


    More...

  8. #18
    member ForeCastle's Avatar
    Join Date
    Apr 2013
    Posts
    1,077
    Blog Entries
    236

    FX Reversals GBPJPY Begins Week at Highs

    Talking Points

    • GBPJPY Starts Week Breaking to Highs
    • R4 Resistance Sits at 171.36
    • Range Resistance Begins at 171.08

    GBPJPY 30min Chart


    The GBPJPY has started the trading week breaking above todays R4 camarilla pivot at 171.36. This movement towards high highs is at odds with last week’s trend with the majority of GBP crosses closing near weekly lows. Intraday momentum traders can take advantage of this directional reversal and continue to look for areas to buy the GBPJPY in the event prices progress towards higher highs.

    In the event that upward momentum subsides, traders should look for a false breakout back in the direction of the prevailing trend. A move back below R3 resistance would signal and end of today’s breakout and suggest a return towards key values of support. Currently the USDJPY range measures 56 pips, with the R3 camarilla pivot at 171.08 and S3 range support found at 170.52. If price enters into the day’s trading range, traders should consider concluding breakout positions and look to trade in the markets new direction. A move below the S4 support line at 170.24, would open up the possibility of another breakout back in the direction of last week’s trend.


    More...

  9. #19
    Junior Member
    Join Date
    Sep 2014
    Posts
    6
    Hello Forecastle,
    just want to know is it the same way or method you are using to calculate the daily, weekly and monthly pivot point?

    Also what does this /3 stand for ? is it divided by 3 or what and 2* is it multiply by two or what. if it is possible can you please make some sample with illustration of the candle to shoul how you get all those figures for pivot point, support and resistance levels.

    Many thanks

    Pivot Point = (Previous High + Previous Low + Previous Close) / 3

    The other levels are created using the aforementioned Pivot value. Marketscope contains the pivot point indicator for daily, weekly and monthly levels, but yearly has yet to be added. The lines on my chart are drawn manually for your use.


    Resistance Level 1 = (2 * Pivot Point) - Previous Low
    Support Level 1 = (2 * Pivot Point) - Previous High
    Resistance Level 2 = (Pivot Point - Support Level 1) + Resistance Level 1
    Support Level 2 = Pivot Point - (Resistance Level 1 - Support Level 1)
    Resistance Level 3 = (Pivot Point - Support Level 2) + Resistance Level 2
    Support Level 3 = Pivot Point - (Resistance Level 2 - Support Level 2)

  10. #20
    member ForeCastle's Avatar
    Join Date
    Apr 2013
    Posts
    1,077
    Blog Entries
    236
    Calculation:

    OHLC

    Very simply OHLC is an acronym for Open, High, Low and Close. It describes these metrics for the previous trading day/week/month. The OHLC whilst offering its own very valuable input for Support and Resistance is also the basis for a wide range of calculations derived from it which will be described in the next section.

    Calculated Pivot Points

    Pivot Points are generally mathematically derived Support and Resistance levels, from the OHLC of the previous trading day, using a variety of formulas with names including, Standard, Camarilla, Woodie, Floor and DeMark.

    Standard Pivot Point Calculation

    To calculate the Standard Pivots the formulas below are used. This formula uses the range of the given time frame, daily, weekly, monthly etc. Which is calculated by (High-Low), R1-R4 denote Resistance Levels, PP describes the Pivot Point, S1- S4 are Support levels.

    R4 = R3 + (H - L)
    R3 = R2 + (H - L)
    R2 = PP + (H - L)
    R1 = (2 * PP) - LOW
    PP = (HIGH + LOW + CLOSE) / 3
    S1 = (2 * PP) - HIGH
    S2 = PP - (H - L)
    S3 = S2 - (H - L)
    S4 = S3 - (H - L)

    Camarilla Pivot Point Calculation

    To calculate the Camarilla Pivots the formulas below are used. This formula uses the range of the given time frame, daily, weekly, monthly etc. Which is calculated by (High-Low), R1-R4 denote Resistance Levels, S1- S4 are Support levels. The actual Camarilla number set does not have a PP and includes the Close (C) in its calculation

    R4 = (H - L) * 1.1/2 + C
    R3 = (H - L) * 1.1/4 + C
    R2 = (H - L) * 1.1/6 + C
    R1 = (H - L) * 1.1/12 + C
    S1 = C - (H - L) * 1.1/12
    S2 = C - (H - L) * 1.1/6
    S3 = C - (H - L) * 1.1/4
    S4 = C - (H - L) * 1.1/2

    Woodie Pivot Point Calculation

    To calculate the Woodie Pivots the formulas below are used. This formula uses the range of the given time frame, daily, weekly, monthly etc. Which is calculated by (High-Low), R1-R4 denote Resistance Levels, PP describes the Pivot Point, S1- S4 are Support levels. This formula also includes the Open.

    R4 = R3 + (H - L)
    R3 = H + 2 * (PP - L)
    R2 = PP + (H - L)
    R1 = (2 * PP) - LOW
    PP = (HIGH + LOW + (OPEN * 2)) / 4
    S1 = (2 * PP) - HIGH
    S2 = PP - (H - L)
    S3 = L - 2 * (H - PP)
    S4 = S3 - (H - L)

    Floor Pivot Point Calculation

    To calculate the Floor Pivots the formulas below are used. R1-R3 denote Resistance Levels, PP describes the Pivot Point, S1- S3 are Support levels.
    R3 = (P - S1) + R2
    R2 = (P - S1) + R1
    R1 = (2*P) - L
    PP = (H + L + C)/3
    S1 =(2*P) – H
    S2 = P - (R1 - S1)
    S3 = P - (R2 - S1)

    DeMark Pivot Point Calculation

    To calculate the DeMark Pivots the formulas below are used. This calculation method differs slightly from the others in terms of its structure, The PP is not an official DeMark Number but is required to calculate the formula.
    The value of X in the formula below depends on where the Close of the market is.

    If Close < Open then X = (H + (L * 2) + C)
    If Close > Open then X = ((H * 2) + L + C)
    If Close = Open then X = (H + L + (C * 2))

    R1 = X / 2 - L
    PP = X / 4
    S1 = X / 2 - H

    read more here

    =======================================

    AllPivots
    - AllPivots_v3 indicator is on this post.
    - AllPivots_v3.1 indicator is here. This is updated version of AllPivots with ability to plot Woodie's Pivots (PivotMode = 5 and BasePrice = 7).
    - AllPivots_v3.2 indicator is on this post.
    - AllPivots_v3.3 indicator is on this post.
    - AllPivots_v3.4 indicator is on this post.
    - AllPivots_v3.5 indicator is on this post. This is the version improved by new parameter - DescriptionPlace
    - How to use this indicator by settings - read this post.
    - AllPivots_v3.6 indicator is on this post. Two new parameters to the new version for sessiona start/end for stock market.
    - AllPivots_v3.7 indicator is on this post. In this version - we can with plot Yearly Pivots
    - SDK-Pivots-v1.3 indicator is on this post.
    - SDK-Pivots-nmc indicator is on this post. This version works with Metatrader 4 build 600 and above.
    - Camarilla AlertwFibs indicator is on this post
    - AllPivots_v3.8 indicator is on this post. This version works with Metatrader 4 build 600 and above.
    - AllPivots_v3.9 600+ indicator with 'no Sunday bar' is on this post. This version works with Metatrader 4 build 600 and above.

    Premium section:

    RINA Pivots are on this thread:
    - RINA Pivots_v1 600+ indicator is on this post. This version is for the build 600 and above

    DB Strategy
    - manual about how to trade is on this post.
    - DB_Strategy_v4.6 600+ indicator is on this post. This version is for the build 600 and above
    - DB_Strategy_v4.7 600+ indicator is on this post. This is updated DB_Strategy indicator with ability to plot the Trader's Pivots and the arrow descriptions. This version is for the build 600 and above
    Last edited by ForeCastle; 09-28-2014 at 03:44 AM.

Page 2 of 5 FirstFirst 1 2 3 4 ... LastLast

Tags for this Thread

Bookmarks

Posting Permissions

  • You may not post new threads
  • You may not post replies
  • You may not post attachments
  • You may not edit your posts
  •