Page 4 of 5 FirstFirst ... 2 3 4 5 LastLast
Results 31 to 40 of 49

Pivot Points Forex Strategies

This is a discussion on Pivot Points Forex Strategies within the Trading Systems forums, part of the Trading Forum category; Talking Points -Dow Jones has been trading sideways since last Wednesday as SSI shifts towards bulls -Triangle pattern is our ...


  1. #31
    member ForeCastle's Avatar
    Join Date
    Apr 2013
    Posts
    1,077
    Blog Entries
    236

    Dow Jones Industrial Average Trades Heavy into Resistance

    Talking Points
    -Dow Jones has been trading sideways since last Wednesday as SSI shifts towards bulls
    -Triangle pattern is our technical roadmap for price suggesting another 5-7% selloff
    -DJIA support near 16,500 and possibly 15,750
    Dow Jones Industrial Average (DJIA) has been trading sideways for the past 3 trading sessions. DJIA closed yesterday near their closing level for March 23. Running into a holiday weekend, it makes sense that activity and volume was muted.

    Pivot Points Forex Strategies-dji-h4-alpari-limited.png


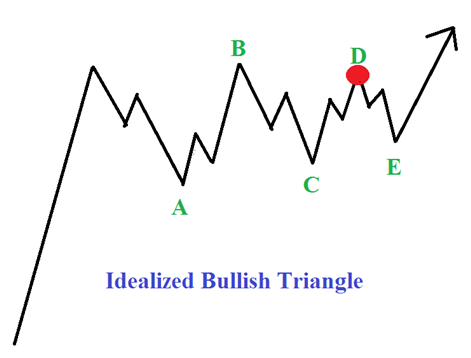
    The sideways price action in the US30, a CFD which tracks the DJIA, also provides a clue about the market’s respect for the technical pattern noted in previous reports (see links at the bottom). We have previously highlighted a potential triangle pattern that may trigger a selloff of nearly 5-7% towards 16,500 and possibly 15,750. Prices don’t have to fall, but using the triangle as the road map, look for some softening in the coming days.

    Pivot Points Forex Strategies-dji-w1-alpari-limited.png


    Above 18,000 we can consider the triangle pattern to be voided and we’ll shift our roadmap to our alternative technical patterns.


    more...
    Premium Trading Forum: subscription || The Forex Guide to Fundamentals Fundamentals
    Trading blogs || My blog

  2. #32
    member ForeCastle's Avatar
    Join Date
    Apr 2013
    Posts
    1,077
    Blog Entries
    236

    Large Gain in Dow Jones Industrial Average Presses Resistance

    Dow Jones Industrial Average closed up over 200 points on Tuesday. The move higher pressed into a zone of resistance near 17,928. Though we think prices will eventually dip into support zone 2 identified in last week’s report, the wave structure allows for price to bump up to 18,340 and still be considered corrective.

    Pivot Points Forex Strategies-dji-m30-alpari-limited-2.png


    In essence, we are looking for a downward corrective structure that eats up more time than price.
    In the meantime, we look for clues about near term support or resistance.

    Therefore, a break and close above yesterday’s high would open the door to higher levels up to 18,340. Remember, this could be a ‘B’ wave which tends to be sucker waves. In this case, below 18,340 keeps the ‘B’ wave option on the table for an eventual retest towards 17,550 and possibly lower.

    As a result, we are cautiously bullish on the short term. A shorter term trader may consider a breakout above Tuesday’s high, while targeting the April 20 high. The overnight low could be the risk near 17,830.
    Below 17,830 and to the May 6 low of 17,550 becomes no man’s land. If price prints into that zone, we’ll await more clarity while anticipating an eventual dip to support zone 2.

    more...
    Premium Trading Forum: subscription || The Forex Guide to Fundamentals Fundamentals
    Trading blogs || My blog

  3. #33
    member ForeCastle's Avatar
    Join Date
    Apr 2013
    Posts
    1,077
    Blog Entries
    236

    Gold Prices Rebound After Yellen’s Testimony Concludes

    Pivot Points Forex Strategies-xauusd-w1-alpari-limited.png


    The price of Gold is rebounding this afternoon after posting daily lows at $1,317.89. This morning’s decline was coupled with a rising US Dollar as Fed Chair Janet Yellen testified before congress. Yellen’s testimony yielded little in the way of future policy, but the Chair did note that the Fed has no “fixed timetable” for adjusting their current stance on monetary policy. With little information being yielded on the fundamental front, traders may turn to short term technical values to help determine the direction of Gold Prices

    Pivot Points Forex Strategies-xauusd-h1-alpari-limited.png


    more...
    Premium Trading Forum: subscription || The Forex Guide to Fundamentals Fundamentals
    Trading blogs || My blog

  4. #34
    member ForeCastle's Avatar
    Join Date
    Apr 2013
    Posts
    1,077
    Blog Entries
    236

    Dow Jones Industrial Average Flirts with 20,000

    Based on the consolidation that began December 14, it does appear as though DJIA may dip slightly to finish the consolidation pattern. A dip appears poised to move towards 19,750-19,840. At this point, we do not think it will extend much, but could work its way back down towards 19,000-19,250.

    Pivot Points Forex Strategies-us-30-w1-g-e-b.png


    The medium term pattern does appear incomplete to the upside. Therefore, we anticipate the dips would be supported near one of the previously cited levels.

    If price moves below 19,000 it may become an early warning signal that another pattern is at play and we will have to reassess the wave relationships. Below 18,600 we will abandon the pattern altogether.
    If prices are supported and move higher, the next level of wave relationships show up near 21,378. It would take a successful breakout above 20,000 for us to consider focusing on the higher level.

    more...
    Premium Trading Forum: subscription || The Forex Guide to Fundamentals Fundamentals
    Trading blogs || My blog

  5. #35
    member ForeCastle's Avatar
    Join Date
    Apr 2013
    Posts
    1,077
    Blog Entries
    236

    USD/CAD Weekly Trend: price is ranging near and below Yearly Central Pivot at 1.3575

    The USD/CAD is trading to fresh monthly highs this morning, despite Canadian GDP data being released above expectations. Today’s CAD GDP (YoY) (Dec) was expected in at 1.7% but was released at an actual 2.0%. While the USD/CAD's rally temporarily stalled on this news, the pair's weekly trend now spans 311 pips from high to low since Monday.

    Pivot Points Forex Strategies-usdcad-w1-alpari-international-limited.png


    Technically, the USD/CAD is now trading directly below a critical point of daily resistance. This point is the January 20th swing high, seen in the graph below at 1.3388. While the USD/CAD is trading well above its 10 day EMA (exponential moving average) and 200 day MVA (simple moving average), if prices fail to breakout higher it may suggest that the USD/CAD is prepared to retrace some of this week’s gains. Alternatively, a breakout above 1.3388 should be seen as a strong bullish continuation signal. A daily close to a higher high above this point would suggest that the current USD/CAD uptrend may have more room to run.


    more...
    Premium Trading Forum: subscription || The Forex Guide to Fundamentals Fundamentals
    Trading blogs || My blog

  6. #36
    Administrator newdigital's Avatar
    Join Date
    Feb 2013
    Posts
    10,473
    Blog Entries
    2909
    Follow newdigital On Twitter Add newdigital on Facebook Add newdigital on Google+ Add newdigital on MySpace
    Add newdigital on Linkedin

    RINA Pivots based on Dynamic Zones algorithm

    This is the the RINA Pivots that are based on the Dynamic Zones algorithm:

    Pivot Points Forex Strategies-eurusd-h1-alpari-international-limited.png


    Pivot Points Forex Strategies-eurusd-h4-alpari-international-limited-3.png


    Pivot Points Forex Strategies-rinapivots_1.png


    ----------------

    Premium section links:

    RINA Pivots are on this thread:
    - RINA Pivots_v1 600+ indicator is on this post. This version is for the build 600 and above
    Premium Trading Forum: subscription, public discussion and latest news
    Trading Forum wiki || MQL5 channel for the forum
    Trading blogs || My blog

  7. #37
    member mql5's Avatar
    Join Date
    May 2013
    Posts
    2,306
    Blog Entries
    1628

    Pivotal Points - indicator for MetaTrader 5

    Pivotal Points - indicator for MetaTrader 5

    Pivot Points Forex Strategies-de30index-w1-fx-choice-limited.png


    Pivot Points Forex Strategies-brentcrud-d1-fx-choice-limited.png


    Pivot Points Forex Strategies-brentcrud-h4-fx-choice-limited.png


    Pivotal points as described in the March 2009 SFO magazine article "Trading FX Like Jesse Livermore Traded Stocks" by Jamie Saettele.

    Livermore's strategy was based on what he termed "pivotal points". Most traders today are aware of pivot points, and many traders use some form of pivot points (of which there are too many to count) in order to identify support and resistance, which aids in entering and exiting trades. Livermore was the first trader to refer to a pivot concept. If he was not the first, then he certainly was one of the first.

    Livermore defined pivotal points as days that contained heavy volume. After a prolonged move, significantly increased volume was a key signal to him that the market was at the end of its major move. Rather than exit his position instantly, he would wait for the market to roll over and confirm that what he saw was what he referred to as a reversal pivotal point. At the end of a trend, a reversal pivotal point may be referred to today as a blow off top or a panic bottom.

    However, not all pivotal points lead to reversals. Heavy volume is often present not just at the end of a major move but also toward the middle of a trend. Take a look at a stock chart to see for yourself. If, for example, heavy volume occurs and the market in question does not roll over right away (or bounce right away), then a continuation pivot point may have occurred. When a continuation pivot point occurred, Livermore added to or even initiated his position.
    Last edited by mql5; 06-26-2018 at 04:05 PM.
    Metatrader 5 / Metatrader 4 for MQL5 / MQL4 articles preview preview
    Trading blogs || My blog

  8. #38
    member ForeCastle's Avatar
    Join Date
    Apr 2013
    Posts
    1,077
    Blog Entries
    236

    Weekly Trading Forecast: Trade Wars and Growth Replace Event

    Australian Forecast: Australian Dollar Could Face First RBA Rate Cut Since August 2016
    The Australian Dollar heads into a new week battered by more feeble data and with more to play for at an RBA meeting than usual.

    Pivot Points Forex Strategies-audusd-d1-alpari-international.png


    GBP Forecast: Sterling (GBP) Price Outlook: Brexit Anger May Dampen Sterling Strength
    UK politics look set to re-assert themselves and Sterling is very likely to suffer.

    Pivot Points Forex Strategies-gbpusd-w1-alpari-international.png


    Gold Forecast: Prices May Fall as Dollar Gains on Fed Policy Bets, Risk Trends
    Gold prices may fall as a downbeat view on global growth coupled with fading hope for imminent Fed stimulus sours sentiment, boosting the US Dollar.

    Euro Forecast: EURUSD at Risk to Bearish Euro Sentiment and EU-US Trade War Fears
    The Euro struggled appreciating despite Italy climbing out of a technical recession and improving Eurozone data. Fears of an EU-US trade war and sentiment signals may sink EUR/USD.

    Equity Forecast: Dow Jones, S&P 500, DAX 30 and FTSE 100 Price Outlook
    After a loaded week for US equities, event risk looks to subside as the S&P 500 and Dow Jones look for the path of least resistance.

    more...
    Premium Trading Forum: subscription || The Forex Guide to Fundamentals Fundamentals
    Trading blogs || My blog

  9. #39
    member ForeCastle's Avatar
    Join Date
    Apr 2013
    Posts
    1,077
    Blog Entries
    236

    Brean Crude Oil: weekly bearish breakdown; 25.71 is the key

    Crude oil prices remained close to eighteen-year lows on Monday as administrations all over the world extended lockdown procedures to try and stem the spread of the coronavirus outbreak which has already seen energy-demand forecasts cut to the bone.

    Pivot Points Forex Strategies-brn-w1-alpari-international-2.png


    The price of a barrel of crude has plummeted by 60% this year, the falls made worse by a price war between Saudi Arabia and Russia rooted in the two major exporters’ inability to agree about production cuts earlier this month. Current reductions from the Organization of Petroleum Exporting Countries and allies including Russia only run on until the end of March.

    Even under current conditions investors and specialists seem to have trouble visualizing sub-$20 prices for any extended period. February 2016’s lows in the $27.57 area look like reasonable near-term resistance on the monthly chart, but the sort of sentiment revival needed to bring them back into view remains elusive.

    more...
    Premium Trading Forum: subscription || The Forex Guide to Fundamentals Fundamentals
    Trading blogs || My blog

  10. #40
    member TheNews's Avatar
    Join Date
    Feb 2013
    Posts
    7,383
    Blog Entries
    1032

    Euro Forecast

    Pivot Points Forex Strategies-eurusd-h4-cryptorocket-limited.png


    The European Central Bank will consider it a job well done if there is no movement in EUR/USD or the Euro crosses before, during or after Thursday’s policy announcements by its Governing Council.

    more...
    Analytics and News section || Trading News Events thread
    Trading blogs || My blog

Page 4 of 5 FirstFirst ... 2 3 4 5 LastLast

Tags for this Thread

Bookmarks

Posting Permissions

  • You may not post new threads
  • You may not post replies
  • You may not post attachments
  • You may not edit your posts
  •