Page 1 of 5 1 2 3 ... LastLast
Results 1 to 10 of 49

Pivot Points Forex Strategies

This is a discussion on Pivot Points Forex Strategies within the Trading Systems forums, part of the Trading Forum category; How to Trade GBPUSD Forex Yearly Pivot Points Talking Points: From January to February 2013, GBPUSD fell 1400 pips breaking ...


  1. #1
    member ForeCastle's Avatar
    Join Date
    Apr 2013
    Posts
    1,077
    Blog Entries
    236

    Pivot Points Forex Strategies

    How to Trade GBPUSD Forex Yearly Pivot Points

    Talking Points:

    • From January to February 2013, GBPUSD fell 1400 pips breaking down through three significant pivot levels before settling
    • GBPUSD double bottom bounce from the yearly Forex S2 pivot began a 1700 pip rise
    • GBPUSD 2014 yearly Forex pivots may show excellent trading opportunities


    This continues a series of articles dedicated to revealing the yearly pivot points of each of the major currency pairs. This article is a “cheat sheet” of sort that you may want to print out and have handy so when price action tags any of these potential support and resistance levels, you will be ready to act. Past performance is not an indication of future results, however, the evidence supporting the effectiveness of yearly pivots is abundant.

    But you may be asking, “Why should we look at yearly pivots?” It is a great question. In technical analysis, the longer the timeframe, the more statistically reliable the trendline, support and resistance level becomes as more data has gone into producing each point. This greater reliability added to the large moves that happen after a bounce and a break make these levels attractive buy and sell zones for Forex traders.

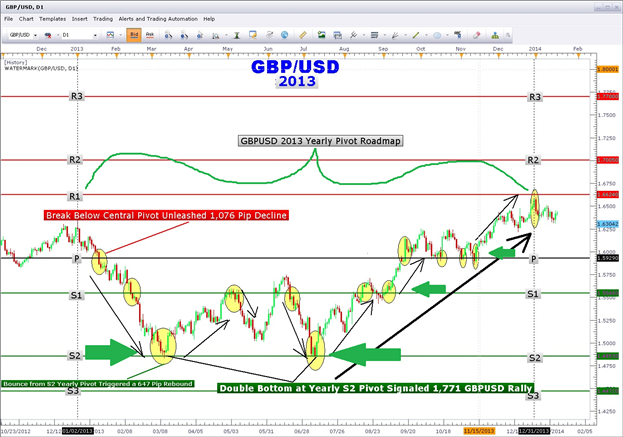
    Learn Forex: GBPUSD 2013 Yearly Pivots


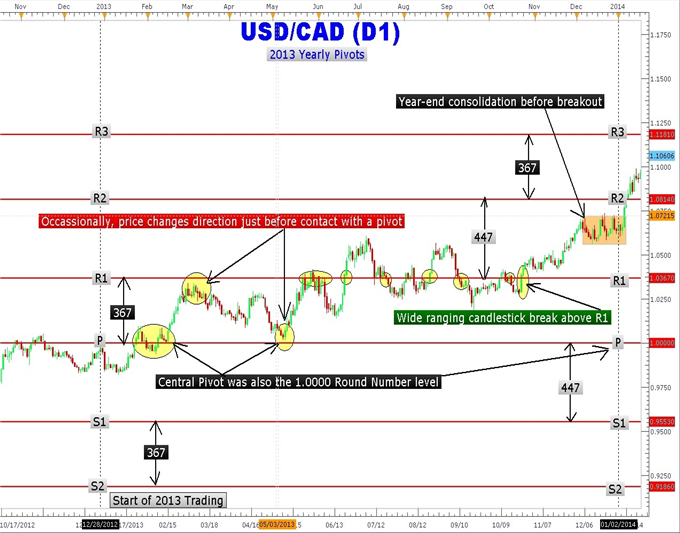
    In the above GBPUSD 2013 daily time frame chart, notice how price action interacts with each yearly pivot level. Starting in January, GBPUSD moves down from the highs of 2012 near 1.6300 and push below the central yearly pivot (1.5929) and moved down 1076 pips to the S2 pivot (1.4850). This marked the low of the year made in March and again in July near 1.4812. GBPUSD did rally from the yearly forex central pivot to the S1 pivot.

    GBPUSD retouched the S2 pivot to form a powerful forex double bottom pattern. The bullish engulfing candlestick pattern at S2 ignited a huge move back to the central forex yearly pivot and multiple bounces at the “P” level of support from September to November led to the continuation of the rally just short of the R1 on the last day of December at 1.6577, the high of the year.

    While other traders may have been scratching their collective heads and wondering why GBPUSD moved the way it did.Forex yearly pivot traders would have been made aware months in advance of these significant levels. These traders would have had a plan in place, ahead of time, to trade at these important levels as price reacted to them.

    Learn Forex: GBPUSD 2014 Yearly Pivots


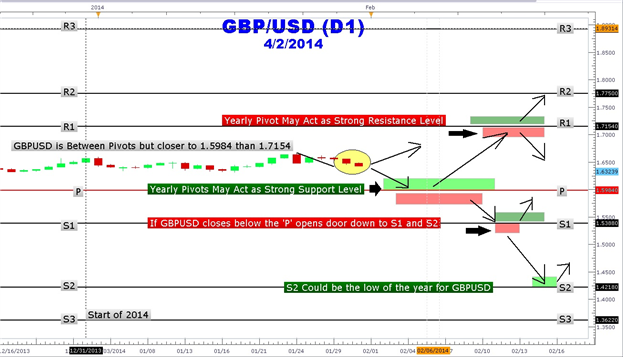
    GBPUSD Yearly Pivot Trading Plan

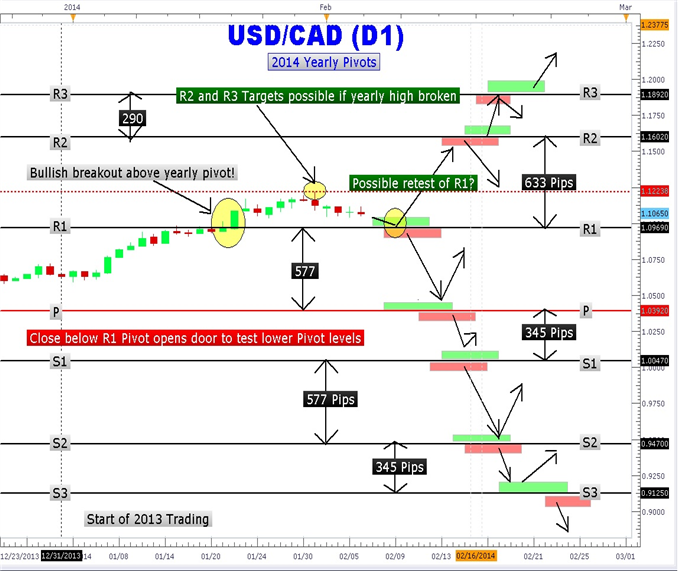
    We have seen what yearly pivot levels meant in 2013 with GBPUSD. Could we see similar moves in 2014? As it is February, we are early enough in the year to project forex yearly pivot levels for GBPUSD using the pivot formula found in the previous article. These yearly pivots have been drawn manually, but you may check back with FxCodeBase to see if they have created a plugin.

    I used the GBPUSD’s 2013 high (1.6580), low (1.4814), and close (1.6557) to derive the 2014 yearly pivot levels. GBPUSD is currently trading at 1.6323 which is between the R1 pivot of 1.7154 and the Forex central pivot of 1.5984. GBPUSD is roughly 340 pips away from the central ‘P’ yearly pivot.

    If price moves to this area of potential support, a good-sized tradable rebound to could result taking pair above the recent highs to the R1 yearly pivot (1.7154). Friday’s US employment number could be the trigger for a decline down to the next yearly pivot.
    However, a close below 1.5984 could lead to a move down to the S1 yearly pivot at 1.5388. Further cable weakness as indicated by a daily close below the S1 pivot could lead to a repeat of last year’s decline to the S2 pivot.

    The double bottom at the S2 pivot level led to the spectacular 1700-pip run that closed out the year at multi-year highs. Using this “50,000 feet” satellite view of GBPUSD, traders can get the strategic big picture and act accordingly. Since they are yearly pivots, you only have to calculate them once!

    ---Written by Gregory McLeod Trading Instructor

    More...

  2. #2
    Administrator newdigital's Avatar
    Join Date
    Feb 2013
    Posts
    10,473
    Blog Entries
    2909
    Follow newdigital On Twitter Add newdigital on Facebook Add newdigital on Google+ Add newdigital on MySpace
    Add newdigital on Linkedin
    AllPivots
    - AllPivots_v3 indicator is on this post.
    - AllPivots_v3.1 indicator is here. This is updated version of AllPivots with ability to plot Woodie's Pivots (PivotMode = 5 and BasePrice = 7).
    - AllPivots_v3.2 indicator is on this post.
    - AllPivots_v3.3 indicator is on this post.
    - AllPivots_v3.4 indicator is on this post.
    - AllPivots_v3.5 indicator is on this post. This is the version improved by new parameter - DescriptionPlace
    - How to use this indicator by settings - read this post.
    - AllPivots_v3.6 indicator is on this post. Two new parameters to the new version for sessiona start/end for stock market.
    - AllPivots_v3.7 indicator is on this post. In this version - we can with plot Yearly Pivots
    - SDK-Pivots-v1.3 indicator is on this post.
    - Camarilla AlertwFibs indicator is on this post
    Premium Trading Forum: subscription, public discussion and latest news
    Trading Forum wiki || MQL5 channel for the forum
    Trading blogs || My blog

  3. #3
    Administrator newdigital's Avatar
    Join Date
    Feb 2013
    Posts
    10,473
    Blog Entries
    2909
    Follow newdigital On Twitter Add newdigital on Facebook Add newdigital on Google+ Add newdigital on MySpace
    Add newdigital on Linkedin

    How to Use Forex Yearly Pivot Points to Forecast Euro Targets

    Talking Points:

    • Pivot points is a popular and easy way that traders can identify potential support and resistance
    • Pivot points are based on a mathematical calculation that uses the previous high, low and close of a specified period; weekly, daily, monthly, yearly
    • Yearly pivots can forecast maximum and minimum price extremes for the coming year as well as areas where price can change direction.


    As we learned in the previous article, many traders regard pivot points as significant areas of support and resistance. Pivot levels are points where price usually changes direction. Though technology and markets have evolved, pivots have remained a staple and cornerstone of technical analysis.

    While most traders are familiar with daily, weekly, and even monthly pivots which fit their type of trading, yearly pivots can also be used to forecast future potential support and resistance areas. Buying at or near a significant area of support and selling at a key area of resistance is the main focus of any trader no matter what the market or the duration traded. Yearly pivots can be monitored for those key trading opportunities.

    Learn Forex: EURUSD Yearly Pivots


    As you can clearly see in the Euro chart above, forex yearly pivots have been plotted. These have been manually created as Marketscope 2.0 charts currently does not have a yearly pivot point setting. Notice how the Euro rallied up to the R2 pivot and turned around sharply falling over 600 pips in February.
    Another significant area that can be easily seen showing the power of yearly pivots is the triple touch of the R1 yearly pivot at 1.2910. The third and final touch led to over a 600-pip rally back to the R2 yearly pivot to close out 2013 up over 4%.

    Learn Forex: EURUSD 2014 Yearly Pivots


    EURUSD 2014 Yearly Pivots

    Could forex yearly pivots show traders the next move in the Euro? In the chart above the 2014 yearly pivots are plotted on the EURUSD chart. The year is just getting started and the great thing about yearly pivots is only having to draw them once a year! EURUSD is trapped between the central pivot at 1.3461 and R1 at 1.4177. As at the time of this writing, the Euro has not tested either pivot. However, forex traders may be waiting for a move down to the central pivot (1.3461) for a move back toward the R1 (1.4177) yearly pivot resistance.

    Alternative scenario is for the Euro to make an immediate run for it up to the R1 level. At R1 pivot resistance, traders may look to take profit on their longs and/or short the Euro at this level. However, a close above R1 could lead to a move higher to the R2 pivot (1.4610). Traders should also consider the possibility of a close below the central pivot that could lead to a prolonged down push to the S1 (1.3028) level.

    Forex traders who scalpers, position or swing traders can make use of yearly pivots to locate key areas of support and resistance. Look for future articles on other currency pairs that lay out the yearly pivot ‘landscape’ to help you navigate the forex market.

    ---Written by Gregory McLeod Trading Instructor

    More...
    Premium Trading Forum: subscription, public discussion and latest news
    Trading Forum wiki || MQL5 channel for the forum
    Trading blogs || My blog

  4. #4
    Administrator newdigital's Avatar
    Join Date
    Feb 2013
    Posts
    10,473
    Blog Entries
    2909
    Follow newdigital On Twitter Add newdigital on Facebook Add newdigital on Google+ Add newdigital on MySpace
    Add newdigital on Linkedin

    How to Use Yearly Pivot Points to Forecast USDJPY Targets

    Talking Points:

    • In 2013, USDJPY tested and rebounded from yearly pivot points numerous times.
    • USDJPY could retest the Central yearly pivot down at 99.08
    • USDJPY has traded between 102.00 and 103.50 for 6 days while other yen pairs have broken down


    In this article, we will continue this examination of the not-so-often discussed USDJPY yearly pivots. Yearly pivots may show the end of this correction and reveal a potential trade setup to catch the resumption of a very powerful USDJPY uptrend in its earliest stages.

    Learn Forex: USDJPY 2013 Yearly Pivots


    As evident in the USDJPY daily time frame chart, that yearly pivots provided traders with several good entry points in both trending and ranging environments. The February break higher above the R1 pivot (90.33) led to the move to the New Year’s high of 105.43. However, the move higher was not in a straight but had several retracements at yearly pivots.

    Since many traders are not paying attention to these invisible areas of support and resistance, they were caught off guard when USDJPY stalled in a particular areas or bounced from other areas. USDJPY behavior can be easily explained once yearly pivots are applied to the chart.USDJPY close above the R3 pivot in December 2013 at 101.09 led to over a 400 pip run into 2014.

    Learn Forex: USDJPY 2014 Yearly Pivots


    USDJPY Yearly Pivot Trading Plan

    As you can see in the chart above, I have manually created yearly pivots using the formula found in the first article and the 2013 USDJPY high, low and closing price. Currently, USDJPY is trading at 102.30 between the central pivot at 99.08 and R1 at 111.63. If USDJPY correction continues to move down to 99.08 and rebounds from this area, we could see a move to 111.63 and beyond. The central pivot also coincides with a 61.8% Fibonacci retracement area as well. January’s US Employment report could be the catalyst. Another weak job number could spark more risk aversion and a flight into Yen.

    On the other hand, a close below P (99.08) could lead to a run down to the S1 92.75 level. Notice how these pivots have several hundred pips of space between them and are ideal for longer term trading but can be very effective in short-term day trading in providing high probability entries and exits near these levels. This allows traders the opportunity to trade in and around a core position.
    In sum, USDJPY yearly pivots are worth adding to your charts so you can be ready for the next leg up in USDJPY.

    ---Written by Gregory McLeod Trading Instructor

    More...
    Premium Trading Forum: subscription, public discussion and latest news
    Trading Forum wiki || MQL5 channel for the forum
    Trading blogs || My blog

  5. #5
    member ForeCastle's Avatar
    Join Date
    Apr 2013
    Posts
    1,077
    Blog Entries
    236

    How to Trade AUDUSD Forex Yearly Pivot Points

    Talking Points:

    • Significant Support and Resistance levels provide excellent risk/reward trades
    • Longer time frame support and resistance is more reliable than shorter time frame support and resistance levels.
    • AUDUSD is in the middle of a 1155 pivot range and is poised to move to the P or S1 yearly pivots


    This fourth installment of the Forex majors yearly pivot series takes a look at AUDUSD, commonly known as the Aussie. Since trading above the 1.0600 handle area back in 2013, AUDUSD some 1900 pips. This decline was not in a straight line as price made “pauses” along the way.
    These pauses were great opportunities for traders to catch a “ride” on this southbound train! Forex yearly pivots helped to identify these areas of consolidation. Using Forex yearly pivots, traders had choice to enter new positions, take profits on existing positions, or pyramid profits with additional positions.

    Learn Forex: AUDUSD 2013 Yearly Pivots


    In the above chart, notice how the Aussie was in a choppy trading range for the first 4 months of the year. Notice how there were a few false breaks below the central pivot level indicated by line “P”. As price failed to make a new high, there was another big push to test the resolve of the central pivot. Finally, on May 6th a breakout below the March 4th low led to a 578 pip run down to the S1 pivot.

    If Forex traders missed that move down, there was nine days of consolidation at the S1 pivot that allowed traders to pick up another 695 pips on a run down to the yearly S2 pivot at 0.9005. Traders may have been stopped out a couple of times trying to short below S2 as price snapped back up.

    However, the resulting double bottom chart pattern led to a 695 pip rind back to the S1 pivot. A bearish engulfing Japanese candlestick pattern at S1 on October 23 capped the rally leading to the Aussie closing at the lows of the year just below the S2 pivot at 0.8865.

    Learn Forex: AUDUSD 2014 Yearly Pivots


    AUDUSD Yearly Pivot Trading Plan

    After a slow and choppy start in 2013, AUDUSD showed the direction it wanted to go; down. Once the first pivot was penetrated and cleared, AUDUSD took off in a fairly obvious direction punctuated by long, wide ranging red bars signaling that the bears were in full control. It paid to wait and stand aside for the “real” move. Fast-forward to 2014, and we can see Aussie heading to yearly highs near 0.9076.

    A close above the yearly high opens up a move to the central pivot at 0.9444. If the Aussie bounces down from this resistance point, then a very good shorting opportunity has revealed itself and Forex yearly pivot traders would take special note of this level.

    On the other hand, look for a break below the 2014 low of 0.8659 for a move down to the S1 yearly Pivot at 0.8289. The downtrend would have shown itself strong and we could eventually see a test of the S2 yearly pivot at 0.7666.

    Remember, Aussie is prone to large retraces that look like reversals. If the pair is not trading above the October 23, 2013 high of 0.9756, then such moves higher should be treated as opportunities to short at better levels. It may take a little time and patience for price to hit yearly forex pivot levels, but the reward may be worth the wait!

    ---Written by Gregory McLeod Trading Instructor

    More...

  6. #6
    member ForeCastle's Avatar
    Join Date
    Apr 2013
    Posts
    1,077
    Blog Entries
    236

    How to Trade USDCAD Forex Yearly Pivot Points

    Talking Points:

    • Yearly Pivot Points are one type of Forex support and resistance used by traders.
    • Bounces from yearly pivots usually lead to several hundred pip moves.
    • USDCAD has broken above the R1 Pivot and is now less than 96 pips from the R1 pivot


    This is the fifth in a series of articles dedicated to yearly pivots points. Yearly pivot points is a remarkable method for creating a long term trading outlook based solely on price action and its behavior at or near a significant level of support or resistance. We have already looked at the Euro, USDJPY, GBPUSD, and AUDUSD.

    USDCAD the next currency pair that we will look at how effective trading using 2013 yearly pivots. Then we can plot 2014 Forex yearly pivot points on USDCAD. Since these are yearly pivot points, they are only drawn once. They predict potential areas of support and resistance that traders can use to enter and exit trades. They are rigid and do not float, move or repaint because these levels are created using the pivot point formula and the High, Low, and Close of the year.

    Pivot Point = (Previous High + Previous Low + Previous Close) / 3

    The other levels are created using the aforementioned Pivot value. Marketscope contains the pivot point indicator for daily, weekly and monthly levels, but yearly has yet to be added. The lines on my chart are drawn manually for your use.

    Resistance Level 1 = (2 * Pivot Point) - Previous Low
    Support Level 1 = (2 * Pivot Point) - Previous High
    Resistance Level 2 = (Pivot Point - Support Level 1) + Resistance Level 1
    Support Level 2 = Pivot Point - (Resistance Level 1 - Support Level 1)
    Resistance Level 3 = (Pivot Point - Support Level 2) + Resistance Level 2
    Support Level 3 = Pivot Point - (Resistance Level 2 - Support Level 2)

    Learn Forex: USDCAD 2013 Yearly Pivots


    As you can see in the above USDCAD daily chart, price rallied in late December and into January stopping at the central pivot (P) and reversing. From January 23rd to February 18th, USDCAD consolidated in a chopping range popping up above the central pivot and back down below the central pivot. A breakout of that range takes USDCAD just short of the R1 pivot. Then the pair returns back within a few pips of the central pivot on May 9th.

    One important concept to understand is that these support and resistance areas are not concrete barriers but more like zones of support and resistance. Price may come within 50 pips of a yearly pivot on either side and then turn around. This would be considered a valid touch.There were a number of touches and breaks of the R1 pivot for 5 months before the October 25th 360-pip breakout to the 1.0725 area. To finish out 2013.

    Learn Forex: USDCAD 2014 Yearly Pivots


    The 2014 USDCAD Yearly Pivot Trading Plan

    With USDCAD so close to the yearly forex pivot at 1.0969 area, the current correction may find support at the R1 pivot (1.0969) or turnaround from current levels. The first target would be the old yearly high of 1.1223. A close above this high could open a path to the R2 pivot at 1.1602 and the R3 pivot at 1.1892.

    Friday’s 8:30AM ET US Employment number could be the spark that ignites a massive rally to the upper pivots. On the other hand, USDCAD could sell off if the employment number comes in lower than expected. Over the course of a few weeks, price may move below the R1 pivot and move down to the central pivot down at 1.0392.

    As with any type of support and resistance, Forex traders are looking for breaks or bounces from these key areas. These areas are watched heavily by Forex traders around the world and often are used as option levels as well. So you may want to print this article out and pin it on your wall or just simply place a couple of the nearest yearly pivots on your charts for reference.
    ---Written by Gregory McLeod Trading Instructor

    More...

  7. #7
    member ForeCastle's Avatar
    Join Date
    Apr 2013
    Posts
    1,077
    Blog Entries
    236

    How to Trade Gold Yearly Pivot Points

    Talking Points:

    • Commodity pit traders have used pivot points for decades to determine potential support and resistance areas.
    • Gold yearly pivot points from 2013 forecasted significant turning points
    • Gold is approaching the 2014 central yearly pivot point at 1360.82


    In this continuing series highlighting the seldom mentioned topic of yearly pivots, gold will be covered in detail. We will look at how yearly pivots in 2013 marked significant turning points in gold as well as the levels to watch out for with the new set of 2014 yearly pivots.

    The year 2013 was not very kind to the shiny metal. Gold plunged 27% or just over $450/oz. in one of the biggest declines in many years. However, after hitting a three year low of 1178.86 back in December 2013, gold has managed to crawl back higher in 2014.Yearly pivots marked gold's decline with pinpoint accuracy.

    Learn Forex: Gold 2013 Yearly Pivots


    The sudden and severe $141/oz. drop in gold in the beginning of 2013 caught many gold traders off guard. However, traders who watched gold yearly pivots knew ahead of time that a close below the central pivot (P) at $1661.75/oz.

    Notice in the chart above how price hugged the central pivot red line. The close below the yearly central pivot marked the beginning of a year-long decline to 3-year lows.

    Even after reaching a low of 1208, the subsequent gold rally in July was stopped dead in its tracks at the S2 yearly pivot at $1392.79/oz. Gold went on to make the low of the year at 1179.86. Yearly pivots were useful for determining the beginning of the decline as well as locating areas to re-enter or add more to a position. You may now be wondering what the 2014 yearly pivots have in store for gold.

    Learn Forex: Gold 2014 Yearly Pivots


    Gold Yearly Pivot Trading Plan

    Gold starts 2014 higher than where it left off in 2013. Crossing above the psychologically important $1300 level, gold is a long way from the lofty highs in the $1900 area. The first major yearly pivot hurdle is just $40.00 away at the central yearly pivot at 1360.82. This was also the highs of October 2013. Pivot points often act as magnets “pulling” price up or down to the nearest pivot.

    The current weekly Japanese candlestick pattern is an indecision doji/spinning top. This gives us a “fork in the road” or decision point; price could break higher or lower from this point and continue to trend in the breakout direction. A new candle is due out next Monday and if it can break above the 1332 high of the doji candle could lead to an explosive move toward the R1 pivot and beyond. Moves above the central pivot are regarded as bullish.

    On the other hand, a break below 1307.26 low of the weekly doji candle opens move toward the lows of 2013 in the 1186 area and a test of the S1 yearly pivot at 1024.25. Remember that yearly pivots represent potential support and resistance. Using the pivot point calculation on the high low and close of 2013, these levels can be created. Yearly pivot levels can help traders determine price targets for taking profit as well as entry and stop areas.

    ---Written by Gregory McLeod Trading Instructor

    More...

  8. #8
    member ForeCastle's Avatar
    Join Date
    Apr 2013
    Posts
    1,077
    Blog Entries
    236

    How to Trade EURJPY with Yearly Pivot Points

    Talking Points:

    • EURJPY is just 3.7% off of its 5-year high of 145.89
    • On 2/14/2014, EURJPY rebounded from the forex yearly pivot area at 134.65
    • Rebounds from Forex yearly pivot zones usually take price to the next yearly pivot. In this case, R1(155.75) is the next level for EURJPY


    While a strong uptrend in the second half of 2012 which carried EURJPY into 5-year highs in 2013, EURJPY has been fairly tame in 2014. EURJPY was fueled by a loose Japanese monetary policy affectionately called “Abenomics” named after the Japanese Prime Minster, Shinzo Abe. His “three arrows” plan of fiscal stimulus, monetary easing, and structural reforms was designed to awaken the economy that has been sluggish for 20 years.

    EURJPY rocketed over 30% from the lows of July 2012. There were pauses along the way and forex yearly pivots could have been used to climb aboard this strong trend.

    Learn Forex: EURJPY Yearly Pivots


    Notice in the chart above that the R1 pivot is the first level EURJPY hits at 121.41 in January. Savvy Forex yearly Pivot point traders would have had two days of consolidation to enter long as the currency pair tested support from the top side. From R1, price runs up over 700 pips stopping just short of the R2 yearly pivot at 128.35.

    For traders who missed this move up, there was a second and third opportunity to get long EURJPY in the form of a double bottom just below the 121.41 (R!) support. A bullish engulfing candle in April signaled that the uptrend was resuming unlocking another 800 pips.

    Finally, EURJPY had built a base on the forex yearly R2 pivot at 128.35. This sideways movement along support paved the way for the massive breakout to the R3 pivot located at 142.00. There was one last break out above R3 to a 5-year high of 145.89.

    We can see how yearly pivots can help traders see potential areas of support and resistance. Next we will fast forward to current EURJPY price action and see how we can use yearly pivots to find trading opportunities.

    Learn Forex: EURJPY 2014 Yearly Pivots


    As you can see the chart above, EURJPY drifted from 145 down to 136.22 near the central yearly pivot at 134.65. Sometimes a currency pair hits the pivot exactly, other times it may move a few pip beyond. So rather than thinking of support and resistance levels like pivots as a concrete wall, think of them more like permeable and stretchy zones Yearly pivots have wider margins of error due to their size, so if price comes within 100 or 200 pips of a yearly pivot and changes direction, then we would consider it a “touch”

    EURJPY could rally up to R1 near 155.75. However, the old 2013 high at 145.89 stands in the way. Forex yearly pivot traders will be looking at the old high before considering big bullish bets.EURJPY come down to retest the central pivot again forming a double bottom formation for a move higher.

    On the other hand we could see seasonal yen strength due to the end of the Japanese fiscal year which happens at end of March. Japanese multinational corporations usually repatriate yen back to Japan to close their books. If these flows are substantial, EURJPY could visit the S1 Pivot at 123.61 before moving back to new highs. A falling stock market and falling US 10 year interest rates could trigger flows into yen as well. These are markets that are highly correlated to yen moves. Watching yearly pivots on EURJPY can help demystify the upcoming moves in 2014.

    ---Written by Gregory McLeod Trading Instructor

    More...

  9. #9
    member ForeCastle's Avatar
    Join Date
    Apr 2013
    Posts
    1,077
    Blog Entries
    236

    How to Trade NZDUSD Yearly Pivot Points

    Talking Points:

    • The Reserve Bank of New Zealand may raise rates 25 basis points at their next meeting
    • NZDUSD is at 2014 high after rebounding strongly from a yearly pivot
    • Forex yearly pivot pints can show key areas to trade


    In this next in a series of articles focused on forex yearly pivot levels, we take a look at how we can apply yearly pivots to trade the New Zealand Dollar versus the US Dollar currency pair. By using these specialized support and resistance levels, forex traders can anticipate probable turning points in price. In addition, forex traders can predict future price targets using these forex yearly pivot levels.

    Learn Forex: NZDUSD Weekly Chart with Yearly Pivots


    First of all, let’s take a quick trip back in time to take a look at how forex yearly pivots worked to create an operational trading framework for NZDUSD price action. As 2013 NZDUSD trading got underway, price action was trapped in a fairly tight range for the first three months of the year.

    However, in March, NZDUSD staged a rally from a low of 0.8161 up to test the R1 yearly pivot at 0.8678. Failure to close above this yearly pivot led to a subsequent 610-pip decline to the central pivot (P) at 0.8068 in June.
    The Kiwi was unable to stage a successful rally from the central pivot. Price broke below the pivot and collapsed another 409-pips down into the area of the S1 pivot at 0.7659. From the yearly S1 pivot, NZDUSD staged a couple of rallies in July and August back to the central pivot forming a very visible double bottom chart.

    This double bottom bounce form the S1 pivot led to a powerful 831-pip move into the 0.8500 handle. As you can see, yearly pivots marked the beginning of powerful moves. But could forex history repeat for NZDUSD in 2014?

    Learn Forex: NZDUSD 2014 Yearly Pivots


    Unlike 2013 where NZDUSD got off to a slow start before rallying, Kiwi immediately moved down to test the 0.8190 yearly pivot at the start of 2014. After two weeks of trading at the yearly central pivot, NZDUSD broke out with a bullish engulfing candle. NZDUSD has been up trending ever since and currently sits at the 0.8468 area.

    This is roughly the midpoint between the R1 pivot at 0.8697 and the central pivot at 0.81900. The bullish engulfing candlestick pattern is a great reversal candlestick pattern. It represents a shift in the overall market sentiment from bearish to bullish. A daily close above the R1 yearly pivot could open a path to 0.9436.

    Today at 4:00PM ET the Reserve Bank of New Zealand (RBNZ) coming out with their rate decision. It is widely expected that New Zealand’s central bank will hike rates 25 basis points from 2.50% to 2.75%. Since investors and traders follow yield, NZDUSD could move higher toward the R1 pivot at 0.8697.

    On the other hand, if the RBNZ fails to raise rates, we could see a Kiwi sell-off back toward the central pivot at 0.8190. Though Forex traders only put yearly pivots on their charts once, yearly pivots can produce several good trading setups over the course of the year.

    ---Written by Gregory McLeod Trading Instructor

    More...

  10. #10
    member ForeCastle's Avatar
    Join Date
    Apr 2013
    Posts
    1,077
    Blog Entries
    236

    Should You Adjust Where You Start Your Fib Retracements?

    Talking Points:

    • Primary Way of Drawing Fibs
    • Taking Key Impulses on the Chart to Draw Fibs
    • Looking For Confluence Price Targets


    It’s easy to feel like you’ve found the Holy Grail when you’re first introduced to the Fibonacci sequence and furthermore, the Fibonacci ratios. The common Fibonacci ratios of 38.2%, 61.8% & 76.4% can help you spot a turn-around in a correction off the prior trend. However, the way you’ve likely been taught to apply Fibonacci retracements to the chart is the only way to squeeze value out of this great tool.

    Primary Way of Drawing Fibs

    Fibonacci seems so easy at first. All you have to do is pull up a chart and then draw a Fibonacci retracement from the highest high to the lowest low. However, if you’re familiar with Elliott Wave, you know that a lot of trends and corrections happen within the highest high to lowest low. Therefore, the primary way of drawing fibs (highest high to lowest low) may not be the most helpful way for trading.

    Learn Forex: Traditionally, Fib Retracements Are Drawn From Low to High


    Taking Key Impulses on the Chart to Draw Fibs

    The key idea to focus on here is that charts are fractal and so are trend moves. Fractal is a fancy way of saying that within one large move higher (or lower) there is many smaller bullish (bearish) trends and bearish (bullish) corrections. Fibonacci retracements are great to help you see where the correction against the trend could run out of steam so we can dissect the moves to help fine-tune some of the levels you should be focusing on.

    Learn Forex: Fibonacci Retracements Applied to Individual Impulses


    As you likely learned in a prior article, traders would do well do look for confluence of Fibonacci levels. Fibonacci confluence develops when a Fibonacci expansion and Fibonacci retracement come together. The chart above shows not only a combination or cluster of Fib levels around 1297 but also the 55-dma & 200-dma could act as support. One thing is for sure, a lot of traders using different tools could well be looking to buy XAUUSD from these levels.

    Looking For Confluence Price Targets

    Confluence can help you do two things. First, if you’re trading the correction, you can look to exit the trade at strong Fibonacci confluence levels or bring your stop to break even so that you can ride out the correction or new trend with little risk. Second, if you focus only on trading in the direction of the overall trend, a key price action signal off of a Fibonacci confluence level can help you to re-enter the trend at a great level.

    Learn Forex: Strong Fib Confluence on EURUSD should keep your attention


    Closing Thoughts

    Adjusting your Fib start and end points can be very helpful. Look for strong impulsive moves to start drawing your fibs as opposed to extreme highs and extreme lows. Regardless of your newfound knowledge, continue to manage your risk and I hope you find yourself entering into the trend earlier than before.
    Happy Trading!

    ---Written by Tyler Yell, Trading Instructor

    More...

Page 1 of 5 1 2 3 ... LastLast

Tags for this Thread

Bookmarks

Posting Permissions

  • You may not post new threads
  • You may not post replies
  • You may not post attachments
  • You may not edit your posts
  •