 27Likes
 LinkBack URL
 About LinkBacks
Hey to all.
The indi psylevel2.mq4 don't work. Metaeditor compiler shows CANNOT CREATE INTERFACE OF MQL COMPILER.
What can i do?
Thanks
George

This is a discussion on Psychological Levels within the Trading tools forums, part of the Trading Forum category; Hey to all. The indi psylevel2.mq4 don't work. Metaeditor compiler shows CANNOT CREATE INTERFACE OF MQL COMPILER. What can i ...


Hey to all.
The indi psylevel2.mq4 don't work. Metaeditor compiler shows CANNOT CREATE INTERFACE OF MQL COMPILER.
What can i do?
Thanks
George
It works for me (with 2 errors with MetaEditor 5 build 883) but anyway - it works for me on the chart.
Premium Trading Forum: subscription, public discussion and latest news
Trading Forum wiki || MQL5 channel for the forum
Trading blogs || My blog
Hi dnahellas,Originally Posted by dnahellas

Please check out the updated PsyLevels indicator for the new MT4(build 600 and above).
Regards,
Igor
Hi igorad.
It works, good indi.
Thanks
George
Psychological Levels
Often called "psych" levels, psychological levels occur when price ends with multiple 0's. It's human nature to gravitate towards round numbers when discussing any topic that involves numbers, Forex included.
For example, when traders talk about what they think the Euro will be worth in the future, they probably won't give an answer of 1.4278 or 1.3044. They are much more likely to round off the price to something simpler, like 1.4300 or 1.3000. The same thing happens when Forex traders place their orders. We will often see clusters of orders around these whole numbers, which creates price levels that can affect how price behaves. That's exactly what we want for our support and resistance levels.
The most common psych levels involve price having two zeros at the end (not including the 1/10th of a pip), such as 1.6400 or 102.00. More powerful than that would be psych levels ending in three zeros, such as 1.3000 or 120.00. Leaving the most powerful psych levels of all, four zeros at the end, 1.0000 or 100.00.
Premium Trading Forum: subscription, public discussion and latest news
Trading Forum wiki || MQL5 channel for the forum
Trading blogs || My blog
Hi Igorad, would it be possible to adapt your excellent indicator for use with an EA ? I tried it with iCustom-function and the indicator in EA paralyzes my entire system. And would it be possible to adapt it so that the 0.5 level displayed independently of steps?
For example:
0.000
0.200
0.500
0.800
Thnx in advance . Nod
Last edited by Nodp53; 03-23-2014 at 05:53 PM.

Talking Points:
- Price action is an extremely common tool for day-traders (scalpers) risk management approaches.
- Moving averages and psychological support and resistance can assist with entry and trade management.
Price Action
The first indicator is more than an indicator, and closer to a field-of-study within technical analysis. Because trading on short-term time frames exposes traders to the complexity of lag within a market, price action is one of the more popular ways of performing technical analysis with a short-term approach.
The reason this is so popular is because price action removes technical indicators from the equation and instead focuses on price and price alone. Price action can be used to grade trends, identify support and resistance levels, and to show traders potential entry opportunities in markets.
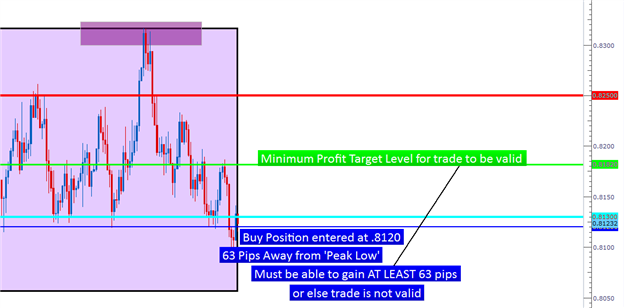
Where price action can come in as especially valuable for a short-term trader is in the realm of trade and risk and trade management. By noting price levels with which reversals or changes in market direction have taken place in the past, traders can look to place stops on positions so that if the market breaks against them (if a new low is put in while in a long position, or a new high while in a short position), the trade can be closed in an effort to mitigate the loss.
Price action can be a valuable tool for risk and trade management
If the market does trend in the direction that youre looking for, price action can also help with adjusting stops and profit-taking.
Short-term traders will often look to execute a quick break-even stop to remove their initial risk from the trade. And after prices do continue to move, traders can look at moving the stop even deeper in-the-money as the trade works in the traders favor.
Moving Averages
Another indicator thats simple to use and attempts to marginalize the lag that is ever-present with the usage of indicators, the moving average is a common chart component of short-term traders.
Moving averages are commonly used for trend diagnoses, so that if prices are above the moving average the trend is diagnosed as being up, and if prices are below the trend is considered being down. This can work phenomenally with a multiple time frame approach in which trends are being graded on a longer-term chart (like the hourly or 4-hour), and entries performed on the shorter-term chart.
Traders can also use moving averages to trigger into new positions. The moving average crossover is one of the more common ways of doing so and with this method; traders are simply looking for price to cross the moving average to initiate the position.
This strategy uses Moving Averages for trend filter and entry trigger, and price action for risk management
Support and Resistance via Psychological Whole Numbers, and Pivot Points
Have you ever been in a trade thats working out great, only to see that up-trend stop dead-in-its-tracks? And after price struggles to continue moving up, it begins to oscillate before reversing and moving down.
This is the story of support and resistance, and to short-term traders this can take on extreme importance because failure to see the bigger picture can lead to confusion and losses on the shorter-term charts.
There are numerous ways to identify support and resistance, and traders can use price action to validate any particular level; but this really only comes into play after-the-fact. Of particular interest to short-term traders are psychological whole numbers.
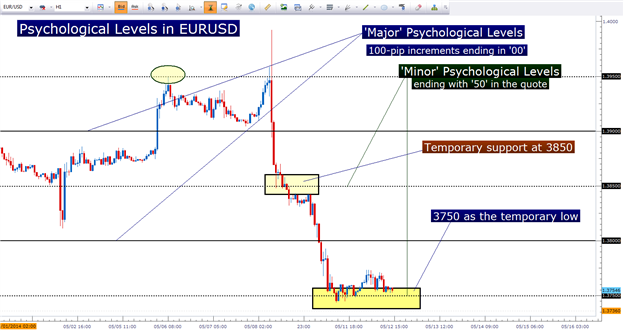
Psychological whole numbers are simply even, rounded values on the chart. As an example 1.3900, 1.3800 and 1.3700 are round whole numbers in EURUSD, as each of these prices end in 00. But we can take this a step further with the values mid-way between these three levels, 1.3850 and 1.3750 are also rounded whole numbers.
Take a look at the most recent move in EURUSD in the chart below, and notice how even in a strong-trending market the level of 1.3850 offered temporary support as the pair could not break through. Eight hours later that momentum came back in the market as the level finally yielded to selling, only to see 1.3750 come in as support shortly thereafter.
Psychological levels can have a huge bearing on price action
At this point, the pair has still failed to break below 1.3750 as support has come into the market after the most current 200+ pip run to the down-side.
Will every price ending in 50 or 00 elicit support or resistance? No. But short-term traders need to remain cognizant of the potential for support and resistance to develop at these values as trends move into new territory.
If a trend appears as though it may have run into a brick wall of support or resistance, traders can use this opportunity to scale out of a position, adjust stops, and or plan re-entries after prices finish retracing and continue moving in the trend-side direction.
--- Written by James Stanley
More...
---------
Psychological Levels
- PsyLevels_v2 indicator with template is here.
- PsyLevels_Dashboard_v1 indicator is on this post. Indicator is having the ability to watch the breakout and/or bounce levels on any number of currency pairs. Plus you can watch the candle direction on any number of time frames. The dashboard also have the popup/email alerts when the breakout/bounce direction matches with all candle directions.
- PsyLevels_v2.1 indicator is here. This version works with Metatrader 4 build 600 and above.

Talking Points:
- Psychological price levels can change trends and create swings within the market.
- Traders can combine psychological levels with other forms of Support and Resistance to find which levels may have the most potential.
- Areas of confluent support and resistance can offer entry potential for swings and new trends.
Human beings often think in round numbers and traders are no different. This means that stops and limits will often exist around these ‘rounded’ intervals on the chart, and as trends move and prices surge into these batches of waiting orders; price action can change dramatically.
Trends can be stopped dead in their tracks… and if the batch ‘sitting orders’ are large enough, a full-on reversal may be afoot.
In this article, we’re going to attempt to take this study a step further by helping traders to notice which of these levels may end up carrying more weight with future price action.
Support and Resistance Does Not Exist in a Vacuum
A common question that new traders pose is ‘which type of support or resistance should I be watching or which is most important?’
The only truthful answer to this question is that it’s impossible to know which support or resistance level may elicit a change in price behavior until it’s already happened.
But traders can attempt to see which prices may carry more power by aligning multiple permutations of support or resistance analysis, and looking for commonalities.
Let’s walk through an example together.
In EURUSD earlier this morning, selling denominated the early portion of the European session. Prices dropped from 1.3715 to 1.3650 in the first four hours of European trade.
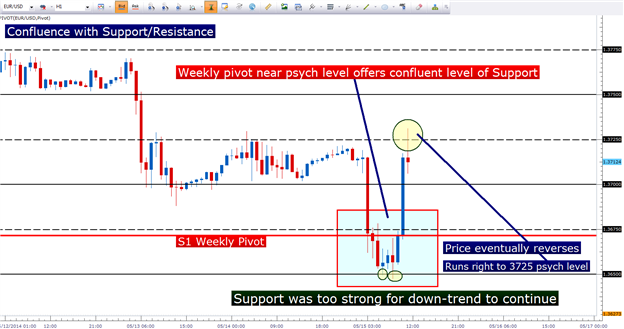
In the first hour of trade, prices moved down to the S1 weekly pivot point (the red line on the chart at a price of 1.3771), and then selling slowed. It didn’t stop, as prices still moved lower; but it did slow.
Confluence can be powerful, in both the short and long-term
Over the next 3 hours, price action grinded lower until a price of 1.3650 was hit (a minor psychological level highlighted by the first yellow circle), at which point buyers began to come in. Notice how price action oscillated between the psych level, and the S1 Pivot for four hours, even attempting to move lower but reversing yet again at 3650 (second yellow circle).
After the second attempt at breaking 1.3650, sellers retreated and buyers took over, as prices then began moving higher, eventually catching resistance at the psychological level of 1.3725 (third yellow circle).
This is confluence; and while the S1 weekly pivot point wasn’t enough to turn around prices, the combined force of the S1 pivot along with a psychological support/resistance level at 1.3650 certainly was. This is why traders want to use multiple forms of support and resistance identification, because you never know which one (or which combination) will impact prices until after it’s happened.
Why/How does confluence work?
The bigger question to ask is why technical analysis might work?
The logic behind technical analysis is that if enough people are seeing something, and thus reacting to those stimuli, it can potentially become a self-fulfilling prophecy.
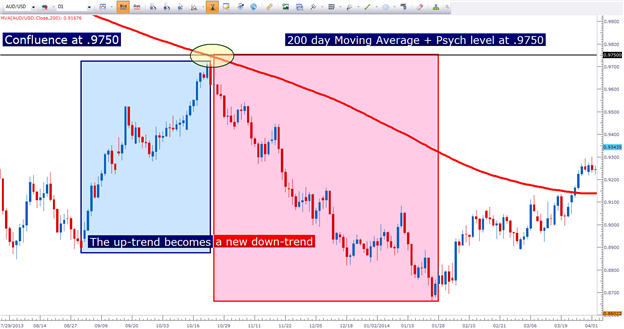
Take the 200-day moving average as an example. If every trader in the world were watching AUDUSD trade up to the 200-day moving average; and if enough traders sell under the premise that resistance may come in – that can change the supply and demand in that market, and that can create a reversal in price (more buying than selling means prices will move up). In the example below, we can see how the confluent level of .9750 in AUDUSD promulgated a strong reversal in the trend.
Confluence can exist between indicators and psychological levels
Support and resistance levels are no different. As prices approach these levels, traders observe the potential for a reversal.
And when multiple support or resistance levels exist in the same region or area, this is called ‘confluence,’ and this confluence of support or resistance can offer traders multiple reasons for prices to reverse or stall; making potential trade ideas for swings or reversals even stronger than they might be otherwise.
How to Find Confluent Levels of Support and Resistance
Just as we said in the earlier portion of this article, traders are best served by following and observing multiple forms of support and resistance analysis.
Price action can be used to validate which levels have been valuable, as traders can notice swings in prices or reactions in markets to see which price levels have elicited new behaviors.
But traders can attempt to see which levels may offer a higher chance of exhibiting support or resistance in the future by applying multiple studies.
Longer-term pivot points (weekly and monthly) will usually generate considerable interest, and the same can be said for Fibonacci retracement levels within longer-term trends.
Traders can apply these on the longer-term charts as I had in the EURUSD example, while following the more granular psychological support and resistance levels on the longer-term charts.
Traders can also look to indicators, as we had in the AUDUSD example with the 200-day moving average. Parabolic SAR, Volatility bands, or Price Channels can all be applied to the chart in the trader’s search for confluent levels of support or resistance.
How to Trade Support and Resistance Confluence
So support and resistance confluence can show us areas where reversals or swings may take place, but what’s next?
Traders should keep in mind that there is no form of analysis that will predict future price movements. If there were, there would be no reason for me to write this article, or for you to read it. Trading would be easy because we could follow this ‘holy grail’ all the way to the promise land. Unfortunately, the future is and will remain unpredictable.
Instead, trading is about probabilities. And seeing an up-trend stall at resistance, or a down-trend pause during support simply shows us an area where a reversal in price may take place.
As price action signals potential reversals, traders can look at this as an opportunity for a potential trade entry with a positive risk reward ratio. As in, if you’re right – you can look to make $2 for every $1 that you’re risking in the event that you’re wrong. This is the effort to avoid the Top Trading Mistake, or The Number One Mistake that Forex Traders Make.
Traders can use price action to signal entries after integrating Support and/or Resistance
You can use this in combination with multiple time frame analysis to trade retracements in ‘major’ trends on longer-term charts; or you can even include additional indicators such as I do in my short-term momentum trading strategy.
The possibilities are endless; but provided traders are focusing on risk management and risk-efficient entries, there are numerous ways that support and resistance confluence can beneficially be integrated into a trader’s approach.
--- Written by James Stanley
More...


I have been trading and posting about psychological levels for years...
IT'S NOT WHAT YOU TRADE, IT'S HOW YOU TRADE IT!
You're on the internet a (google) search will find it. https://www.kreslik.com
https://www.youtube.com/user/TheRump...?query=trading

I see you guys are posting my code here...
It is better that traders get the code where I post it so they know where to look for updates and fixes!!
IT'S NOT WHAT YOU TRADE, IT'S HOW YOU TRADE IT!
You're on the internet a (google) search will find it. https://www.kreslik.com
https://www.youtube.com/user/TheRump...?query=trading
 Posting Permissions


 Reply With Quote


Bookmarks