
 LinkBack URL
 About LinkBacks


Talking Points:
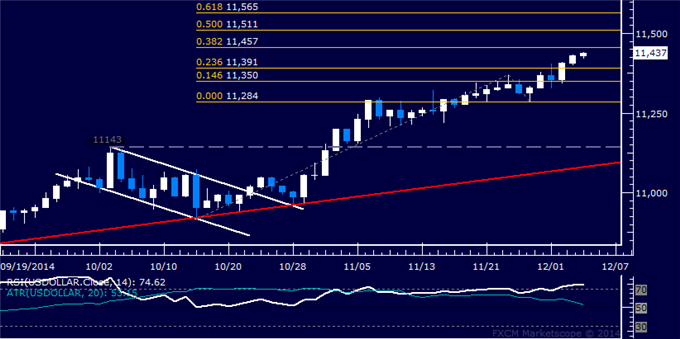
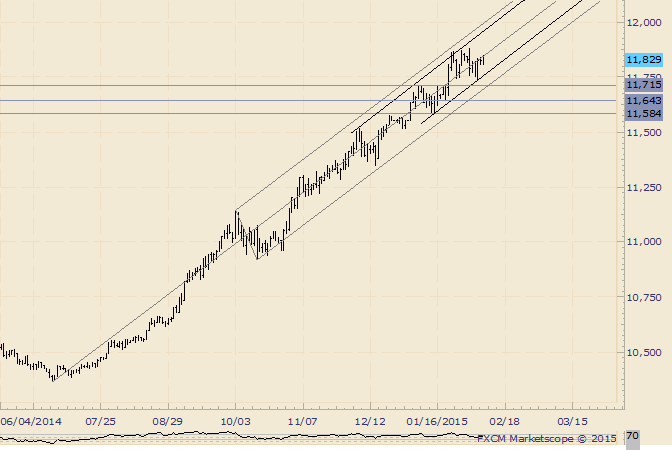
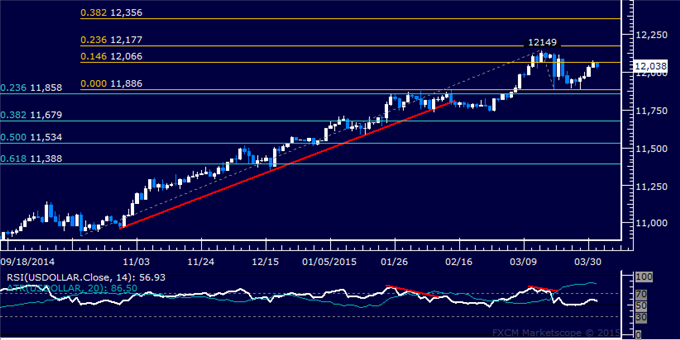
- Support: 11391, 11350, 11284
- Resistance:11457, 11511, 11565
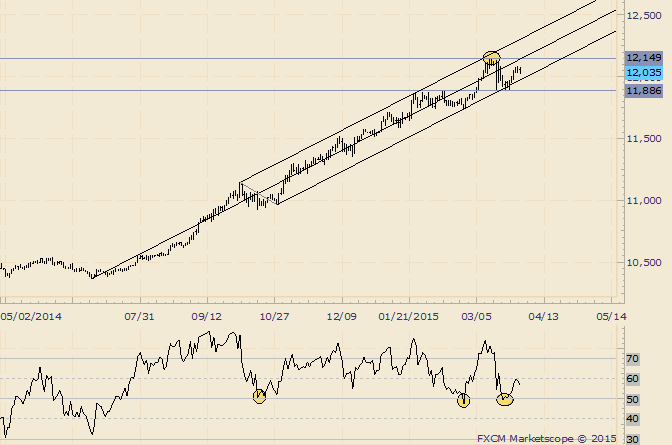
The Dow Jones FXCM US Dollar Indexcontinues to push upward, rising to levels not seen since April 2009. Near-term resistance is at 11457, the 38.2% Fibonacci expansion, with a break above that on a daily closing basis exposing the 50% level at 11511. Alternatively, a turn below the 23.6% Fib at 11391 opens the door for a challenge of the 14.6% expansion at 11350.
--- Written by Ilya Spivak, Currency Strategist for DailyFX.com
More...


 Reply With Quote


Bookmarks