Page 1 of 15 1 2 3 11 ... LastLast
Results 1 to 10 of 144

EUR Technical Analysis

This is a discussion on EUR Technical Analysis within the Forex Trading forums, part of the Trading Forum category; An "Audacious" Long Set-up in EUR/GBP Talking Points: Possible End of a Six-Month Elliott Structure The Case for an Impulsive ...


  1. #1
    member TechnoMeter's Avatar
    Join Date
    Apr 2013
    Posts
    1,636
    Blog Entries
    421

    EUR Technical Analysis

    An "Audacious" Long Set-up in EUR/GBP

    Talking Points:

    • Possible End of a Six-Month Elliott Structure
    • The Case for an Impulsive EUR/GBP Upside Move
    • Step-by-Step Parameters for Taking This Trade


    While EURGBP isn’t a pair we typically enjoy trading, sometimes a structure is presented that’s just too hard to ignore. Today, we see a potential trade that’s based on analysis from both the daily and hourly time frames. Together, they provide an opportunity to try to buy a “bottom,” which is, admittedly, a perennially dangerous task in itself.

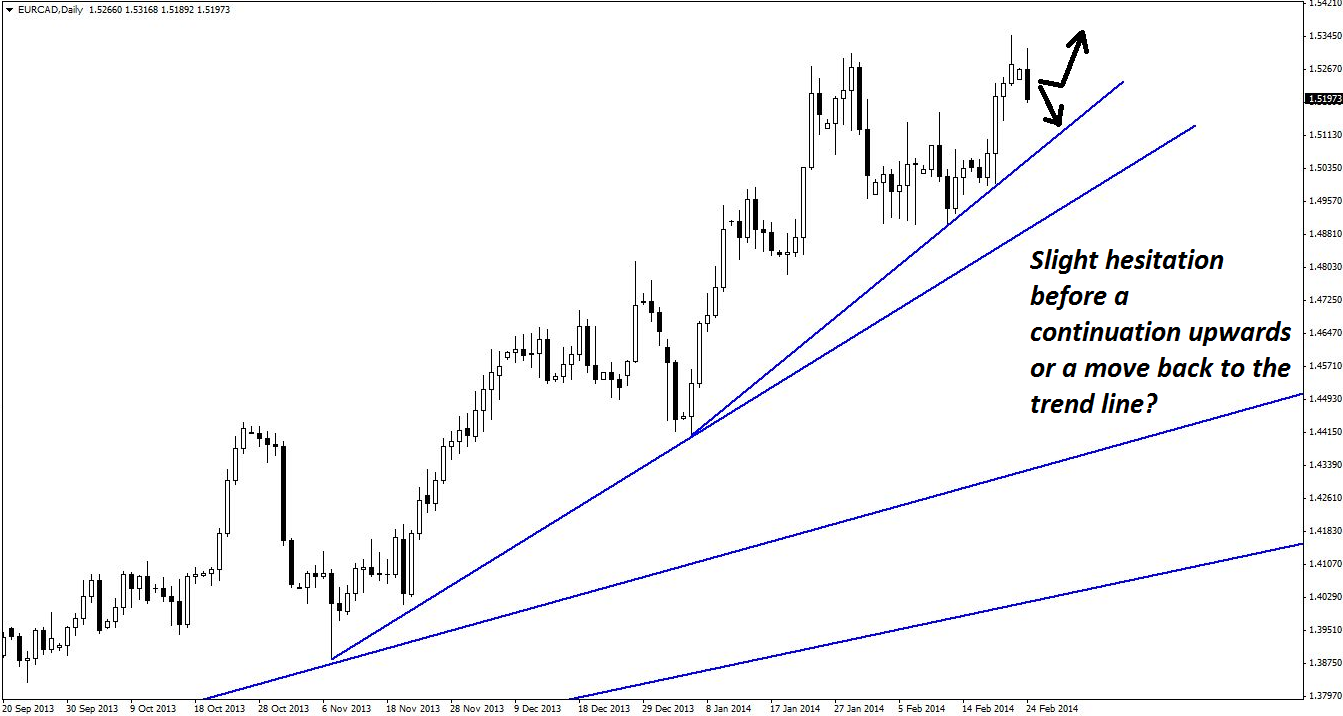
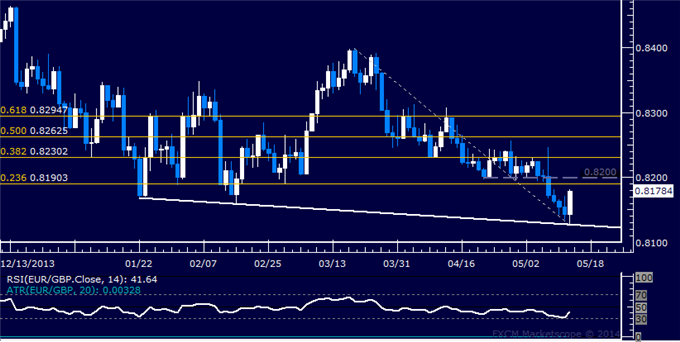
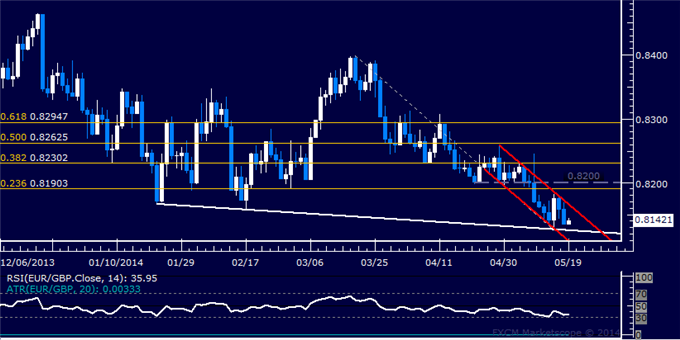
    The below daily chart of EURGBP shows our Elliott wave count starting in August 2013 and extending into late January. It’s an Elliott Wave diagonal, a five-wave structure where all five legs comprise three waves each. By definition, it makes progress in an overlapping manner. Here, the fourth leg must move back into the area of the second leg. This makes it different from the more common motive structure called an impulse, whose fourth wave cannot (in theory) intrude into the area of the second wave.

    Guest Commentary: Diagonal Pattern on EUR/GBP Daily Chart


    While the overlapping requirement makes it different from an impulse, there’s an important attribute that both types of motive waves share: the third wave must never be the shortest of waves one, three, and five. By itself, that’s a key component that makes the structure very tradable.

    In this case, the first wave was 437 pips and the third wave was 333 pips. This rule means that the fifth wave cannot be 333 pips or larger because that would make the third wave the shortest of waves one, three, and five. With that, the fifth leg needed to stay above 0.8130.

    Though many traders will trade in the opposite direction to the fifth leg as it approaches a level like 0.8130 (in this case, EURGBP reached a low of 0.8167) and place their stop a little behind 0.8130. We chose to wait, however.

    There are two other attributes of Elliott wave diagonals that give us greater confidence that we’ve labelled this structure correctly:

    • In many cases, the fourth wave pulls back 61.8% of the third wave, and this occurred (see 4 vs. 3 Fibonacci ratio).
    • Another common trait among diagonals is that they change direction quite sharply. While this hasn’t happened yet, we may see a sharp move higher and away from the 0.82 level over the next few weeks.


    Therefore, factoring these traits in as well, we’re keen to try to buy a possible bottom while price is still in this area.

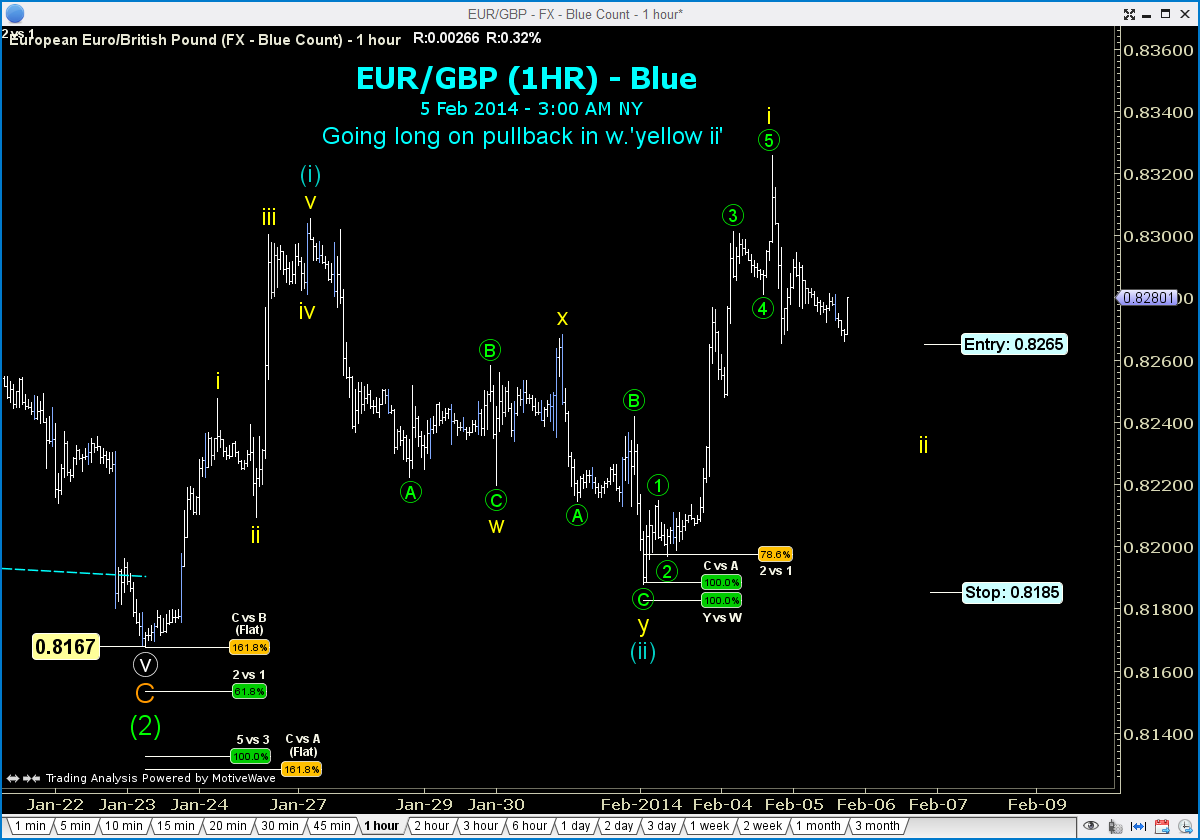
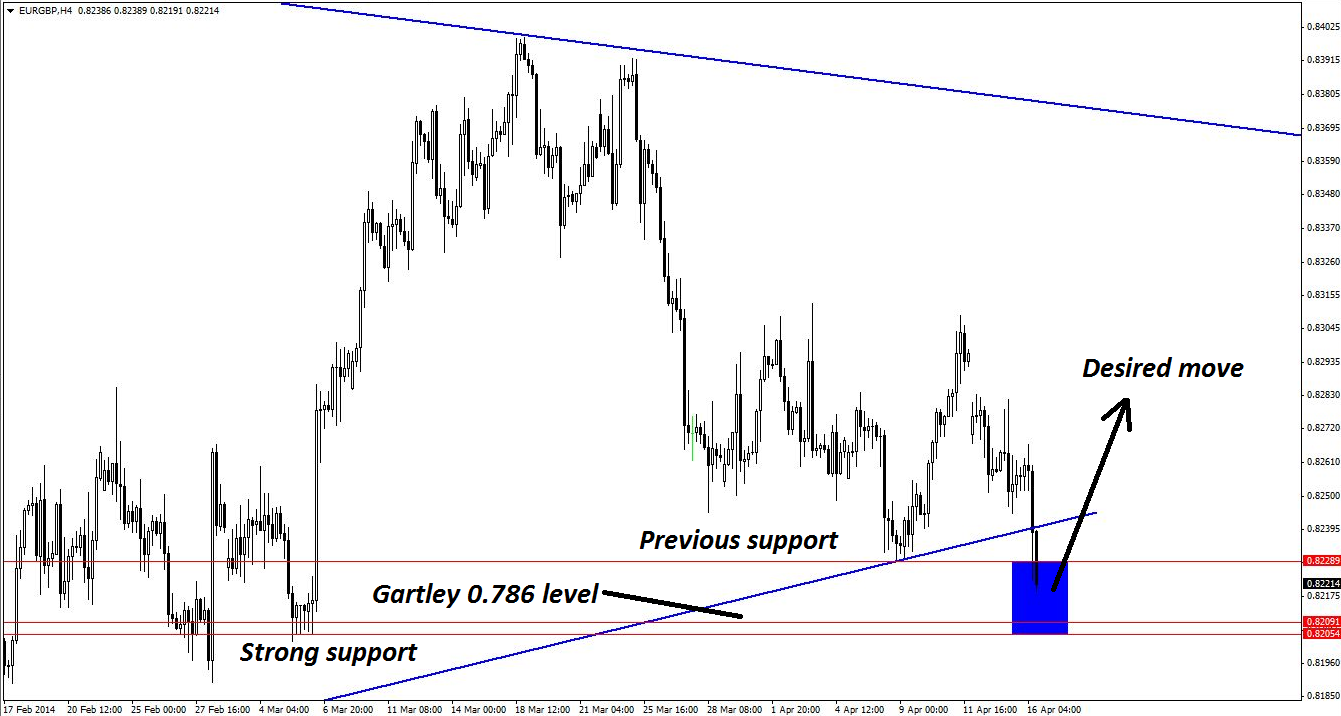
    As mentioned, we chose to wait instead of buying EURGBP as it approached 0.8130 because we wanted to see if there was any evidence of an impulsive move to the upside. And, to that point, the hourly chart below shows a sharp, five-wave impulsive move higher (see blue wave (i)) followed by what seems to be a comparatively prolonged WXY zig-zag correction (see blue wave (ii)).

    Price recently tested the 78.6% retracement of the impulsive move higher (sometimes called “the last line in the sand”). The low of the correction was near the WXY equality level (see Fib Y vs. W: 100%) and also perfectly aligned the smaller-degree ABC zig-zag equality level. In light of this, the decision to wait and analyze more price action now gives greater confidence when placing a trade.

    Guest Commentary: The Case for a Bottom in EUR/GBP


    While we could have traded late in the blue wave (ii) pullback, we waited once more for an impulsive rise. That occurred in the form of yellow wave i, and we’re now going to buy the pair during the yellow wave ii pullback.

    Therefore, the trade is to buy EURGBP at 0.8265 (or lower), placing a stop at the low of blue wave ii (0.8185). For this 80-pip stop, we’re not setting a target at this time, but we’re potentially looking at hundreds of pips, and as a result, this trade will take many weeks to complete.

    The risk profile is very good, but there is real risk in this trade. EURGBP has fallen 600 pips over the last six months, and it takes some audacity to try to call a bottom. If price continues higher, though, we will look to add to this in time.

    Long Set-up for EUR/GBP

    • Trade: Buy EURGBP at 0.8265 (or lower)
    • Stop Loss: Place stop at 0.8185
    • Target: Open (for reasons discussed above)


    More...

  2. #2
    member TechnoMeter's Avatar
    Join Date
    Apr 2013
    Posts
    1,636
    Blog Entries
    421

    EURJPY Technical Analysis

    EURJPY Technical Analysis

    Talking Points:

    • EUR/JPY Technical Strategy: Flat
    • Support: 138.06 (23.6% Fib ret.), 136.68 (50% Fib ret.)
    • Resistance: 140.29 (Feb 11 high)


    The Euro may be readying to turn lower against the Japanese Yen, with prices showing a Bearish Engulfing candle setup and hinting at weakness ahead. Near-term support is at 138.06, the 23.6% Fibonacci expansion, with a break below that targeting the 38.2% level at 136.68. Resistance is at 140.29, the February 11 high.
    A short position targeting 138.06 with a stop on a daily close above 140.29 is acceptable from a risk/reward perspective. We will opt to pass on the setup however. EUR/JPY is displaying a strong correlation with the S&P 500 (0.77 on 20-day percent change studies), pointing to a strong sensitivity to risk appetite trends. The benchmark stock index is in the midst of its strongest push higher in seven months and fighting that momentum seems ill-advised.


    --- Written by Ilya Spivak, Currency Strategist for DailyFX.com


    More...

  3. #3
    member TechnoMeter's Avatar
    Join Date
    Apr 2013
    Posts
    1,636
    Blog Entries
    421

    EURCAD Technical Analysis

    A Textbook Buying Opportunity in EUR/CAD

    Talking Points:

    • Prolonged Weekly Uptrend in EUR/CAD
    • Consolidation Before a New Push Higher
    • Key Support Zone for Buying EUR/CAD


    This week is starting out with a potential opportunity to hop onto the uptrend in EURCAD, which has been going on for a quite a long time.
    Of course, the question always exists as to whether or not a trend is coming to an end, but ultimately, no one can be absolutely certain until it has happened. As a result, continuing to buy dips in an uptrend is the most prudent move.

    Guest Commentary: Accelerating Weekly Uptrend in EUR/CAD


    The daily chart below is exhibiting a set-up that not all traders would consider taking, but it constitutes what might be a slight hesitation before an upward move. Of course, this could just as easily be the beginning of a deeper pullback, which is why lower time frames are used in order to obtain a more precise entry and counteract this risk.

    Guest Commentary: Key Decision Point for EUR/CAD


    As this is a mere hesitation, it is not surprising that there are no rising lines of support on the below four-hour chart. However, there is plenty of evidence that price may be approaching a zone of support. Previous horizontal turning points indicate rigorous interaction between bulls and bears in the blue shaded zone. Ideally, price should bounce off this level to continue its upward journey.

    Guest Commentary: Key Support Zone for Buying EUR/CAD


    The key support zone has been identified as 1.5150-1.5196. This zone is a mere 46 pips in depth, as compared with the potential for a move of 140 pips or more just to retest the recent high. Thus, the risk profile is adequate, but the hourly chart (not shown) should be used as the trigger time frame for this trade.

    On the hourly time frame, acceptable triggers would consist of bullish reversal divergence, bullish engulfing patterns, and/or pin bars.
    Two or three tries may be needed to get onto this move, however, it is also worth noting that price may completely disregard support and form a deeper pullback, heading back towards the rising line of support instead. In that case, it is necessary to limit losses as much as possible, so no more than three tries should be made, as there will always be another support zone to consider.

    By Kaye Lee, private fund trader and head trader consultant, StraightTalkTrading.com


    More...

  4. #4
    member TechnoMeter's Avatar
    Join Date
    Apr 2013
    Posts
    1,636
    Blog Entries
    421

    Forex: EUR/JPY Technical Analysis

    Talking Points:

    • EUR/JPY Technical Strategy: Flat
    • Support: 139.97 (23.6% Fib exp.), 139.24 (horizontal pivot)
    • Resistance: 140.71 (38.2% Fib exp.), 141.30 (50% Fib exp.)


    The Euro is on pace to erase yesterday’s would-be breakdown against the Japanese Yen. Prices are aiming to challenge the 38.2% Fibonacci expansion at 140.71, with a break above that exposing the 50% level at 141.30. Alternatively, a turn back below the 23.6% Fib at 139.97 opens the door for another test of horizontal shelf support at 139.24.
    Prices are too close to relevant resistance to justify a long position on risk/reward grounds. On the other hand, a short trade assuming resistance will hold is premature absent a defined reversal signal. We will continue to stand aside for now.


    --- Written by Ilya Spivak, Currency Strategist for DailyFX.com


    More...

  5. #5
    Junior Member bamn7's Avatar
    Join Date
    Dec 2013
    Posts
    6
    I see the EURJPY pair in a retracement back to a weak support level @138.939. I will watch the price action at this level to determine if there will be a continuation of my long position. If price breaks through 143.375 I look to go long to 144.708.


    EUR Technical Analysis-eurjpy-3_9_2014.png
    Last edited by bamn7; 03-09-2014 at 08:10 PM.

  6. #6
    member TechnoMeter's Avatar
    Join Date
    Apr 2013
    Posts
    1,636
    Blog Entries
    421

    An Ultra-Nimble EUR/CAD Scalp Trade

    Talking Points:

    • Established Uptrend on EUR/CAD Weekly Chart
    • A One-Candle Daily Pullback That Poses Problems
    • The Ideal Time Frame for Buying EUR/CAD


    EURCAD is currently in one of those situations where a long trade would be perfectly justified, but yet for certain reasons, it may be premature as well.

    As shown below, the weekly chart is in a clear uptrend. In fact, it has been accelerating upwards to boot. Some traders may argue that the current week's candle is threatening to become a pin, but it is far too early in the week to tell that for certain. As a result, it is best to proceed on the assumption that the established uptrend will continue.

    Guest Commentary: EUR/CAD in Strong Weekly Uptrend


    The daily chart below is actually where the main worry for this long trade lies. Thus far, the pullback has only been one day long, and while this can certainly happen in a strong uptrend (there are prior examples of this even on the chart itself), a pullback of three or four candles is very much preferred.

    Guest Commentary: Possible One-Candle Pullback in EUR/CAD


    Because of the one-candle nature of the pullback on the daily chart, a nimbler trade might be required in order to manage this set-up more efficiently, and for this reason, we drop down to the four-hour chart below. Here, we readily see previous levels of support and resistance from which we can determine a zone where price would be expected to bounce.

    Guest Commentary: Nearby Support Zone for Buying EUR/CAD


    Again, though, because of the doubts that arise on the daily chart, a trade initiated on the smaller time frames is preferred, both in order to obtain greater precision, and to provide ample opportunity to scalp part of the position out, if necessary.

    As such, the hourly chart below shows a pullback scenario that is much clearer, and as a result, is much preferred as well. The final support zone is 1.5244-1.5377, which represents a risk of only 33 pips. That is extremely small when considering the prospects for a trend continuation on the daily chart.

    Guest Commentary: Narrow Risk Zone on EUR/CAD Hourly Chart


    Nonetheless, in the interest of nimbleness and risk, the trigger is best taken on the 15-minute chart (not shown), where traders can keep their eyes out for pin bars, bullish engulfing patterns, and/or bullish reversal divergence as potential long-entry signals.

    As always, two or three attempts may be required before price formally turns up. Traders would also be advised to enter using multiple positions so that they will have the option of scaling out should price action turn hostile following the entry.

    By Kaye Lee, private fund trader and head trader consultant, StraightTalkTrading.com


    More...

  7. #7
    member TechnoMeter's Avatar
    Join Date
    Apr 2013
    Posts
    1,636
    Blog Entries
    421

    EUR Technical Analysis

    6 Veritable Short Signals for EUR/AUD

    Talking Points:

    • A Preferred Lineup of Indicators
    • Strong Case for Upcoming EUR/AUD Weakness
    • 6 Technical and Fundamental Factors to Consider


    I’m often asked by retail traders how I go about setting up my chart and which indicators I use. Obviously, there are a seemingly infinite number of choices and variations there, and in the end, there is no one “right” way to do it, however, I prefer to trade using:

    • A very short-term moving average (Hull)
    • 20-day moving average (MA)
    • 100-day MA
    • Bollinger bands
    • Commodity Channel Index (CCI)
    • Moving Average Convergence Divergence (MACD)
    • Support, resistance, and trend lines
    • Parabolic SAR (sometimes), which is used to ascertain stop losses


    Using these indicators to facilitate analysis, it appears that EURAUD represents a great short opportunity right now. The underlying fundamentals, as well as several technical signals on the daily chart below, all indicate the potential start of a new downtrend.

    Guest Commentary: Technical Case for a New Downtrend in EUR/AUD


    The following are all factors that support the case for upcoming EURAUD weakness:

    • MACD has recently shown declining upward momentum and is now suggests increasing downward momentum. The histogram is showing a new move into bearish territory
    • CCI has confirmed price falling into sell territory and has done so with conviction
    • Bollinger band is tight with a new break downwards. Constricting bands indicate a possible spike in either direction
    • The end of head and shoulders pattern is evident on the chart
    • The 20-day MA is starting to fall with price moving below the line, potentially indicating the start of a long-term downtrend
    • The Australian dollar (AUD) has benefited from capital flight from China and comparatively higher interest rates. Risk appetite for more diverse currencies is increasing as well

    By Josh Brown, Director and Fund Manager, The Alpha Generator


    More...

  8. #8
    member TechnoMeter's Avatar
    Join Date
    Apr 2013
    Posts
    1,636
    Blog Entries
    421

    A EUR/GBP Set-up with Confluent Long Signals

    Talking Points:

    • Potential False Breakout for EUR/GBP
    • Gartley Pattern Completing on Daily Chart
    • Structuring a Trade with "Exceptionally" Low Risk


    As many major currencies continue to fluctuate within consolidating patterns, EURGBP seems to be presenting quite an interesting technical trade set-up.

    The daily chart below shows a triangle breakout within a consolidation zone. At this daily level of analysis, however, the trend direction is not at all clear, and it might be fairest to call it sideways. However, interested traders may look to the weekly chart (not shown) to discover that generally bullish momentum holds true for EURGBP.

    Guest Commentary: Daily Triangle Breakout in EUR/GBP


    In a sideways market, prices are always more prone to being whipsawed, but the presence of a secondary price pattern makes this particular set-up even more interesting. Here, that comes in the form of the Gartley pattern that is now beginning to complete on the below daily chart. The first pullback respected the 61.8% retracement of the original move, and should the next leg react at the 78.6% retracement, as a standard Gartley pattern would anticipate, the resulting move would be bullish.

    Guest Commentary: Gartley Pattern Completing in EUR/GBP


    A decent move upwards to test the Gartley high could contain 180 pips or more, which is quite significant for this slow-moving pair, and that makes it all the more possible for traders of all risk appetites to structure trades with appropriate risk profile.

    The four-hour chart below readily provides a zone of support around the anticipated 78.6% Gartley reaction level, as indicated. The zone turns out to be 0.8205-0.8228, which is an exceptionally small 23 pips. More aggressive traders could simply initiate a long trade with a stop past the support zone and a stop loss of 30 pips, but it would be most preferable to wait for a trade trigger to occur on the hourly chart (not shown).

    Guest Commentary: Key Support Zone for Buying EUR/GBP


    Viable trade triggers would consist of pin bars, bullish reversal divergence, and/or bullish engulfing patterns on the hourly chart. Even though two or three attempts may be required to hop on to this move, the very favorable risk profile makes this trade highly worthwhile.

    The slow-moving nature of EURGBP can often test a trader's patience, but nonetheless, it is quite nice to see a confluence of a trend line breakout and a Gartley pattern. Afterall, the most rewarding trades often occur on the heels of such false breakouts when traders are properly positioned to trade the long side, in this case.

    By Kaye Lee, private fund trader and head trader consultant, StraightTalkTrading.com


    More...

  9. #9
    member TechnoMeter's Avatar
    Join Date
    Apr 2013
    Posts
    1,636
    Blog Entries
    421

    EUR/GBP Technical Analysis

    Talking Points:

    • EUR/GBP Technical Strategy: Flat
    • Support: 0.8127 (falling trend line)
    • Resistance:0.8190 (23.6% Fib ret.), 0.8200, 0.8230 (38.2% Fib ret.)

    The Euro launched a recovery against the British Pound after finding support at a falling trend line connecting major swing lows since late January. Near-term resistance is in the 0.8190-0.8200 area, marked by the 23.6% Fibonacci retracement and reinforced by the formerly broken range floor. A break above that on daily closing basis exposes the 38.2% level at 0.8230. Trend line support is now at 0.8127.

    Prices are too close to relevant resistance to justify a long position from a risk/reward perspective. On the other hand, the absence of a defined bearish reversal signal warns against taking up the short side. With that in mind, we will continue to wait on the sidelines for the time being.


    --- Written by Ilya Spivak, Currency Strategist for DailyFX.com

    More...

  10. #10
    member TechnoMeter's Avatar
    Join Date
    Apr 2013
    Posts
    1,636
    Blog Entries
    421

    EUR/GBP Technical Analysis

    Talking Points:

    • EUR/GBP Technical Strategy: Flat
    • Support: 0.8125 (falling trend line), 0.8109 (channel floor)
    • Resistance:0.8166 (channel top), 0.8190-0.8200 (23.6% Fib ret., range floor)


    A brief Euro recovery has been overturned, with the British Pound securing its strongest close in 16 months against the single currency. Support lines up 0.8125, marked by a falling trend line set from late January, with a break below that exposing the bottom of a falling channel at 0.8109. Alternatively, reversing a daily close above the channel top at 0.8166 clears the way for a challenge of the 0.8190-0.8200 area, marked by the 23.6% Fibonacci retracement and a recently broken range floor.

    Indecisive positioning argues against taking a trade on either the long or the short side for the time being. We will remain on the sidelines, waiting for a more actionable opportunity to present itself.


    --- Written by Ilya Spivak, Currency Strategist for DailyFX.com


    More...

Page 1 of 15 1 2 3 11 ... LastLast

Tags for this Thread

Bookmarks

Posting Permissions

  • You may not post new threads
  • You may not post replies
  • You may not post attachments
  • You may not edit your posts
  •