
 LinkBack URL
 About LinkBacks


Talking Points:
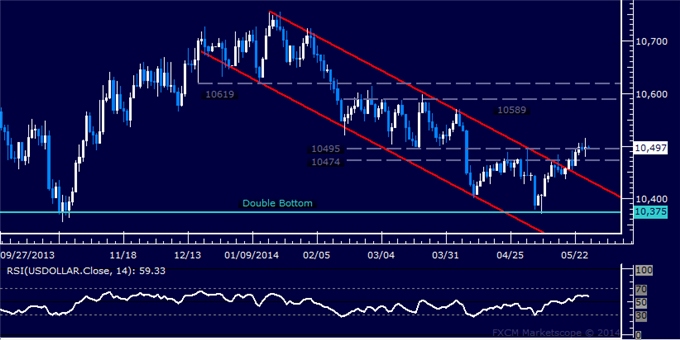
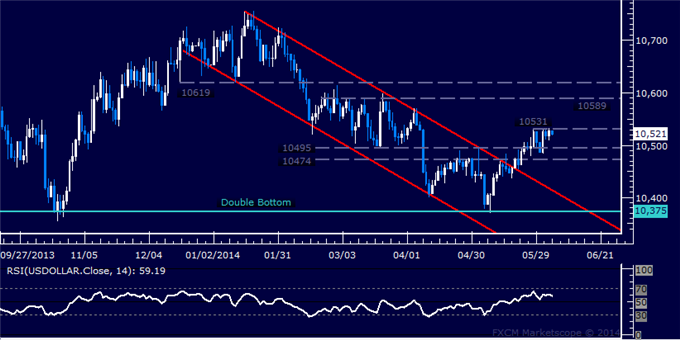
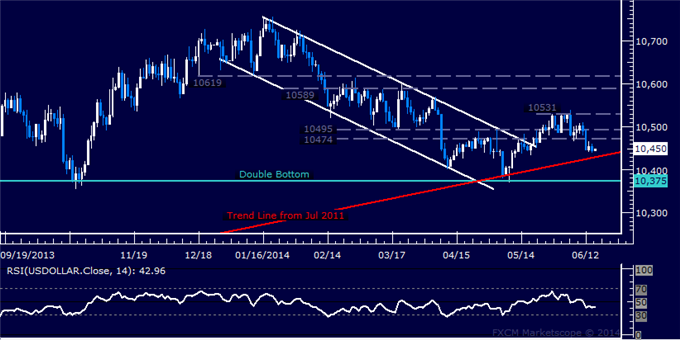
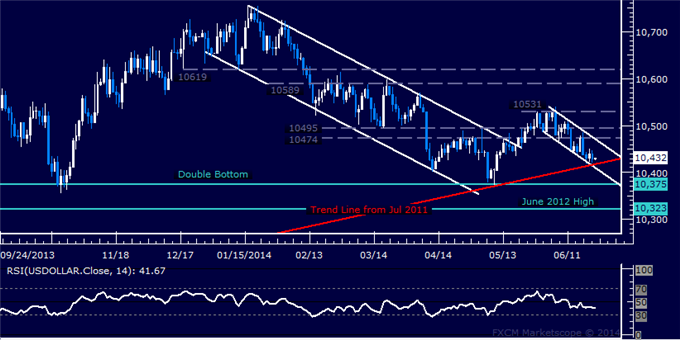
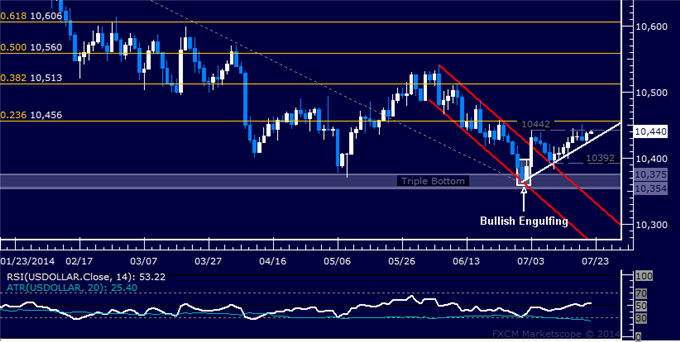
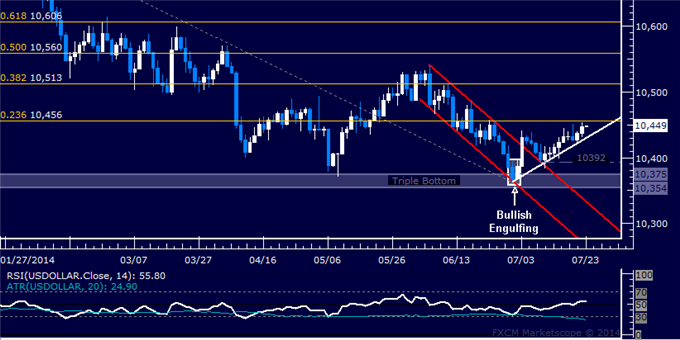
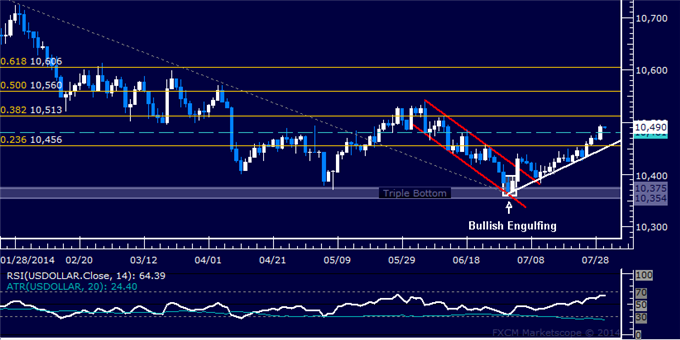
- Support: 10474-95, 104434 (channel top)
- Resistance:10589-619
The Dow Jones FXCM US Dollar Index looks poised to continue higher having set a critical double bottom at 10375, the October 2013 floor. An upward trend change signaled by a break above resistance at the top of a falling channel set from January saw follow-through with a break of resistance in the 10474-95 area. The bulls now aim to challenge the 10589-619 region, with a move above that opening the door for an advance to year-to-date highs. Alternatively, a reversal back below 10474 eyes channel top support-turned-resistance at 10434.
--- Written by Ilya Spivak, Currency Strategist for DailyFX.com
More...


 Reply With Quote


 Daily ---
Bookmarks