
 7Likes
 LinkBack URL
 About LinkBacks


Talking Points:
- US Dollar Moves to Challenge Monthly Range Support
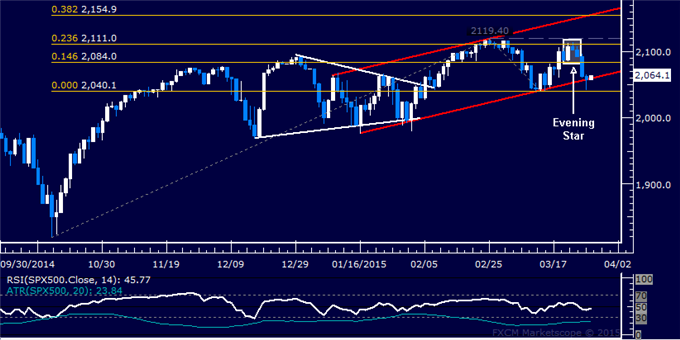
- S&P 500 Pauses After Rising to Another Record High
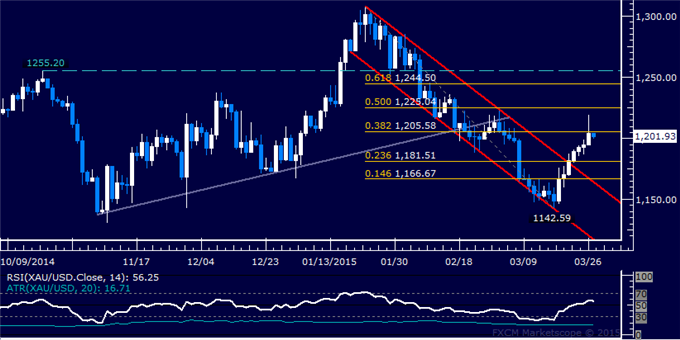
- Gold Stalls at Support, Crude Oil Recovery Finds Fuel
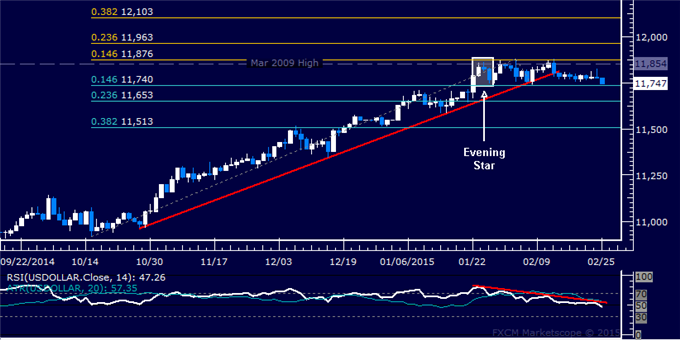
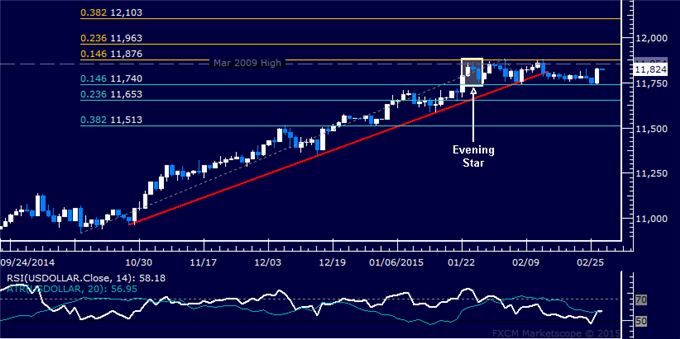
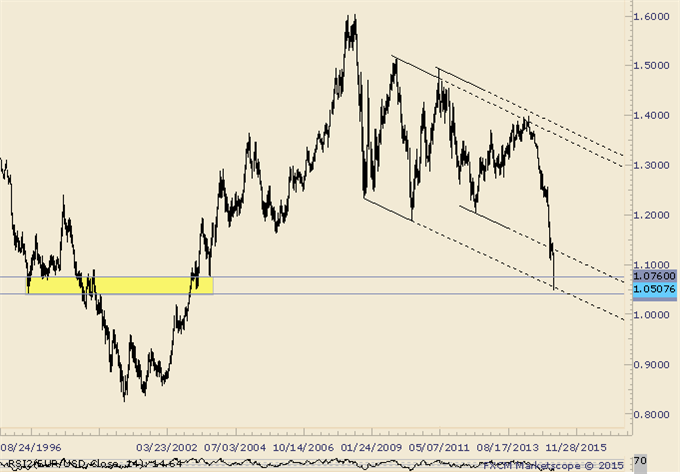
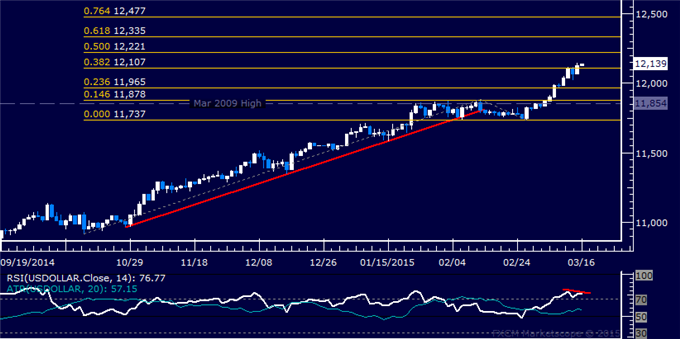
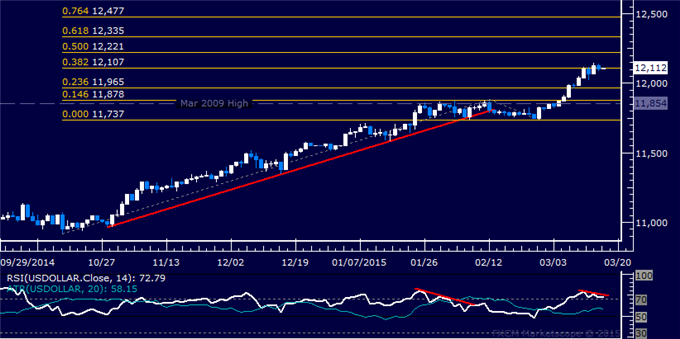
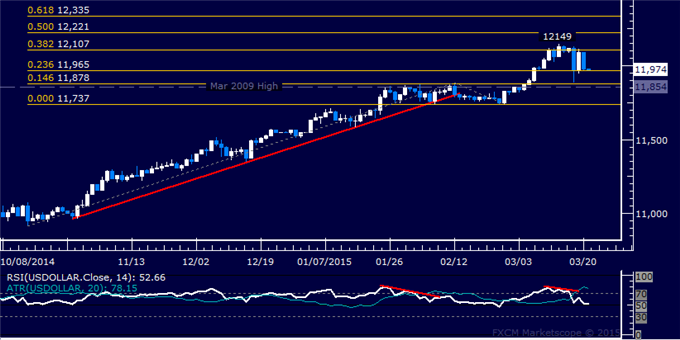
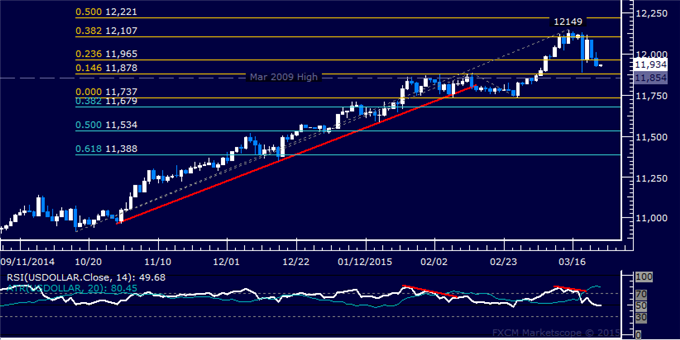
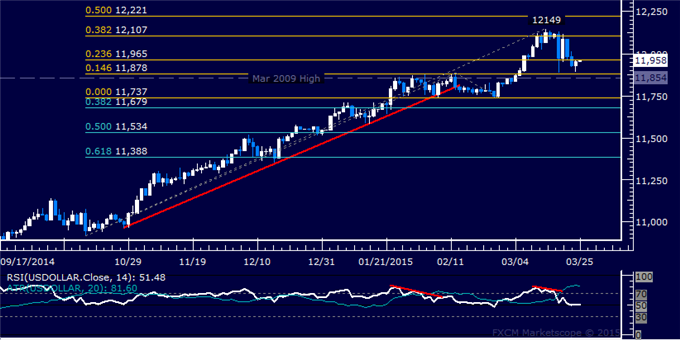
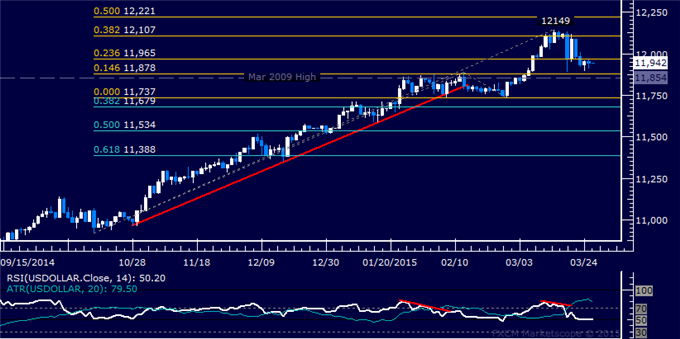
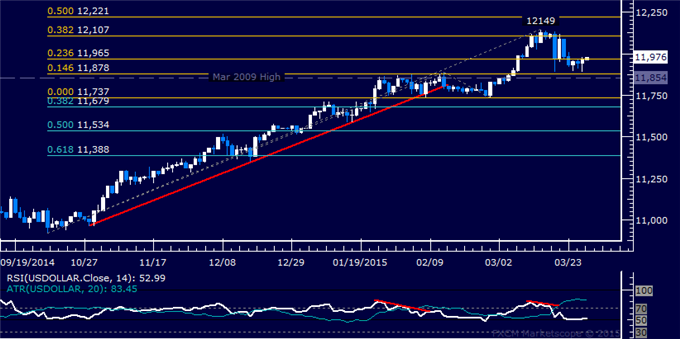
US DOLLAR TECHNICAL ANALYSIS – Prices look to be reversing downward as expected after putting in a bearish Evening Star candlestick pattern. A daily close below the 14.6% Fibonacci retracementat 11740 exposes the 23.6% level at 11653. Alternatively, a turn above the 11854-76 zone (14.6% Fib expansion, March 2009 high) clears the way for a test of the 23.6% expansion at 11963.
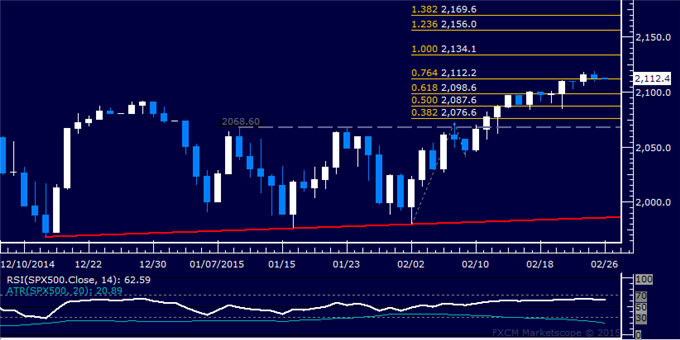
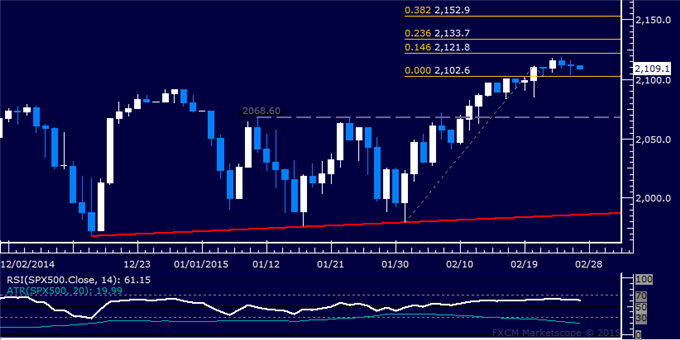
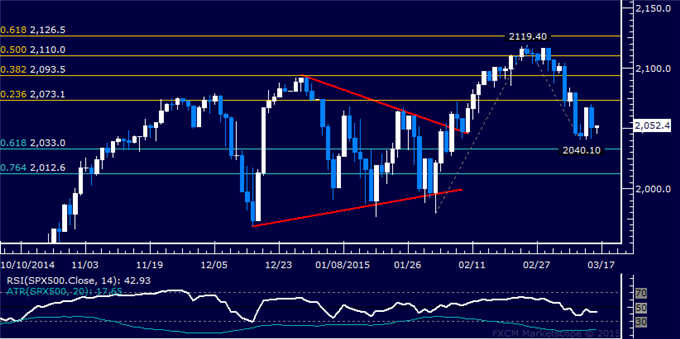
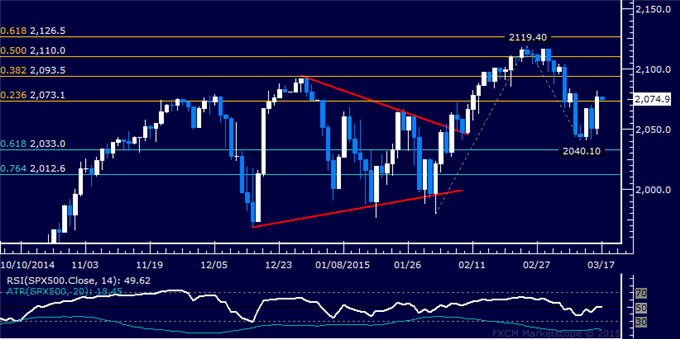
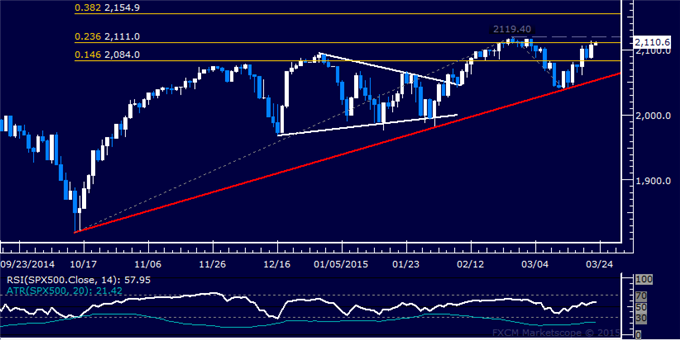
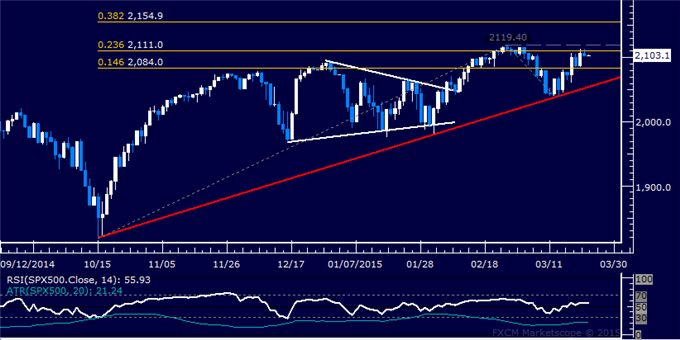
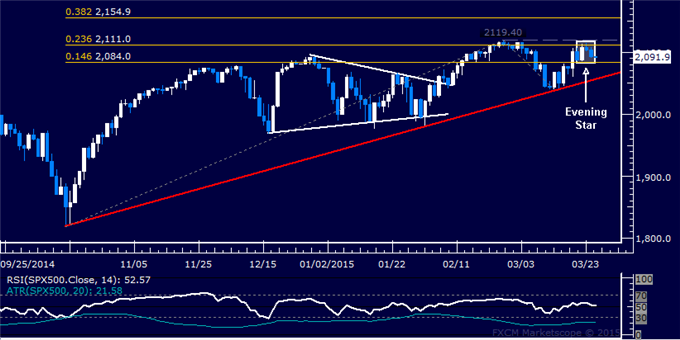
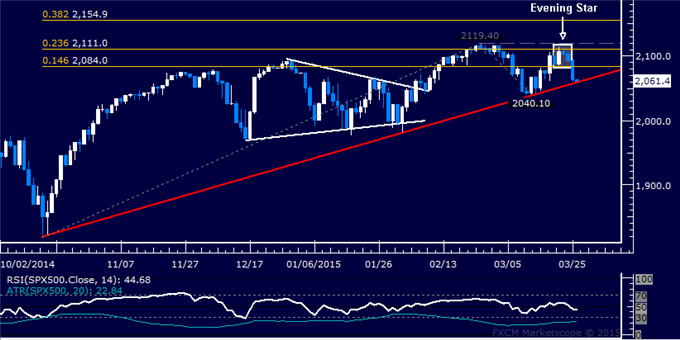
S&P 500 TECHNICAL ANALYSIS – Prices paused to digest gains after advancing to yet another record high. A daily close above the 100% Fibonacci expansion at 2134.10 exposes the 123.6% level at 2156.00. Alternatively, a reversal below the 76.4% Fib at 2112.20 targets the 61.8% expansion at 2098.60.
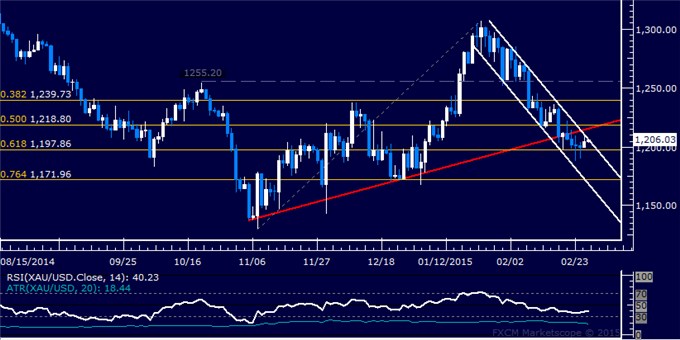
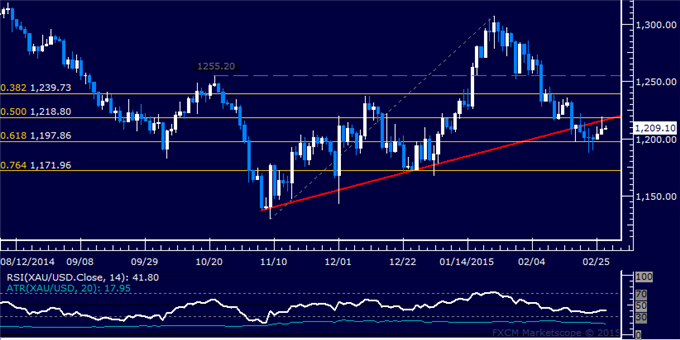
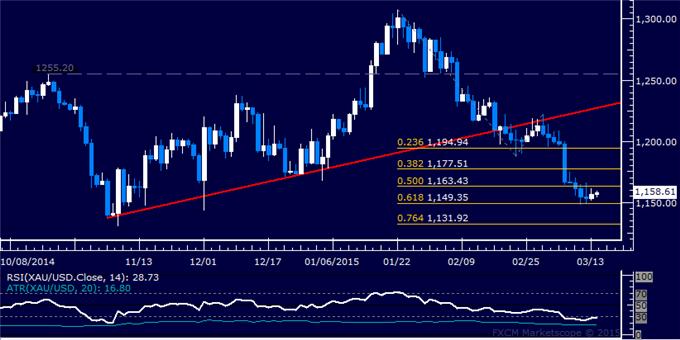
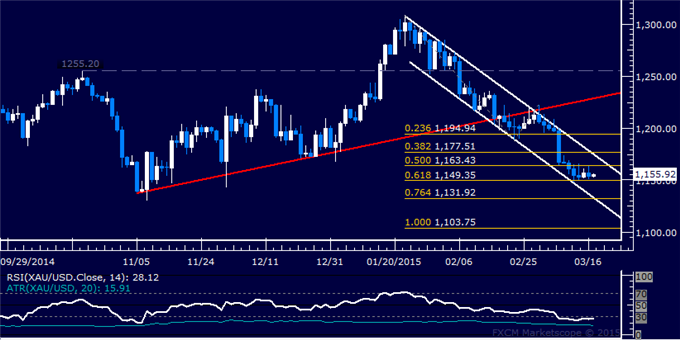
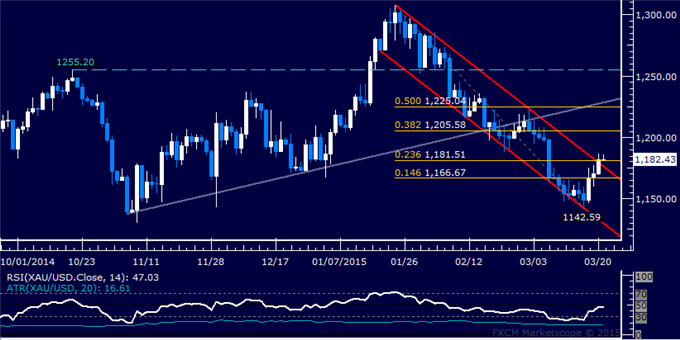
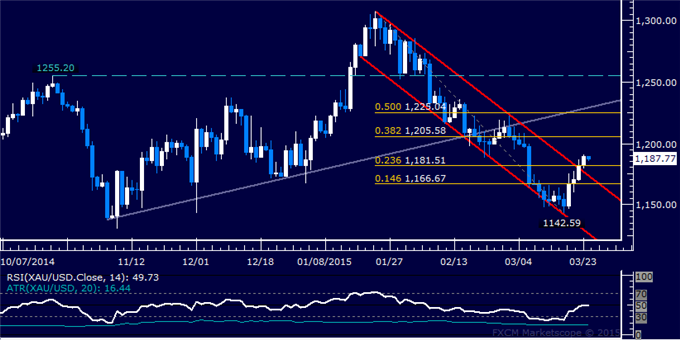
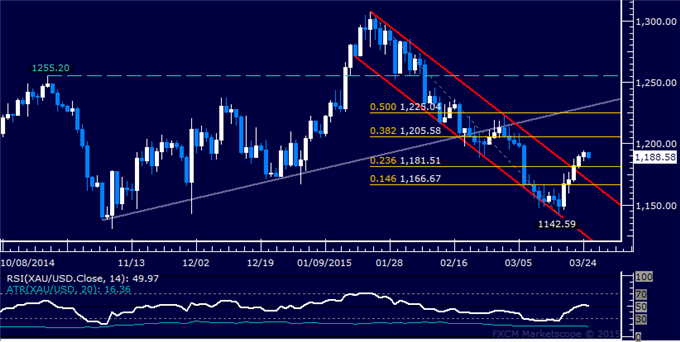
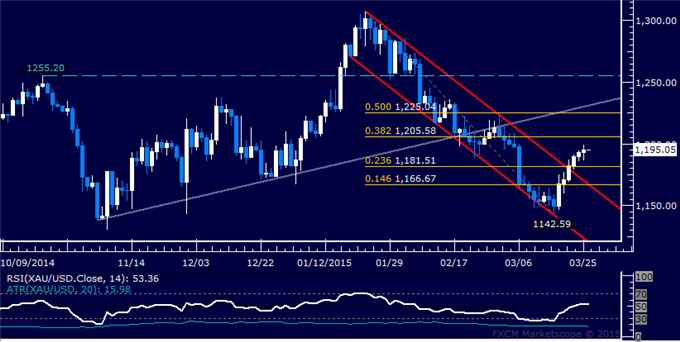
GOLD TECHNICAL ANALYSIS – Prices has stalled above interim support at 1197.86, the 61.8% Fibonacci retracement. A break above channel top resistance at 1205.30 exposes the 1215.63-18.00 area (trend line support-turned-resistance, 50% level). Alternatively, a turn below 1197.86 targets the intersection of channel floor support and the 76.4% Fib at 1171.96.
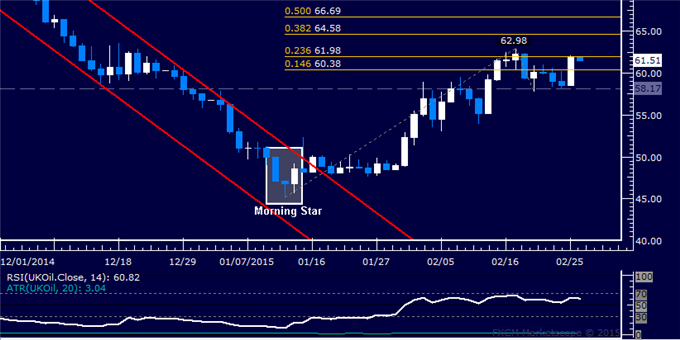
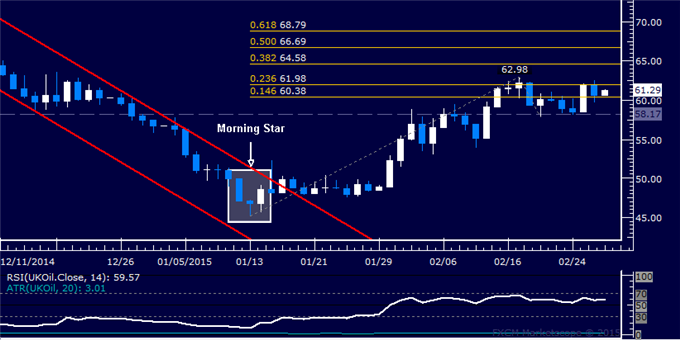
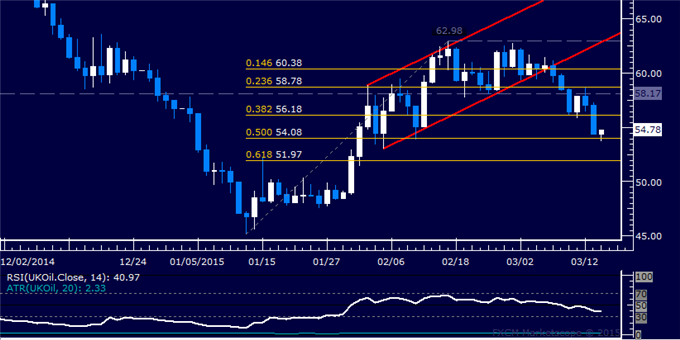
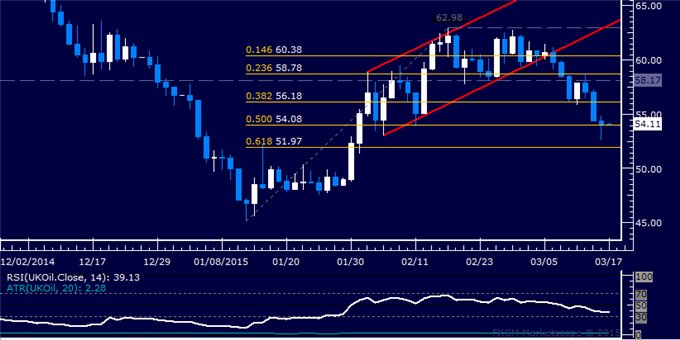
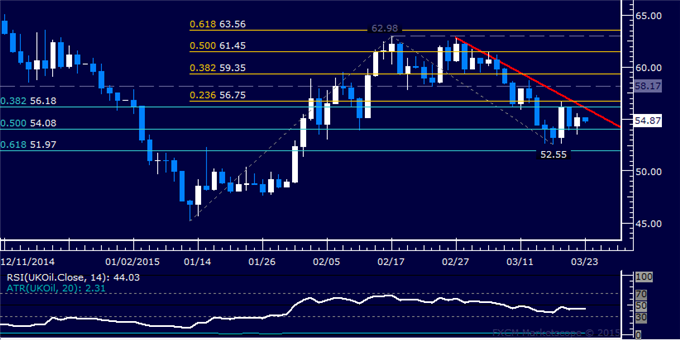
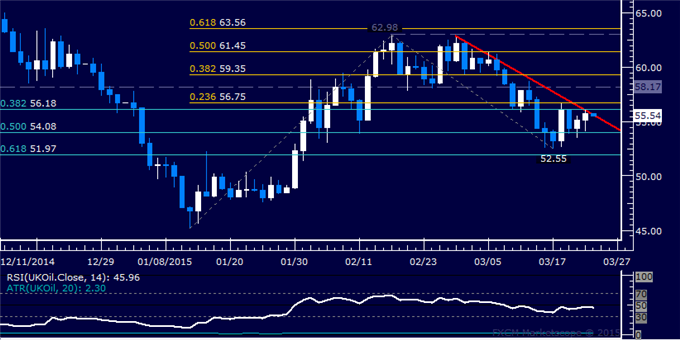
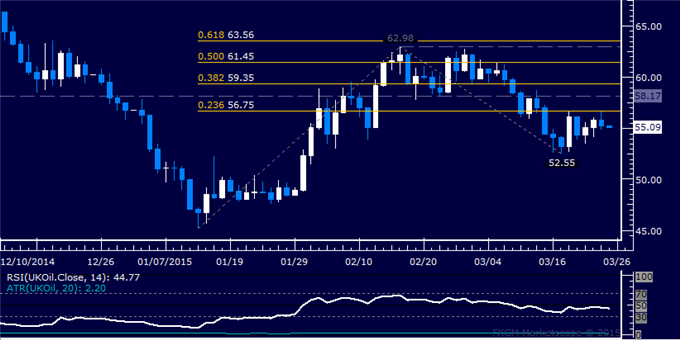
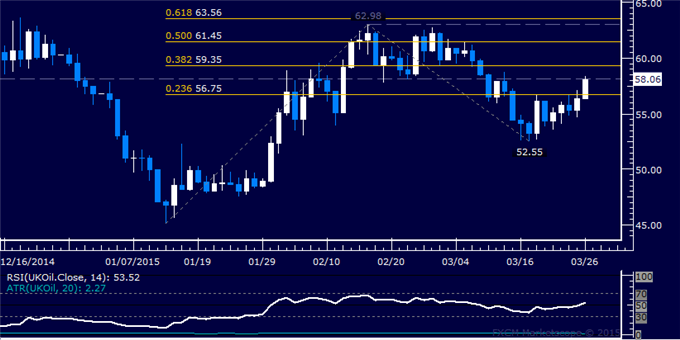
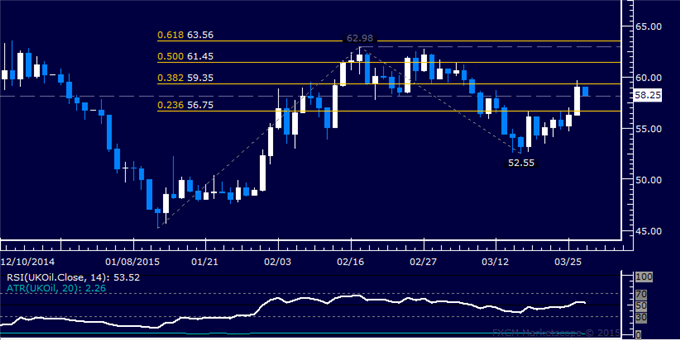
CRUDE OIL TECHNICAL ANALYSIS – Prices launched a recovery as expected, with buyers now attempting to reclaim momentum after a brief pullback. A break above the 23.6% Fibonacci expansion at 61.98 exposes the February 17 high at 62.98, followed by the 38.2% level at 64.58. Alternatively, a reversal below the 14.6% Fib at 60.38 targets resistance-turned-support at 58.17.
--- Written by Ilya Spivak, Currency Strategist for DailyFX.com
More...


 Reply With Quote


Bookmarks