
 LinkBack URL
 About LinkBacks


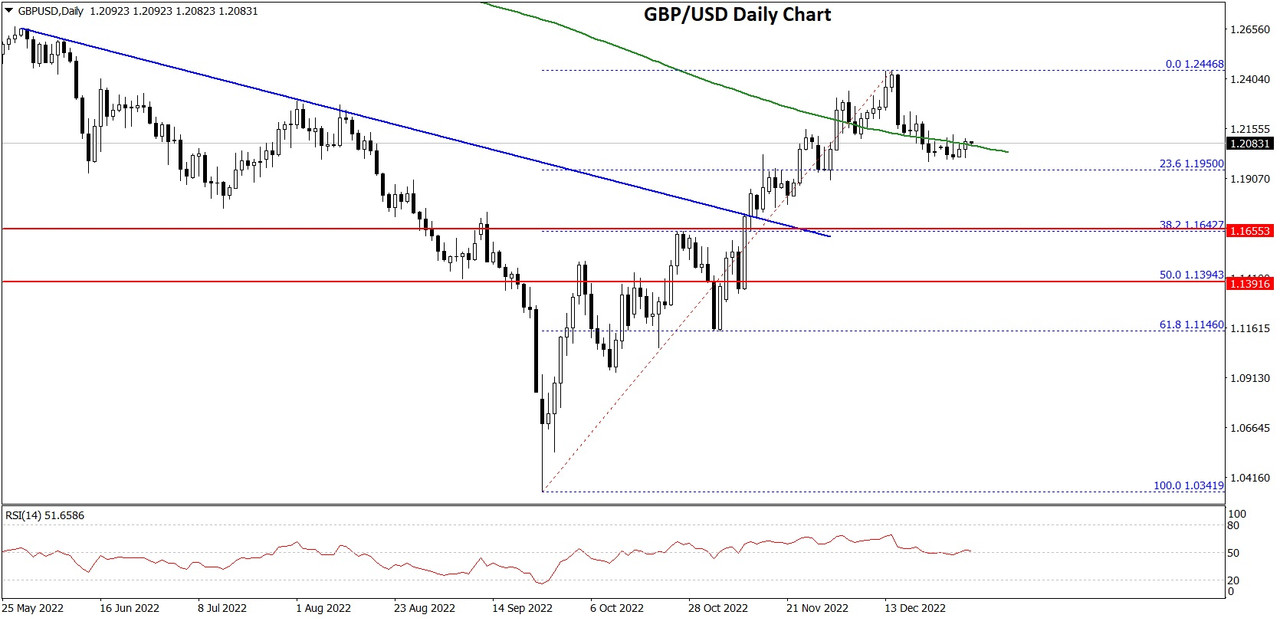
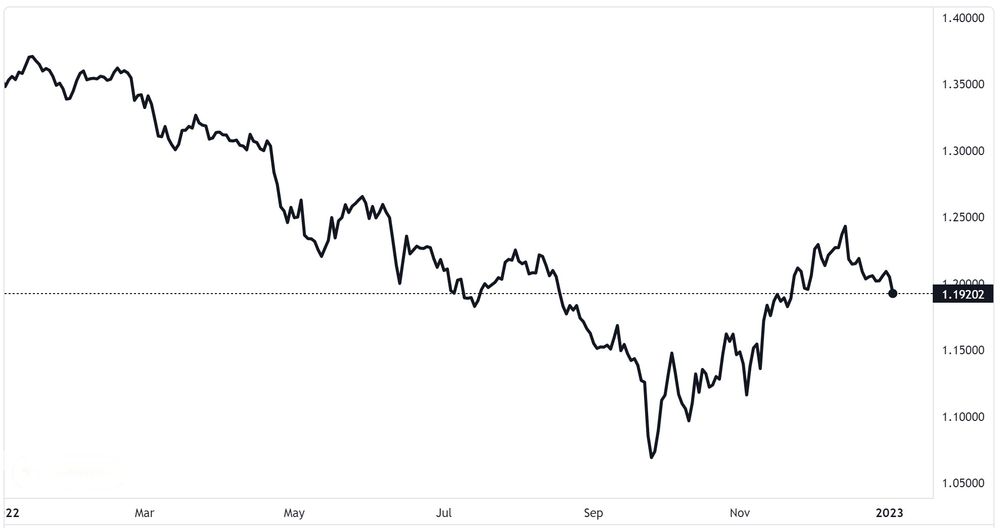
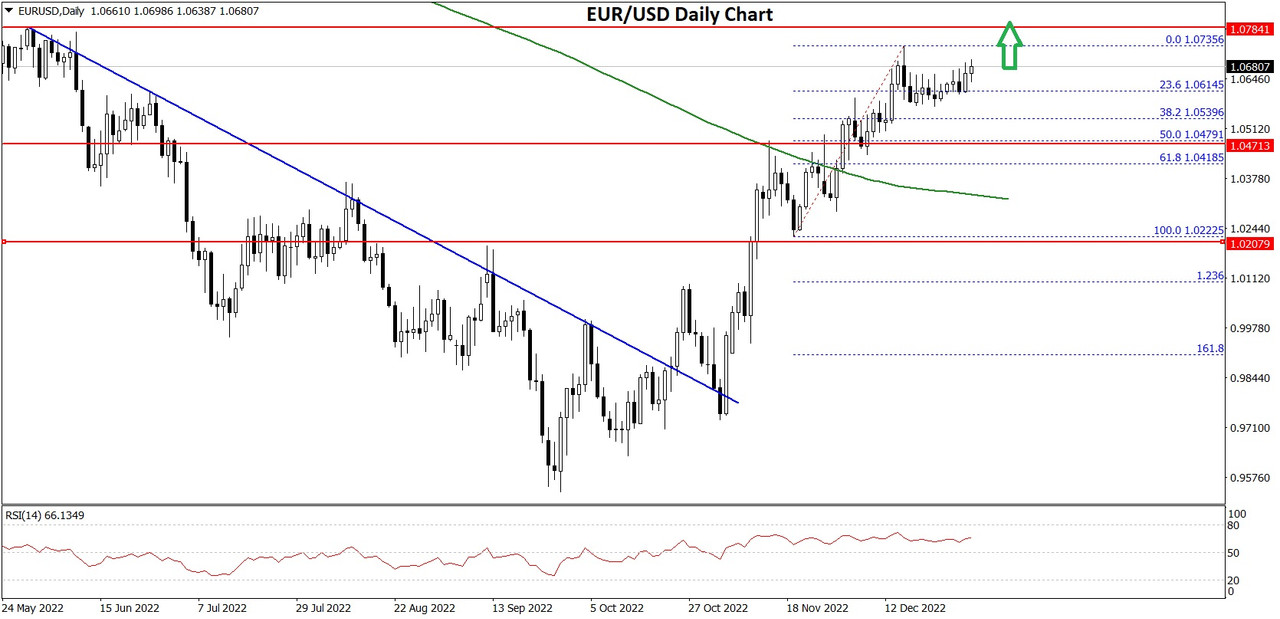
A Look Back Over 2022
The trading year ends in a couple of weeks from now, and everyone is planning for the holiday season. December, traditionally, is a short month for traders as markets slow down in the second half of the month.
As such, it is the best time to review what happened throughout the year, what moved financial markets, and what might happen in the period ahead.
VIEW FULL ANALYSIS VISIT - FXOpen Blog...
Disclaimer: This forecast represents FXOpen Companies opinion only, it should not be construed as an offer, invitation or recommendation in respect to FXOpen Companies products and services or as financial advice.


 Reply With Quote


Bookmarks