
 2Likes
 LinkBack URL
 About LinkBacks


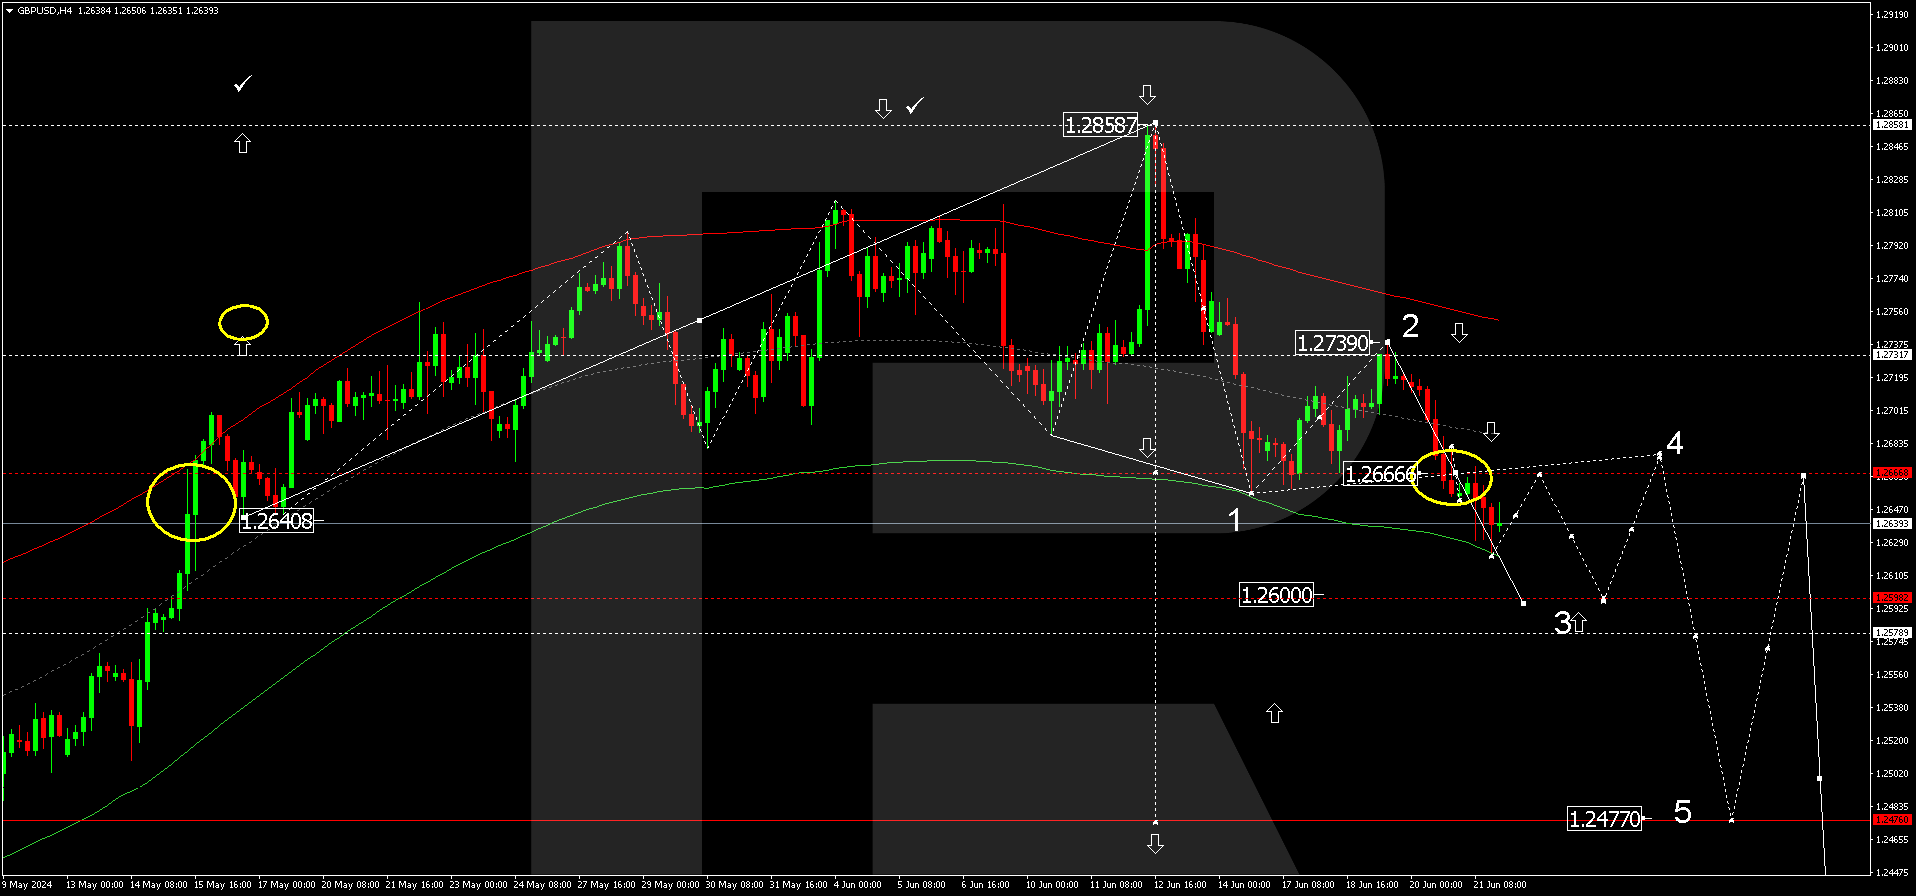
GBP attempts to rise. Overview for 11.06.2024
The British pound sterling is trying to rise against the US dollar. The current GBPUSD exchange rate stands at 1.2736.
The pound has stabilised after hitting a new local low last week. The UK employment market data, industrial production, construction activity, and trade balance figures are due for release. The data are expected to confirm an economic slowdown in April.
The unemployment rate will likely remain at 4.30%, and average earnings are anticipated to increase by 5.70%.
At its next meeting on 20 June, the Bank of England will likely keep the interest rate unchanged at 5.25% per annum, its peak since 2008. UK inflation is clearly reducing, but not fast enough.
Additionally, there is some uncertainty about the countrys elections in early July, which may exert pressure on the pound.
Fundamental analysis for other instruments can be found in the section "Forex Forecasts and Analysis" on our website.
Attention!
Forecasts presented in this section only reflect the authors private opinion and should not be considered as guidance for trading. RoboForex bears no responsibility for trading results based on trading recommendations described in these analytical reviews.
Sincerely,
The RoboForex Team


 Reply With Quote


Bookmarks