
 3Likes
 LinkBack URL
 About LinkBacks


JP Morgan Chase Co.: wave analysis
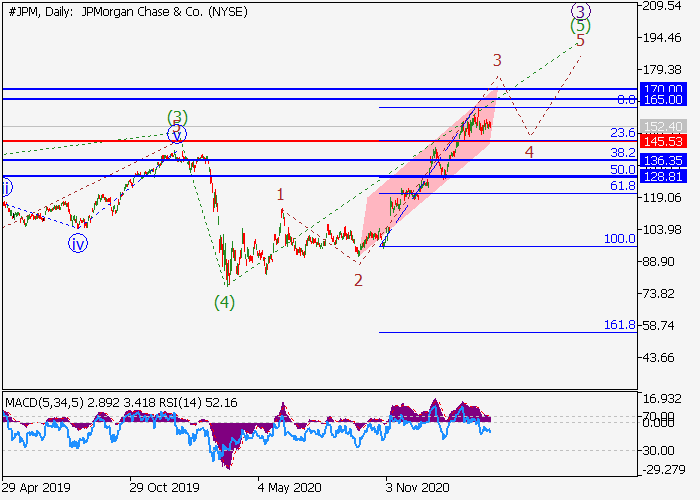
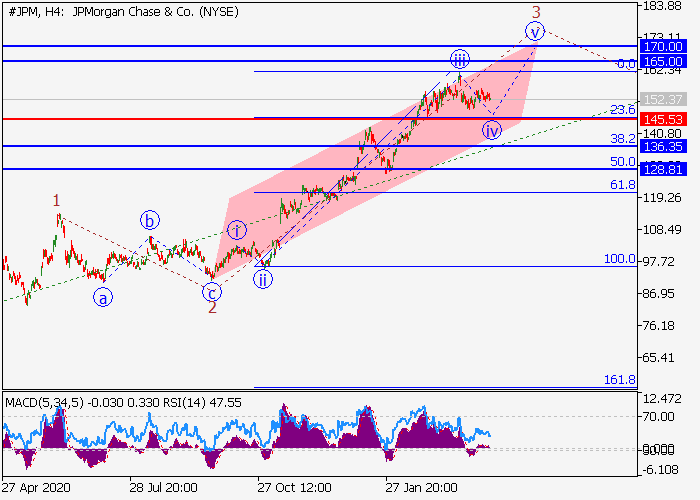
The price may grow.
On the daily chart, the fifth wave of the higher level (5) forms, within which the wave 3 of (5) develops. Now, the third wave of the lower level iii of 3 has formed, and a local correction is ending to develop as the fourth wave iv of 3. If the assumption is correct, after the end of the correction, the price will grow to the levels of 165.00170.00. In this scenario, critical stop loss level is 145.53.


 Reply With Quote


Bookmarks