Page 38 of 164 FirstFirst ... 28 36 37 38 39 40 48 88 138 ... LastLast
Results 371 to 380 of 1634

Wave Analysis by InstaForex

This is a discussion on Wave Analysis by InstaForex within the Analytics and News forums, part of the Trading Forum category; Trump gave up the slack It seems that Donald Trump will not be able to achieve the desired in negotiations ...


  1. #371
    Senior Member InstaForex Gertrude's Avatar
    Join Date
    Sep 2015
    Posts
    1,885
    Trump gave up the slack


    It seems that Donald Trump will not be able to achieve the desired in negotiations with the Chinese on trade. As usual, last weekend, he reported on his Twitter account that the negotiations were "productive" and he decided to extend the truce after March 1.

    In contrast to the American president, the Chinese side does not so vividly reflect the course of the negotiation process, I can even say it generally shows an enviable restraint of the "heavenly". The absence of any complete information from this side clearly indicates that there is no "productivity" in the negotiation process. Most likely, Trump has to back down and announce the continuation of the truce for this very reason, and he has more than enough reason for this.

    Last year, the active actions of the American president led to a "failure" in trade between the United States and China, and not only with the latter. The desire to solve all the problems by stifling pressure on competitors in world trade led to a slowdown in the growth of the economy of the PRC, a large Europe and the USA, which led to a general slowdown in the growth of the global economy.

    Trump, has not managed to solve the trade problem with China as a whole, and the desire to go to the second presidential term will force him to be more accommodating. Therefore, he will have to soften his position on this sensitive issue.

    Taking this into account, one can expect that optimism with a new force will overwhelm the world markets, which will lead to the continuation of local growth in stock markets, while the US dollar will remain under noticeable pressure. The overall demand for risky assets, as well as the expectation that the Fed will not raise interest rates in the current year and even go to stop reducing the balance, will adversely affect the rate of the US currency. In many ways, the positive theme has already been played on the foreign exchange market. That is why in this situation, we also do not expect a noticeable strong growth in the currencies of competitors, since a truce does not solve all problems, but only pushes them away in time and it's hard to say what all this will result in.

    Forecast of the day:

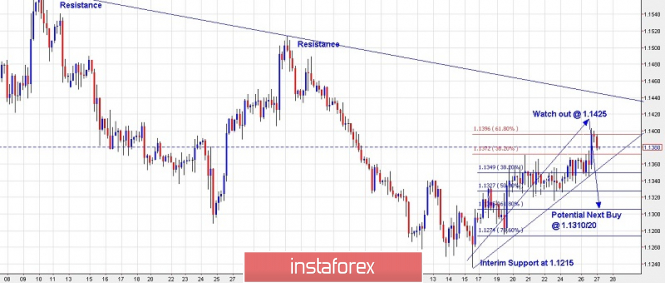
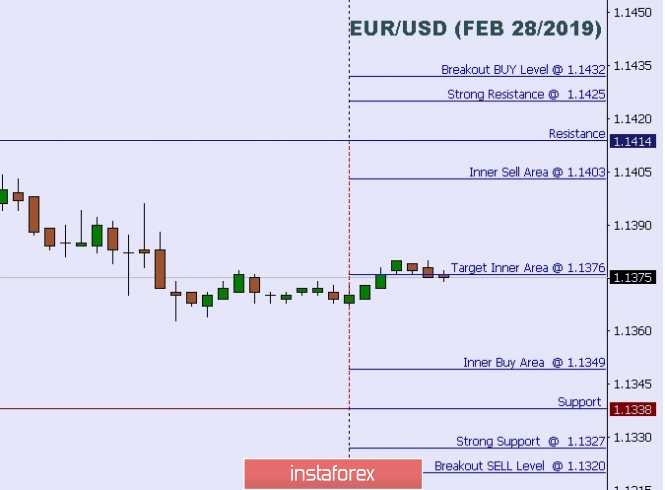
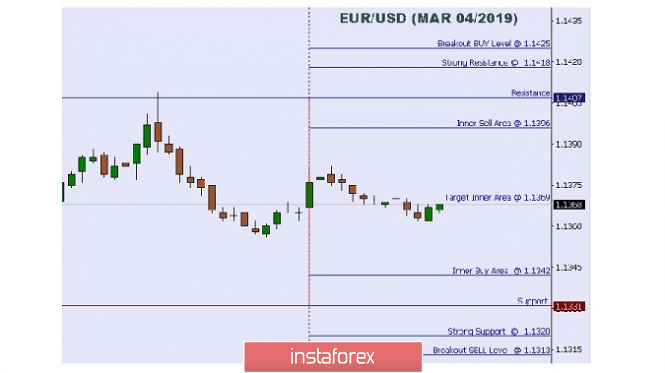
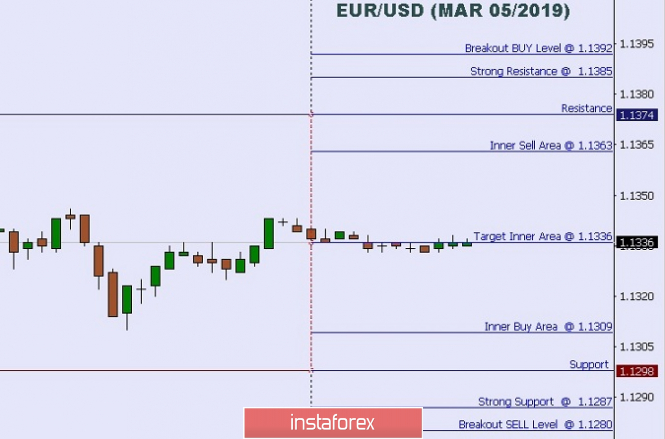
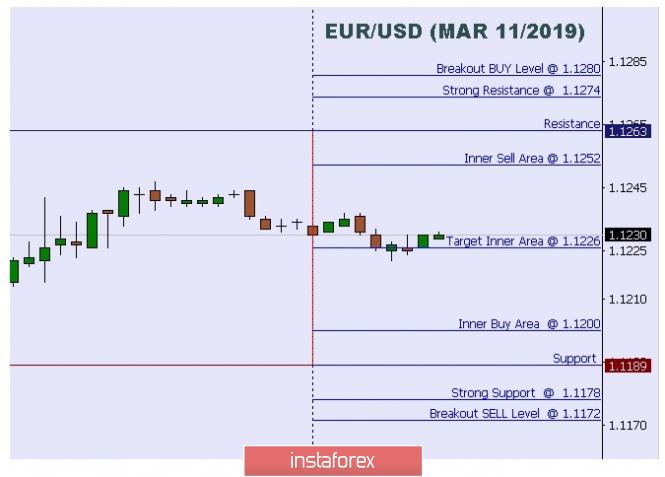
    The EURUSD pair is in a very narrow range of 1.1220-1.1370 in anticipation of resolving the situation around Brexit. It is likely that it will continue until tomorrow's speeches by Theresa May and Jerome Powell. It seems that there is not enough local weakening of the dollar exchange rate for the further growth of the pair. Stronger drivers are needed, which May and Powell can provide.

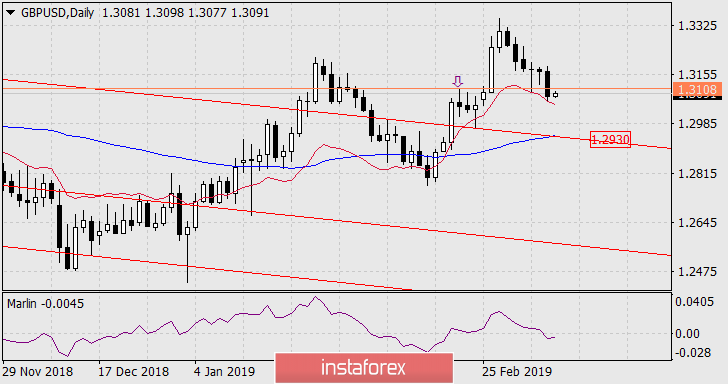
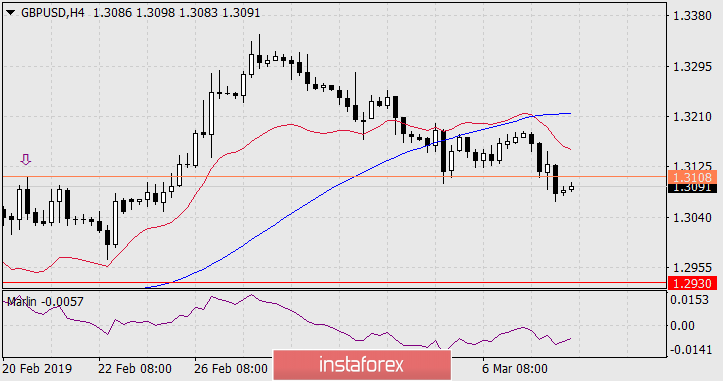
    The GBPUSD pair is trading in the range of 1.1260-1.1300, also in anticipation of Theresa May and Jerome Powell speeches.We believe that this range may continue until Tuesday.

    Analysis are provided byInstaForex.
    Best regards, PR Manager
    Learn more about InstaForex Company at http://instaforex.com

  2. #372
    Senior Member InstaForex Gertrude's Avatar
    Join Date
    Sep 2015
    Posts
    1,885
    Trading plan for EUR/USD for February 27, 2019


    Technical outlook:
    The 4H chart presented for EUR/USD indicates that the single currency pair is approaching resistance soon at the 1.1425 levels as depicted here. We can expect another push higher towards the above, before reversing lower again. With the current wave structure, it seems likely that an impulse is in the making from the 1.1233 lows as highlighted on the above chart. Bulls are expected to push through the 1.142030 zone, probably today, in the next 7-8 hours before bears take control back over a corrective drop towards the 1.1310/20 levels. If the prices move according to the above wave structure, EUR/USD should be poised to hit higher highs in the coming several weeks with the potential price targets such as 1.1500, 1.1650, and 1.1800/20. As an alternative, a drop below 1.1233 and subsequently below the 1.1215 levels could see further bearishness into the 1.1180/90 region before the rally resumes.

    Trading plan:
    1. Aggressive: Long now @ 1.1378 stop at 1.1350 target @ 1.1425
    2. Aggressive: Short @ 1.1425, stop 1.1450/60, target @ 1.1310
    3. Conservative: Long on dips towards @ 1.1310/20

    Good luck!

    Analysis are provided byInstaForex.
    Best regards, PR Manager
    Learn more about InstaForex Company at http://instaforex.com

  3. #373
    Senior Member InstaForex Gertrude's Avatar
    Join Date
    Sep 2015
    Posts
    1,885
    Technical analysis: Intraday Level For EUR/USD, Feb 28, 2019


    When the European market opens, some Economic Data will be releasedsuch as Italian Prelim CPI m/m, Spanish Flash CPI y/y, French PrelimGDP q/q, French Prelim CPI m/m, French Consumer Spending m/m, GermanPrelim CPI m/m, German Import Prices m/m. The US will release theEconomic Data too such as Natural Gas Storage, Chicago PMI,Unemployment Claims, Advance GDP Price Index q/q, Advance GDP q/q, soamid the reports,EUR/USD will move in a low to medium volatilityduring this day.

    TODAY'S TECHNICAL LEVEL:
    Breakout BUY Level: 1.1432.
    Strong Resistance:1.1425.
    Original Resistance: 1.1414.
    Inner Sell Area: 1.1403.
    Target Inner Area: 1.1376.
    Inner Buy Area: 1.1349.
    Original Support: 1.1338.
    Strong Support: 1.1327.
    Breakout SELL Level: 1.1320.

    Analysis are provided byInstaForex.
    Best regards, PR Manager
    Learn more about InstaForex Company at http://instaforex.com

  4. #374
    Senior Member InstaForex Gertrude's Avatar
    Join Date
    Sep 2015
    Posts
    1,885
    Gold got rid of the ballast

    Rebounding from support near two-week lows, gold quickly recovered and rushed to attack. The external background for the precious metal remains favorable, and the short-term correction is due to a partial profit-taking after a long rally and the statement of US trade representative Robert Lighthizer that there are still many issues in relations with China and the deal has not yet been concluded. Let me remind you that the conflict between the two largest economies in the world faithfully served the US dollar in 2018.

    Despite the fact that gold is considered a safe haven asset and a hedge against inflation, it is growing amid the recovery of US stock indices and the slowdown in consumer prices in the United States. In fact, one of the main drivers of the S&P 500 rally is the reduction in the cost of borrowing in real terms. The negative correlation between the stock index and the yield of US Treasury bonds reached its highest levels since 2012, due to the Federal Reserve's desire to pause the process of normalizing monetary policy. 7 years ago, the central bank announced another round of quantitative easing.

    The dynamics of the correlation of the S&P 500 and the yield of US bonds


    However, the fall in real rates of the US debt market creates favorable conditions not only for the shares, but also for many assets of the commodity market, including gold, oil and copper. Precious metal does not bring interest income to its holders, so it cannot compete with bonds if their yield increases. Currently, it is falling, and investors are actively diversifying their portfolios in favor of XAU/USD.

    The current consolidation of gold is due not only to profit taking by speculators after 9% of the winter rally, but also to the reluctance of the derivatives market to increase the chances of reducing the Federal funds rate in 2019. CME derivatives believe in the end of the normalization cycle, however, in order for them to adopt the idea of easing the Fed's monetary policy, further deterioration in macroeconomic statistics across the United States is necessary. Theoretically, it is very likely, because the traditionally bad weather for this time in the United States, the fading effect of the fiscal stimulus, the negative impact of the dollar's revaluation on exports and GDP, as well as the weakening of external demand due to trade wars draw moderately pessimistic prospects for US indicators. At least in the short-term investment horizon.

    The dollar can recover in the medium-term. The euphoria about the de-escalation of the trade conflict has driven the S&P 500 too high. The rally does not have a solid foundation in the form of improved macroeconomic statistics. According to 65% of more than 90 experts from Reuters, US stock indexes are in danger of falling in the second half of this year. This will have a positive effect on safe-haven assets, including the US dollar.

    Technically, if bulls on gold manage to keep quotes above $1,321 per ounce, the risks of continuing the rally in the direction of the target by 361.8% on the AB=CD pattern will increase.

    Gold daily chart


    Analysis are provided byInstaForex.
    Best regards, PR Manager
    Learn more about InstaForex Company at http://instaforex.com

  5. #375
    Senior Member InstaForex Gertrude's Avatar
    Join Date
    Sep 2015
    Posts
    1,885
    Technical analysis: Intraday Level For EUR/USD, Mar 04, 2019


    When the European market opens, some economic data will be released such as PPI m/m, Sentix Investor Confidence, and Spanish Unemployment Change. The US will also publish the economic data such as Construction Spending m/m, so amid the reports, the EUR/USD pair will move with a low to a medium volatility during this day.

    TODAY'S TECHNICAL LEVEL:
    Breakout BUY Level: 1.1425.
    Strong Resistance: 1.1418.
    Original Resistance: 1.1407.
    Inner Sell Area: 1.1396.
    Target Inner Area: 1.1369.
    Inner Buy Area: 1.1342.
    Original Support: 1.1331.
    Strong Support: 1.1320.
    Breakout SELL Level: 1.1313.

    Analysis are provided byInstaForex.
    Best regards, PR Manager
    Learn more about InstaForex Company at http://instaforex.com

  6. #376
    Senior Member InstaForex Gertrude's Avatar
    Join Date
    Sep 2015
    Posts
    1,885
    Technical analysis: Intraday Level For EUR/USD, Mar 05, 2019


    When the European market opens, some economic data will be released such as Retail Sales m/m, Final Services PMI, German Final Services PMI, German Final Services PMI, French Final Services PMI, Italian Services PMI, and Spanish Services PMI. The US will also publish the economic data such as Federal Budget Balance, IBD/TIPP Economic Optimism, New Home Sales, ISM Non-Manufacturing PMI, Final Services PMI, so amid the reports, EUR/USD will move with a low to a medium volatility during this day.

    TODAY'S TECHNICAL LEVEL:
    Breakout BUY Level: 1.1392.
    Strong Resistance: 1.1385.
    Original Resistance: 1.1374.
    Inner Sell Area: 1.1363.
    Target Inner Area: 1.1336.
    Inner Buy Area: 1.1309.
    Original Support: 1.1298.
    Strong Support: 1.1287.
    Breakout SELL Level: 1.1280.

    Analysis are provided byInstaForex.
    Best regards, PR Manager
    Learn more about InstaForex Company at http://instaforex.com

  7. #377
    Senior Member InstaForex Gertrude's Avatar
    Join Date
    Sep 2015
    Posts
    1,885
    AUD/USD. In the grip of contradictions: the aussie cannot choose the vector of its movement

    The March meeting of the Reserve Bank of Australia was quiet and almost imperceptible. The regulator retained the parameters of monetary policy in its previous form and did not frighten the market with arguments about the interest rate reduction in the foreseeable future. The Australian dollar, in turn, reacted accordingly: paired with the US currency, the "aussie" remained within the 70th figure, and Tuesday's price fluctuations were associated more with Chinese data than with the results of the RBA meeting.


    In order to assess the prospects of AUD/USD, first of all it is necessary to remember the reasons for the pair's decline last month. The downward impulse was due to the rhetoric of the head of the RBA Philip Lowe, who, to the surprise of many traders, allowed the probability of lowering the interest rate this year. It is worth noting that in fact his phrase was more shrouded – firstly, he reported the transition to a "neutral position" in monetary policy, and secondly, he noted that the rate can be both increased and reduced. But the market interpreted this commentary in its own way, especially since earlier in the text of the accompanying statement there was only a phrase that "in the future" the parameters of monetary policy will be tightened. In other words, the regulator has transparently hinted that in the near future it will take a wait-and-see position, and then act on the situation, and the option of reducing the rate is likely to be the opposite scenario. In response to such prospects, the AUD/USD pair fell by almost 200 points, but the price did not fall below the 70th figure, stuck in a narrow-range flat.

    Given Philip Lowe's rather dovish rhetoric, many experts warned that the regulator could significantly soften its tone at the March meeting. However, these forecasts did not come true: the Reserve Bank voiced a cautious, but not pessimistic position, even noting positive developments in the Australian economy - in particular, regarding the labor market.

    Let me remind you that according to the latest published data, the unemployment rate in Australia remained at five percent, but the increase in the number of employed jumped to 39.1 thousand - the last time such a dynamics was observed was back in August 2018. Moreover, employment growth in January was not due to part-time employment — on the contrary, the employment rate for full-time jobs, which imply higher wages, surpassed a one-and-a-half high, while part-time employment showed a negative trend. This factor has a positive effect on the dynamics of wage growth and, indirectly, on the dynamics of inflation growth.

    However, despite the neutral and optimistic results of the March meeting of the RBA, the aussie did not regain its position or even leave the region of the 70th figure. The reason for this is China. Today, another disappointing data from China was published, which again reminded the market of the slowdown of the world's largest economy. Thus, the index of business activity in the services sector from Markit (Markit Services PMI) sharply declined in February, reaching 51.1 points. Over the previous three months, this indicator came out within the framework of 53 points, therefore, such a sharp and, most importantly, unexpected (forecast was at the level of 53.5 points) downward jump had an impact on the dynamics of today's trading. The Australian dollar is most sensitive to the decline in Chinese indicators, since China is its main trading partner.


    Taking into account such contradictory fundamental factors, the AUD/USD pair will continue to be traded in the flat - if only the data on Australian GDP growth for the fourth quarter of last year (the release is scheduled for March 6) prove to be stronger/weaker than forecasts. According to general expectations, the Australian economy should grow by 0.5% qoq and decrease to 2.7% year-on-year. If the release comes out at the level of forecasts, then the pair's situation will remain as before, otherwise the aussie will test either the support level (0.7020 - the lower boundary of the Kumo cloud on the daily chart), or the resistance level (0.7180, where Kijun-sen coincides with the upper line of the Bollinger Bands indicator on the same timeframe).

    Analysis are provided byInstaForex.
    Best regards, PR Manager
    Learn more about InstaForex Company at http://instaforex.com

  8. #378
    Senior Member InstaForex Gertrude's Avatar
    Join Date
    Sep 2015
    Posts
    1,885
    AUD/USD: The aussie dives down, but there is strong support ahead

    Yesterday, the Australian dollar showed certain optimism, "inspired" by the results of the March meeting of the RBA. The regulator took a cautiously optimistic stance, focusing on the positive aspects of the Australian macroeconomic reports. Contrary to the fears of many experts, the central bank did not discuss the issue of reducing the interest rate, leaving some hope for the preservation of the status quo. But today, market mood regarding the prospects of the Australian currency has changed dramatically: published data on GDP growth in Australia suggests that the option of easing monetary policy can not be dismissed. Moreover, according to a number of currency strategists, such a scenario should be considered as one of the main ones.

    Data on the growth of the Australian economy was disappointing. What is alarming is not just the fact that the country's GDP slowed down in the fourth quarter of last year - it is a persistent trend towards a decrease in the key indicator. Thus, if in the first quarter of 2018, Australia's GDP was at the level of 1.1% (quarterly), in the second quarter it decreased to 0.9%, in the third – to 0.3%, and finally in the fourth – to 0.2%. The same dynamics is observed in annual terms of the indicator: I quarter – 3.2%, II – 3.1%, III – 2.7% and IV – 2.3%. Today's release was not only worse than forecasts, but it also marked a certain anti-record. For example, on a quarterly basis, the indicator showed the weakest growth dynamics since the third quarter of 2016.


    It is worth recalling that at its January meeting, the Reserve Bank of Australia downwardly revised its forecast for economic growth this year - from 3.5% to 3%. However, the figures published today suggest that the RBA may return to this issue in the future, reducing its growth forecast to at least 2.8%. Extremely weak indicators for the fourth quarter cast doubt on the sustainability of the country's economic growth and, consequently, increases the likelihood of a response from the Australian regulator. As I mentioned above, some currency strategists warn their clients about the implementation of such a scenario.

    So, in late February, experts from Westpac (one of the largest banks in Australia, included in the "big four" banks of the country) surprised traders with the fact that they had made a double RBA rate cut before the end of this year. At the same time, economists of this bank, at the beginning of the year, claimed that the regulator would leave the rate unchanged until the end of 2020. Such a sharp turn put some pressure on the Australian dollar, which was then offset by good data on the Australian labor market and neutral results of the March meeting.

    Nevertheless, Westpac did not abandon its "dovish" forecast: moreover, today this opinion was supported by two more conglomerates - JPMorgan and Macquarie Bank. Analysts of these banks said that the Australian regulator will not be able to ignore the further slowdown in the economy, while there are no prerequisites for changing the situation at the moment, especially against the background of the slowdown in the PRC economy. Therefore, the RBA will have no other choice but to lower the interest rate - at least once before the end of this year. The opinion of several large banks is shared by many experts, who voiced their point of view following the release of disappointing data.

    According to more restrained forecasts, the RBA will still hold a wait-and-see position, but if there are no clear and strong signals about economic recovery in the coming months, then the central bank will still lower the rate - especially if economists worsen GDP growth forecasts for this year to 2.6% .

    After such an unexpected reversal in the market's general sentiment, the Australian dollar was under considerable pressure. Paired with the US dollar, the aussie is heading to the main support level of 0.70. This mark is a "price stronghold", which is difficult to break through, but even more difficult - to consolidate in the area of 69-68 figures. If you look at the weekly and monthly charts, you can see that the pair was under the 70th mark only in 2016 for the last time in a long time. After that, the bears made impulsive attempts to break through, but the price quickly returned to its usual niche.


    Therefore, despite the negative fundamental background for the aussie, short positions in the AUD/USD pair currently appear risky, with the price now in the area of 0.7030, that is very close to the key level of support. In this case, it is advisable to observe the behavior of the pair at the bottom of the 70th figure. If the bearish momentum fades, then a corrective pullback will probably follow (approximately to 0.7080, that is, to the upper boundary of the Kumo cloud on D1), which, however, does not cancel the overall downward trend for the pair.

    Analysis are provided byInstaForex.
    Best regards, PR Manager
    Learn more about InstaForex Company at http://instaforex.com

  9. #379
    Senior Member InstaForex Gertrude's Avatar
    Join Date
    Sep 2015
    Posts
    1,885
    Forecast for GBP/USD on March 8, 2019

    Data on the growth of the Australian economy was disappointing. What is alarming is not just the fact that the country's GDP slowed down in the fourth quarter of last year - it is a persistent trend towards a decrease in the key indicator. Thus, if in the first quarter of 2018, Australia's GDP was at the level of 1.1% (quarterly), in the second quarter it decreased to 0.9%, in the third – to 0.3%, and finally in the fourth – to 0.2%. The same dynamics is observed in annual terms of the indicator: I quarter – 3.2%, II – 3.1%, III – 2.7% and IV – 2.3%. Today's release was not only worse than forecasts, but it also marked a certain anti-record. For example, on a quarterly basis, the indicator showed the weakest growth dynamics since the third quarter of 2016.


    On a smaller scale, H4, price convergence with the Marlin oscillator is being formed, which can be realized in a correction from the pound's fall from February 28, visually from the balance line to the daily. We do not expect a high correction, since the signal level of 1.3108 can assume the role of a split, that is, the level at which the price will be wound in a consolidation process.

    Analysis are provided byInstaForex.
    Best regards, PR Manager
    Learn more about InstaForex Company at http://instaforex.com

  10. #380
    Senior Member InstaForex Gertrude's Avatar
    Join Date
    Sep 2015
    Posts
    1,885
    Technical analysis: Intraday Level For EUR/USD, Mar 11, 2019


    When the European market opens, some economic data will be released such as German Trade Balance and German Industrial Production m/m. The US will also publish the economic data such as Business Inventories m/m, Retail Sales m/m, and Core Retail Sales m/m, so amid the reports, the EUR/USD pair will move with a low to a medium volatility during this day.

    TODAY'S TECHNICAL LEVEL:
    Breakout BUY Level: 1.1280.
    Strong Resistance:1.1274.
    Original Resistance: 1.1263.
    Inner Sell Area: 1.1252.
    Target Inner Area: 1.1226.
    Inner Buy Area: 1.1200.
    Original Support: 1.1189.
    Strong Support: 1.1178.
    Breakout SELL Level: 1.1172.

    Analysis are provided byInstaForex.
    Best regards, PR Manager
    Learn more about InstaForex Company at http://instaforex.com

Page 38 of 164 FirstFirst ... 28 36 37 38 39 40 48 88 138 ... LastLast

Tags for this Thread

Bookmarks

Posting Permissions

  • You may not post new threads
  • You may not post replies
  • You may not post attachments
  • You may not edit your posts
  •