
 2Likes
 LinkBack URL
 About LinkBacks


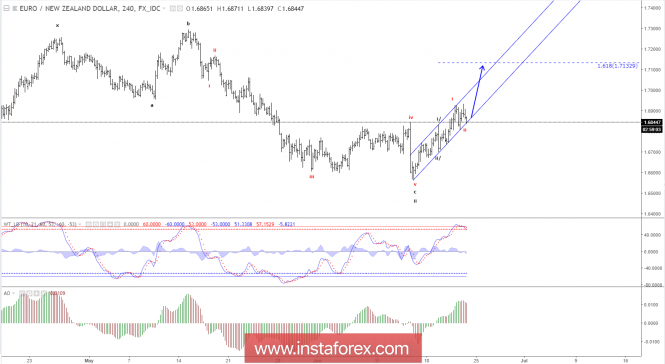
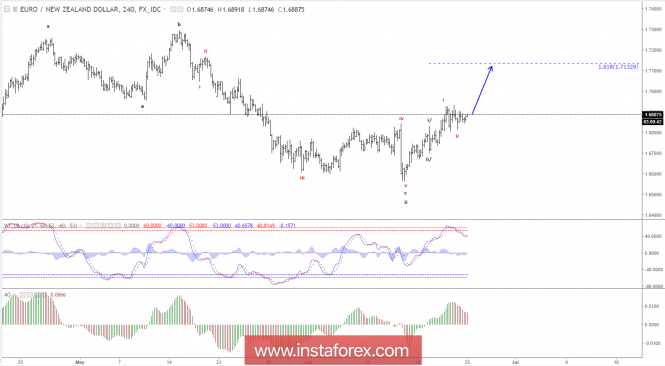
Elliott wave analysis of EUR/NZD for June 22, 2018
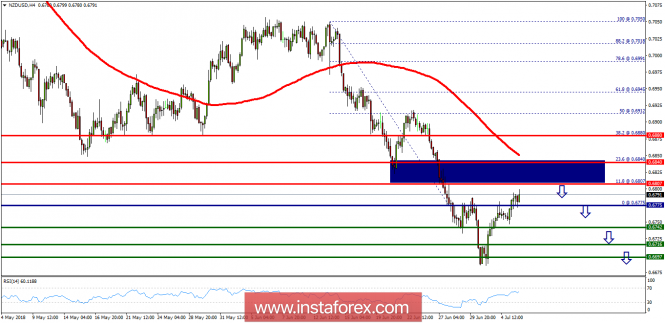
The minor correction we expected from 1.6921 moved slightly lower than expected and spiked down to 1.6806, but that does not change our outlook for a new impulsive rally soon towards 1.7133 and above.
Short-term, we could see another minor spike to near 1.6806 before the next move higher should be expected.
Only an unexpected break below support at 1.6737 will question our bullish outlook.
R3: 1.7025
R2: 1.6964
R1: 1.6933
Pivot: 1.6890
S1: 1.6837
S2: 1.6784
S3: 1.6737
Trading recommendation:
We are long EUR from 1.6815 with our stop placed at 1.6730. If you are not long EUR yet, then buy near 1.6806 or upon a break above 1.6933 and use the same stop at 1.6730.
*The market analysis posted here is meant to increase your awareness, but not to give instructions to make a trade.
Analysis are provided byInstaForex.


 Reply With Quote


Bookmarks