Page 17 of 164 FirstFirst ... 7 15 16 17 18 19 27 67 117 ... LastLast
Results 161 to 170 of 1634

Wave Analysis by InstaForex

This is a discussion on Wave Analysis by InstaForex within the Analytics and News forums, part of the Trading Forum category; Gold was trapped The news about the resignation of the chief economic adviser to the president Gary Cohn allowed gold ...


  1. #161
    Senior Member InstaForex Gertrude's Avatar
    Join Date
    Sep 2015
    Posts
    1,885
    Gold was trapped

    The news about the resignation of the chief economic adviser to the president Gary Cohn allowed gold to mark its best daily level since Valentine's Day. If an ardent opponent of protectionism, an ex-candidate for the presidency of the Fed, withdraws from his post, a potential global trade war is unlikely to be avoided. And in it, all weapons will look good. Including - large-scale selling of US Treasury bonds by the main holders in the face of China and Japan. I believe other countries will do the same. Their desire to get rid of the power of the dollar will force them to shift to gold. Thus, trade wars are potentially capable of providing the precious metal with invaluable support.

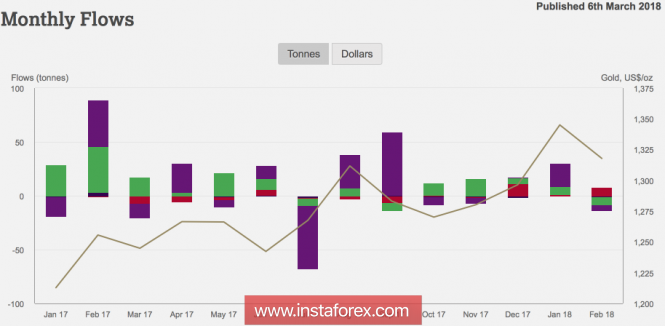
    Until March, investors' demand for ETF products was characterized by mixed dynamics. The fall in the XAU/USD and the increase in gold volatility contributed to an outflow of 5.1 tonnes in February. The biggest losses were suffered by European (-7.3 tons) and North American stock-exchange specialized funds (-5.1 tons), while Asians, on the contrary, replenished their reserves (+7.9 tons). As a result, according to the latest figure, it has increased by 10% since the beginning of the year.

    Monthly dynamics of demand for ETF products


    Source: WGC.
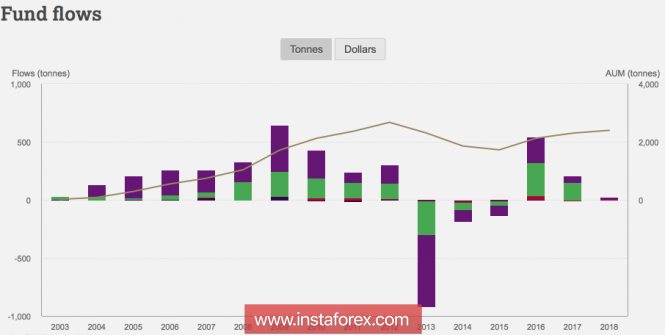
    Annual dynamics of demand for ETF products


    Source: WGC.
    In my opinion, the value of the investment demand for precious metals was influenced by the strengthening of the US dollar. The fastest growth in the weekly wage in January over the past few years has strengthened the risks of overclocking inflation and the aggressive monetary tightening of the Fed. Moreover, the new head of the Federal Reserve was optimistic about the US economy and the way of betting on federal funds. The President of the Federal Reserve Bank of New York, William Dudley, indicated four hikes in 2018 - a gradual normalization of monetary policy. As a result, the futures market increased the chances of such an outcome to 34%, and gold plunged into a wave of selling. Everyone remembers perfectly how uncomfortable it felt at the eve of the historic FOMC meetings in 2017.

    Nevertheless, the growing likelihood of the implementation of the policy of anti-globalization, Donald Trump, significantly tempered investors' appetite for risk. If the stock indexes behaved rather restrained in response to the high-sounding statements of the US president on tariffs on the import of steel and aluminum, the resignation of Gary Cohn convinced that the matter should be taken very seriously.

    In the medium term, gold can be trapped in consolidation: on the one hand, news about the trade war will provide support to the bulls on the XAU/USD; on the other hand, the return of the divergence idea in the monetary policy of the Federal Reserve and the central banks-peers can become a saving straw for the US dollar. In my opinion, in the second and third quarters, against the background of the return of the normalization theme, its strength will run out, so the price will drop to the lower border of the trading range of $1300-1360 per ounce, which makes sense to use for purchases.

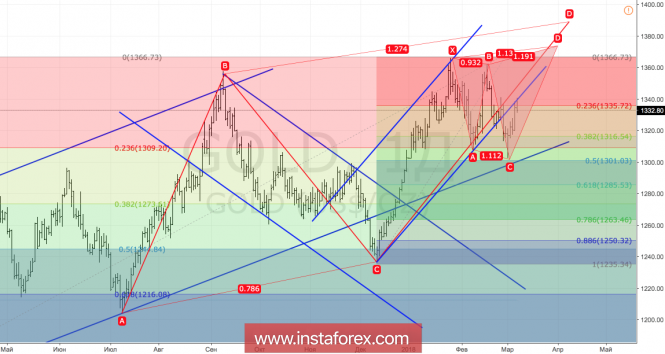
    Technically, if the bulls manage to return gold quotes to the limits of the upward medium-term trading channel, then the risks of implementing the target values by 113% and by 127.2% according to the Shark and AB = CD patterns will increase. Gold, daily chart


    Analysis are provided byInstaForex.
    Best regards, PR Manager
    Learn more about InstaForex Company at http://instaforex.com

  2. #162
    Senior Member InstaForex Gertrude's Avatar
    Join Date
    Sep 2015
    Posts
    1,885
    Technical analysis of EUR/USD for March 09, 2018


    When the European market opens, some economic data will be released such as the French Industrial Production m/m, the French Gov Budget Balance, the German Trade Balance, and the German Industrial Production m/m. Meanwhile, the US will also deliver some reports such as the Final Wholesale Inventories m/m, the Unemployment Rate, the Non-Farm Employment Change, and the Average Hourly Earnings m/m. So amid the reports, EUR/USD will move in a medium to high volatility during this day.

    TODAY'S TECHNICAL LEVELS:
    Breakout BUY Level: 1.2369.
    Strong Resistance:1.2362.
    Original Resistance: 1.2350.
    Inner Sell Area: 1.2338.
    Target Inner Area: 1.2309.
    Inner Buy Area: 1.2280.
    Original Support: 1.2268.
    Strong Support: 1.2256.
    Breakout SELL Level: 1.2249.

    Analysis are provided byInstaForex.
    Best regards, PR Manager
    Learn more about InstaForex Company at http://instaforex.com

  3. #163
    Senior Member InstaForex Gertrude's Avatar
    Join Date
    Sep 2015
    Posts
    1,885
    USD/JPY has reached our profit target perfectly, prepare for further rise


    The price has risen perfectly to our profit target and looks poised to rise further after breaking a strong descending resistance-turned-support line. We look to buy above 106.48 (Fibonacci retracement, horizontal overlap support, breakout level) for a push up to 108.51 (Fibonacci retracement, horizontal pullback resistance). We do have to be cautious about 107.78 resistance as the price might react off that level.

    RSI (89) has made a similar bullish exit signaling a change in momentum from bearish to bullish.

    Buy above 106.48. Stop loss at 105.81. Take profit at 108.51

    Analysis are provided byInstaForex.
    Best regards, PR Manager
    Learn more about InstaForex Company at http://instaforex.com

  4. #164
    Member
    Join Date
    Sep 2015
    Posts
    94
    NZD/USD Intraday technical levels and trading recommendations for for March 20, 2018


    Daily Outlook

    In July 2017, an atypical Head and Shoulders pattern was expressed on the depicted chart which indicated upcoming bearish reversal.
    As expected, the price level of 0.7050 failed to offer enough bullish support for the NZD/USD pair. That's why, further bearish decline was expected towards 0.6800 (Reversal pattern bearish target).
    Evident signs of bullish recovery was expressed around the depicted low (0.6780). An inverted Head and Shoulders pattern was expressed around these price levels.
    The price zone of 0.7140-0.7250 (prominent Supply-Zone) failed to pause the ongoing bullish momentum. Instead, a bullish breakout above 0.7250 was expressed on January 11.
    That's why, a quick bullish movement was expected towards the depicted supply zone (0.7320-0.7390) where evident bearish rejection and a valid SELL entry were expected.
    On February 2, a bearish engulfing daily candlestick was expressed off the price level of 0.7390. Moreover, a double-top reversal pattern was expressed around the price zone (0.7320-0.7390).
    The price zone (0.7320-0.7390) stood as a significant supply zone for the NZD/USD pair. Any bullish pullback towards this price zone should be considered for a valid SELL entry.
    On the other hand, bearish breakdown of 0.7300 (neckline) is needed to confirm the depicted reversal pattern. Bearish projection target would be located around 0.7050 and 0.7000.

    *The market analysis posted here is meant to increase your awareness, but not to give instructions to make a trade.

  5. #165
    Member
    Join Date
    Sep 2015
    Posts
    94
    EUR/JPY analysis for March 21, 2018


    Recently, the EUR/JPY pair has been trading sideways at the price of 130.48. According to the 30M time frame, I found that price has broken the upward channel (bearish pennant) in the background, which is a sign that buying looks risky. I also found a strong downward leg in the background, which is another sign of weakness. My advice is to watch for potential selling opportunities. Downward targets are set at the price of 130.32 and at the price of 129.60.

    Resistance levels:
    R1: 131.30
    R2: 132.20
    R3: 132.65
    Support levels:
    S1: 129.93
    S2: 129.44
    S3: 128.53

    Trading recommendations for today: watch for potential selling opportunities.

    *The market analysis posted here is meant to increase your awareness, but not to give instructions to make a trade.

  6. #166
    Senior Member InstaForex Gertrude's Avatar
    Join Date
    Sep 2015
    Posts
    1,885
    Technical analysis of NZD/USD for March 22, 2018


    NZD/USD is expected to trade with bullish outlook. The pair is still showing upward momentum after a break-out from a resistance level at 0.7185 (now a key support). Currently, it is trading at levels above both the 20-period and 50-period moving averages while targeting the first upside target at 0.7260 (around the high of March 19). The relative strength index is well directed in the 70s, indicating strong upward momentum for the pair. Upon crossing 0.7260, the next upside target at 0.7280 would come into sight.

    The black line shows the pivot point. Currently, the price is above the pivot point which is a signal for long positions. If it remains below the pivot point, it will indicate short positions. The red lines show the support levels, while the green line indicates the resistance levels. These levels can be used to enter and exit trades.

    Resistance levels: 0.7260, 0.7305, and 0.7350.
    Support levels: 0.7150, 0.7125, and 0.7100.

    Analysis are provided byInstaForex.
    Best regards, PR Manager
    Learn more about InstaForex Company at http://instaforex.com

  7. #167
    Senior Member InstaForex Gertrude's Avatar
    Join Date
    Sep 2015
    Posts
    1,885
    Daily analysis of EUR/JPY for March 23, 2018


    EUR/JPY
    The long-awaited bearish bias has already surfaced on this cross. The price plunged yesterday, breaching the supply zone at 129.50 to the downside. The demand zone at 129.00 was tested before the price bounced upwards (temporarily). The demand zone at 129.00 would be tested once again, and get broken to the downside, as the market moves further downwards.

    There is a Bearish Confirmation Pattern in the market, and it has become clearer as price goes further downwards owing to a bearish outlook on the cross. The EMA 11 is below the EMA 56, and the RSI period 14 is below the level 50.

    Analysis are provided byInstaForex.
    Best regards, PR Manager
    Learn more about InstaForex Company at http://instaforex.com

  8. #168
    Senior Member InstaForex Gertrude's Avatar
    Join Date
    Sep 2015
    Posts
    1,885
    Daily analysis of EUR/JPY for March 26, 2018

    EUR/JPY
    The conditions in the market is quite choppy. Although the market is choppy, the bearish trend has been maintained.Price has been going southward since February 5, having lost almost 800 pips since then. Last week, there was a rally attempt in the context of an uptrend, which was halted once the supply zone at 131.50 had been tested.


    Further upward movement was effectively prevented. The market shed 250 pips following that, to test the demand zone at 129.00, and closed below the supply zone at 129.50. The expected weakness in EUR, as well as the bearish outlook on the market, may enable the demand zones at 129.00, 128.50, and 128.00 to be tested this week.

    Analysis are provided byInstaForex.
    Best regards, PR Manager
    Learn more about InstaForex Company at http://instaforex.com

  9. #169
    Senior Member InstaForex Gertrude's Avatar
    Join Date
    Sep 2015
    Posts
    1,885
    Daily analysis of GBP/USD for March 27, 2018

    The pair stays strong in the short-term as the price action is consolidating above the support zone of 1.4136. Currently, GBP/USD is facing off the resistance level of 1.4225, which is the last hurdle ahead of the 1.4269 level and if it manages to break above such area, the bulls could strengthen in the short-term. MACD indicator remains in the positive territory, favoring to the bulls.


    H1 chart's resistance levels: 1.4225 / 1.4269
    H1 chart's support levels: 1.4136 / 1.4061

    Trading recommendations for today: Based on the H1 chart, buy (long) orders only if the GBP/USD pair breaks a bullish candlestick; the resistance level is at 1.4225, take profit is at 1.4269 and stop loss is at 1.4185.

    Analysis are provided byInstaForex.
    Best regards, PR Manager
    Learn more about InstaForex Company at http://instaforex.com

  10. #170
    Member
    Join Date
    Sep 2015
    Posts
    94
    Technical analysis: Intraday level for USD/JPY, March 28, 2018


    Today Japan will not release any Economic Data, but the US will release some Economic Data such as Crude Oil Inventories, Pending Home Sales m/m, Prelim Wholesale Inventories m/m, Goods Trade Balance, Final GDP Price Index q/q, and Final GDP q/q. So, there is a probability the USD/JPY will move with a low to medium volatility during this day.

    TODAY'S TECHNICAL LEVEL:

    Resistance. 3: 106.13.
    Resistance. 2: 105.92.
    Resistance. 1: 105.72.
    Support. 1: 105.45.
    Support. 2: 105.25.
    Support. 3: 105.04.

    Disclaimer: Trading Forex (foreign exchange) on margin carries a high level of risk, and may not be suitable for all Traders or Investors. The high degree of leverage can work against you as well as for you. Before deciding to invest in foreign exchange you should carefully consider your investment objectives, level of experience, and risk appetite. The possibility exists that you could sustain a loss of some or all of your initial investment and therefore you should not invest money that you cannot afford to lose. You should be aware of all the risks associated with foreign exchange trading, and seek advice from an independent financial advisor if you have any doubts.

    *The market analysis posted here is meant to increase your awareness, but not to give instructions to make a trade.

Page 17 of 164 FirstFirst ... 7 15 16 17 18 19 27 67 117 ... LastLast

Tags for this Thread

Bookmarks

Posting Permissions

  • You may not post new threads
  • You may not post replies
  • You may not post attachments
  • You may not edit your posts
  •