Page 74 of 164 FirstFirst ... 24 64 72 73 74 75 76 84 124 ... LastLast
Results 731 to 740 of 1634

Wave Analysis by InstaForex

This is a discussion on Wave Analysis by InstaForex within the Analytics and News forums, part of the Trading Forum category; Forecast for EUR/USD on August 17, 2020 EUR/USD The euro continued to develop in the uncertain range of 1.1712-1.1903 on ...


  1. #731
    Senior Member InstaForex Gertrude's Avatar
    Join Date
    Sep 2015
    Posts
    1,885
    Forecast for EUR/USD on August 17, 2020

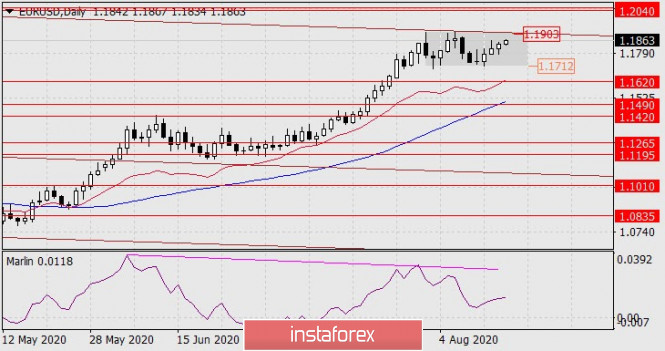
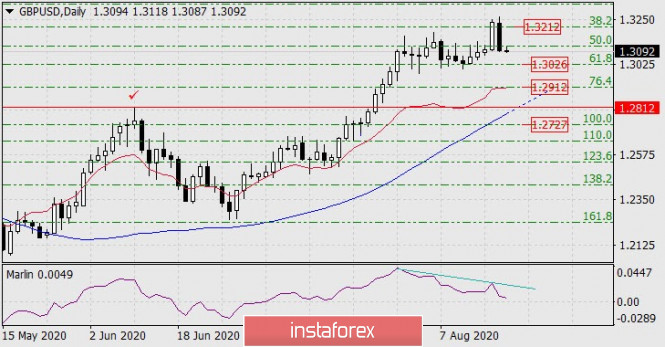
    EUR/USD The euro continued to develop in the uncertain range of 1.1712-1.1903 on Friday. The euro will continue to increase if the price goes above the upper limit of the price channel at 1.1903, and in this case, the target range will be 1.2040/55. Historically, the range corresponds to the low of July 2012. The price reaching the specified range can also mean that a double diverenge on the Marlin oscillator can form. That is, the euro growing by two figures will not cancel the main scenario of a currency reversal in the medium and long term.


    The price falling below the lower border of the range will mean that it is out of the free roaming zone and the first target will be the level of 1.1620, then 1.1490. The price divergence with the Marlin oscillator will increase, the signal line will enter the zone of negative values, and this will lead to an accelerated fall in the euro.


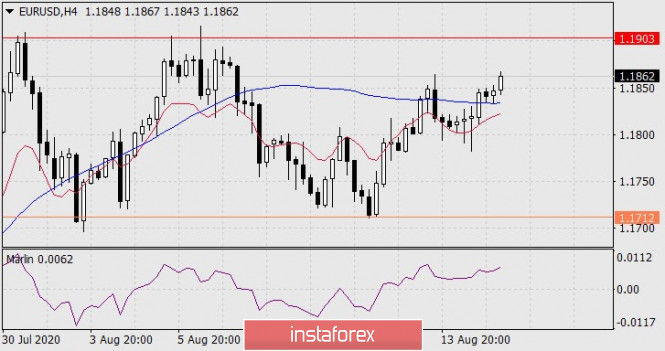
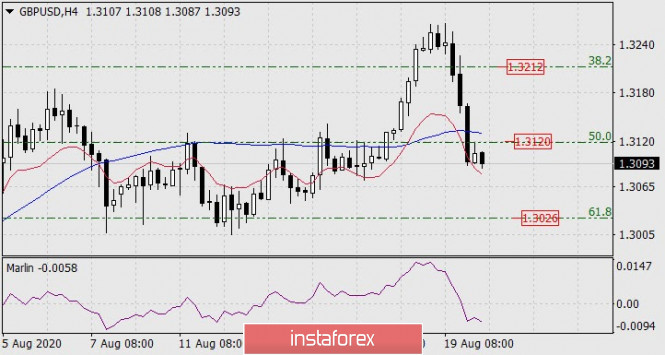
    The price consolidated above the MACD indicator line on the four-hour chart, Marlin is also in the growth zone, which together maintains an increased probability of growth to 1.1903. Nevertheless, since the price is in the free roaming zone, it can once again go under this line, as it was on August 13-14. We are waiting for the development of events.

    Analysis are provided byInstaForex.
    Best regards, PR Manager
    Learn more about InstaForex Company at http://instaforex.com

  2. #732
    Senior Member InstaForex Gertrude's Avatar
    Join Date
    Sep 2015
    Posts
    1,885
    Forecast for USD/JPY on August 18, 2020

    USD/JPY
    The Japanese yen sharply accelerated the pace of its strengthening (decline on the chart) after breaking the MACD line on a daily chart. There are about 20 points left to the nearest goal along the 105.45 price channel. The signal line of the Marlin oscillator has entered the negative trend zone, which creates the risk of continuing to pull down the price to the second target of 104.60.

    The price has consolidated below the MACD indicator line on the four-hour chart, which also increases the likelihood of overcoming the 105.45 level. But the Marlin oscillator is already entering the oversold zone, which may be a signal for a reversal from the first target level of 105.45.

    So: if the price settles below the 105.45 level, we are waiting for the price to fall to the second target of 104.60, consolidating the price above 106.12 will mean restoring growth to 106.70 with a repeated attempt to overcome 107.00.

    Analysis are provided byInstaForex.
    Best regards, PR Manager
    Learn more about InstaForex Company at http://instaforex.com

  3. #733
    Senior Member InstaForex Gertrude's Avatar
    Join Date
    Sep 2015
    Posts
    1,885
    Analysis and trading recommendations for the EUR/USD pair on August

    Trading recommendations for EUR / USD on August 19 Analysis of transactions Bulls were active at the level of 1.1895 yesterday, as a result of which the quote reached the target level of 1.1933. Such brought profit of about 35 pips within the day.


    This sharp rise in the euro came after US Treasury Secretary Steven Mnuchin said that there was no expected progress in the negotiations between Republicans and Democrats with regards to a new stimulus package.


    Set up buy deals when the quote reaches the price level of 1.1954 (green line on the chart), targeting a rise towards the level of 1.1999. The increase may occur, on the grounds of good inflation data in the eurozone. Take profit at the level of 1.1999. Meanwhile, sell positions after the quote hits a price level of 1.1911 (red line on the chart), aiming a drop to a price of 1.1858. However, such a scenario has a low chance of occurring since aside from inflation data, the latest Fed protocol will also be published today, the contents of which is forecast to put additional pressure on the US dollar. Nonetheless, take profit at the level of 1.1858.

    Analysis are provided byInstaForex.
    Best regards, PR Manager
    Learn more about InstaForex Company at http://instaforex.com

  4. #734
    Senior Member InstaForex Gertrude's Avatar
    Join Date
    Sep 2015
    Posts
    1,885
    Forecast for GBP/USD on August 20, 2020

    GBP/USD After the British pound gained 135 points on Wednesday and Thursday, this growth was offset by a fall of 140 points. This figure of two extreme candlesticks is called the pattern of rails, a reversal pattern. Also, the Marlin Oscillator formed a divergence with the price.


    The closest target for the pound is the 61.8% Fibonacci level at 1.3026, where the British currency has already found support in the period from August 3 to 13. That is, the level is strong enough, and breaking it will send the price to the second target of 1.2912 (76.4% Fibonacci). The main struggle will unfold on the daily MACD line in the 1.2812 area, which is also the price peak from June 10. Overcoming this level reveals the scenario of a medium-term fall of the British currency.


    The price settled below the Fibonacci level of 50.0% on the four-hour chart and below the MACD indicator line, which clears the way for the price to 1.3026.


    Analysis are provided byInstaForex.
    Best regards, PR Manager
    Learn more about InstaForex Company at http://instaforex.com

  5. #735
    Senior Member InstaForex Gertrude's Avatar
    Join Date
    Sep 2015
    Posts
    1,885
    Technical Analysis of EUR/USD for August 21, 2020

    Technical Market Outlook:
    The EUR/USD pair has bounced from the level of 1.1803 which is still a technical support for the price and had retraced 50% of the last wave down already. The momentum is positive and the market is bouncing from the oversold conditions, so another wave up is still on the table befroe the week ends. The next target for bulls is seen at the level of 1.1908 - 1.1915 and the immediate technical support is located at the level of 1.1822, 1.1813, 1.1803 and 1.1790. The larger time frmae trend remains up.

    Weekly Pivot Points:
    WR3 - 1.2065
    WR2 - 1.1962
    WR1 - 1.1908
    Weekly Pivot - 1.1808
    WS1 - 1.1753
    WS2 - 1.1661
    WS3 - 1.1600

    Trading Recommendations:
    On the EUR/USD pair the main trend is up, which can be confirmed by 8 weekly up candles on the weekly time frame chart and 3 monthly up candles on the monthly time frame chart. This means any corrections should be used to buy the dips. The key long-term technical support is seen at the level of 1.1445. The key long-term technical resistance is seen at the level of 1.2555.


    Analysis are provided byInstaForex.
    Best regards, PR Manager
    Learn more about InstaForex Company at http://instaforex.com

  6. #736
    Senior Member InstaForex Gertrude's Avatar
    Join Date
    Sep 2015
    Posts
    1,885
    Technical Analysis of EUR/USD for August 24, 2020

    Technical Market Outlook:
    The EUR/USD pair dropped below 61% Fibonacci retracement level again and made a new local low at the level of 1.1754. The market is still in a horizontal trading range, so the bulls still have a chance to bounce higher. The next target for them is seen at the level of 1.1822 and 1.1882. In order to make a new high, the bulls will have to break through the short-term trend line resistance seen at the level of 1.1900. The immediate technical support is located at the level of 1.1720 and 1.1710. The larger time frame trend remains up.

    Weekly Pivot Points:
    WR3 - 1.2107
    WR2 - 1.2031
    WR1 - 1.1883
    Weekly Pivot - 1.1825
    WS1 - 1.1682
    WS2 - 1.1616
    WS3 - 1.1470

    Trading Recommendations:
    On the EUR/USD pair the main trend is up, which can be confirmed by 8 weekly up candles on the weekly time frame chart and 3 monthly up candles on the monthly time frame chart. This means any corrections should be used to buy the dips. The key long-term technical support is seen at the level of 1.1445. The key long-term technical resistance is seen at the level of 1.2555.


    Analysis are provided byInstaForex.
    Best regards, PR Manager
    Learn more about InstaForex Company at http://instaforex.com

  7. #737
    Senior Member InstaForex Gertrude's Avatar
    Join Date
    Sep 2015
    Posts
    1,885
    Technical Analysis of ETH/USD for August 25, 2020

    Crypto Industry News:

    Coinbase and Apple are still not getting along months after Coinbase warned customers it might remove the app from the Apple Store.

    Coinbase CEO Brian Armstrong tweeted that Apple continues to block some cryptocurrency features, including the ability to make money and unlimited decentralized applications (dApp) of the browser:

    "Apple has been very restrictive and hostile to cryptocurrencies over the years. They still block some features now, including the ability to make money with cryptocurrency through task execution and unlimited Dapp browsers," Armstrong said.

    In December, Coinbase warned its customers that it might be necessary to remove the dApp browser from its app to comply with Apple App Store policies. At the time, both Apple and the Google Play Store with Android apps wanted to remove dApps from their network.

    Apple, especially its App Store, has been under fire recently due to unfair terms it imposes on app developers and publishers. The Wall Street Journal, The New York Times and game developer Epic Games have called on Apple to find fairer conditions for developers.

    Technical Market Outlook:
    The ETH/USD pair has hit the target seen at the level of $407.03 - $414.11 with a local top at the level of $409.67 and then was capped. Currently, the price is trading below the level of $400 and the next target for bears is seen at the level of $396.45 (itraday techncial support). The momentum keeps increasing as the market bounces from the oversold conditions as well. All the bigger time frame charts looks very bullish and the up trend should be continued after the correction is completed.

    Weekly Pivot Points:
    WR3 - $491.79
    WR2 - $470.70
    WR1 - $424.12
    Weekly Pivot - $402.20
    WS1 - $357.21
    WS2 - $333.72
    WS3 - $286.54

    Trading Recommendations:
    The weekly and monthly time frame trend on the ETH/USD pair remains up and there are no signs of trend reversal, so buy orders are preferred in the mid-term. All the dynamic corrections are still being used to buy the dips. The next mid-term target for bulls is seen at the level of $500. The key mid-term technical support is seen at the level of $364.95.


    Analysis are provided byInstaForex.
    Best regards, PR Manager
    Learn more about InstaForex Company at http://instaforex.com

  8. #738
    Senior Member InstaForex Gertrude's Avatar
    Join Date
    Sep 2015
    Posts
    1,885
    Technical Analysis of ETH/USD for August 26, 2020

    Crypto Industry News:
    The People's Bank of China plans to use its digital currency at the 2022 Winter Olympics in Beijing.

    According to a Reuters report, Sun Guofeng, head of the PBoC's monetary policy department, said the bank did not have a schedule to introduce digital currency. However, according to Sun's statement, the PBoC will likely launch it ahead of the 2022 Winter Olympics as they plan to use it at an international sporting event.

    The news comes as China is ramping up pilot projects for the digital yuan. Currently, China's central bank is testing its digital currency in Shenzhen, Suzhou, Xiongan and Chengdu. The bank also planned to introduce a digital currency for pilot tests in other regions, including Beijing, Tianjin, Hebei and the Greater Bay area of Hong Kong.

    A recent official statement from the bank also noted that the digital yuan was only tested for small retail transactions. Debunking rumors about the impossibility of converting digital currency into banknotes, the central bank also clarified that digital yuan is legal tender that users can convert into banknotes at a 1: 1 ratio.

    While there is still too little information on the Chinese digital currency to say anything about its launch and use cases, it is fairly obvious that the bank is making rapid progress towards its introduction.

    Technical Market Outlook:
    The ETH/USD pair has made another lower low at the level of $369.51, which was in line with 1:1 market geometry target for correction. Currently, the bulls are trying to bounce higher towards the level of $400 in order to reclaim it again, but if they fail, then a new local low should be made. The intraday technical support is seen at the level of $375.62 and the nearest technical resistance is seen at the level of $385.98. All the bigger time frame charts looks very bullish and the up trend should be continued after the correction is completed.

    Weekly Pivot Points: WR3 - $491.79
    WR2 - $470.70
    WR1 - $424.12
    Weekly Pivot - $402.20
    WS1 - $357.21
    WS2 - $333.72
    WS3 - $286.54

    Trading Recommendations:
    The weekly and monthly time frame trend on the ETH/USD pair remains up and there are no signs of trend reversal, so buy orders are preferred in the mid-term. All the dynamic corrections are still being used to buy the dips. The next mid-term target for bulls is seen at the level of $500. The key mid-term technical support is seen at the level of $364.95.


    Analysis are provided byInstaForex.
    Best regards, PR Manager
    Learn more about InstaForex Company at http://instaforex.com

  9. #739
    Senior Member InstaForex Gertrude's Avatar
    Join Date
    Sep 2015
    Posts
    1,885
    Technical Analysis of ETH/USD for August 26, 2020


    Crypto Industry News:
    The People's Bank of China plans to use its digital currency at the 2022 Winter Olympics in Beijing.

    According to a Reuters report, Sun Guofeng, head of the PBoC's monetary policy department, said the bank did not have a schedule to introduce digital currency. However, according to Sun's statement, the PBoC will likely launch it ahead of the 2022 Winter Olympics as they plan to use it at an international sporting event.

    The news comes as China is ramping up pilot projects for the digital yuan. Currently, China's central bank is testing its digital currency in Shenzhen, Suzhou, Xiongan and Chengdu. The bank also planned to introduce a digital currency for pilot tests in other regions, including Beijing, Tianjin, Hebei and the Greater Bay area of Hong Kong.

    A recent official statement from the bank also noted that the digital yuan was only tested for small retail transactions. Debunking rumors about the impossibility of converting digital currency into banknotes, the central bank also clarified that digital yuan is legal tender that users can convert into banknotes at a 1: 1 ratio.

    While there is still too little information on the Chinese digital currency to say anything about its launch and use cases, it is fairly obvious that the bank is making rapid progress towards its introduction.

    Technical Market Outlook:
    The ETH/USD pair has made another lower low at the level of $369.51, which was in line with 1:1 market geometry target for correction. Currently, the bulls are trying to bounce higher towards the level of $400 in order to reclaim it again, but if they fail, then a new local low should be made. The intraday technical support is seen at the level of $375.62 and the nearest technical resistance is seen at the level of $385.98. All the bigger time frame charts looks very bullish and the up trend should be continued after the correction is completed.
    Weekly Pivot Points:
    WR3 - $491.79
    WR2 - $470.70
    WR1 - $424.12
    Weekly Pivot - $402.20
    WS1 - $357.21
    WS2 - $333.72
    WS3 - $286.54

    Trading Recommendations: The weekly and monthly time frame trend on the ETH/USD pair remains up and there are no signs of trend reversal, so buy orders are preferred in the mid-term. All the dynamic corrections are still being used to buy the dips. The next mid-term target for bulls is seen at the level of $500. The key mid-term technical support is seen at the level of $364.95.

    Analysis are provided byInstaForex.
    Best regards, PR Manager
    Learn more about InstaForex Company at http://instaforex.com

  10. #740
    Senior Member InstaForex Gertrude's Avatar
    Join Date
    Sep 2015
    Posts
    1,885
    Forecast for USD/JPY on August 28, 2020


    USD/JPY
    The yen managed to gather strength and reach the nearest target of 106.65 even faster than we expected – we were waiting for the price at this level today, but it hit the level on Thursday. At the moment, the price is already attacking the target level of 107.00. The Marlin oscillator is on a path of optimal growth, price left above balance indicator line (red) that speaks about the growth's strength and, accordingly, we expect the nearest level to be overcome and also a short correction from the second target of 107.35, that is, from the upper borders of consolidation 9-22 July.


    The price settled above both indicator lines on the four-hour chart, the Marlin oscillator is growing, and we are waiting for the price to continue growing to the specified levels.

    Analysis are provided byInstaForex.
    Best regards, PR Manager
    Learn more about InstaForex Company at http://instaforex.com

Page 74 of 164 FirstFirst ... 24 64 72 73 74 75 76 84 124 ... LastLast

Tags for this Thread

Bookmarks

Posting Permissions

  • You may not post new threads
  • You may not post replies
  • You may not post attachments
  • You may not edit your posts
  •