Page 68 of 164 FirstFirst ... 18 58 66 67 68 69 70 78 118 ... LastLast
Results 671 to 680 of 1634

Wave Analysis by InstaForex

This is a discussion on Wave Analysis by InstaForex within the Analytics and News forums, part of the Trading Forum category; Forecast for EUR/USD on May 22, 2020 EUR/USD The euro grew during the first half of Thursday due to optimistic ...


  1. #671
    Senior Member InstaForex Gertrude's Avatar
    Join Date
    Sep 2015
    Posts
    1,885
    Forecast for EUR/USD on May 22, 2020

    EUR/USD
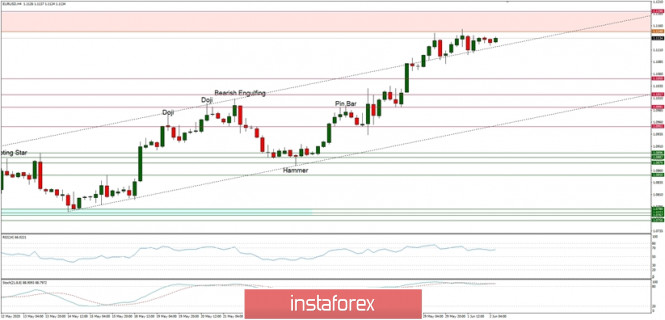
    The euro grew during the first half of Thursday due to optimistic rates of European business activity for the current month: Manufacturing PMI of the euro area grew from 33.4 to 39.5, Services PMI showed even greater dynamics - an increase from 12.0 to 28.7. The euro has decisively reversed since the US session opened. US PMIs came out better than expected, but not as much as we expected: Manufacturing PMI grew from 36.1 to 39.8 against 39.3, Services PMI grew from 26.7 to 36.9 with 32.6 expected. Nevertheless, the trading volumes were comparable to those observed on May 18, which indicates a massive closure of purchases and even the opening of sales. A more interesting story awaits us next week, when sales of new housing, orders for durable goods, incomes and expenses of consumers will be published in the US.


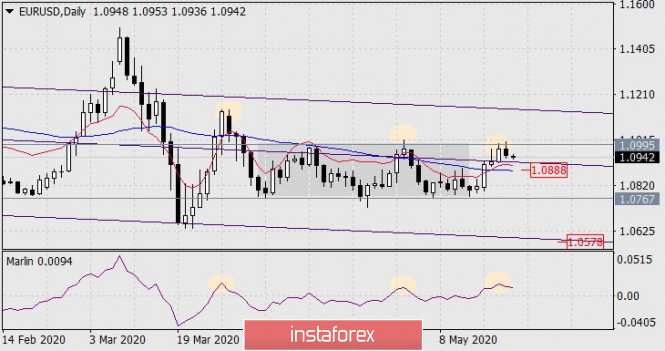
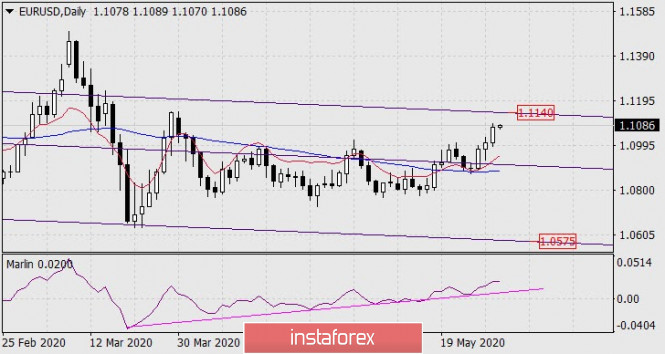
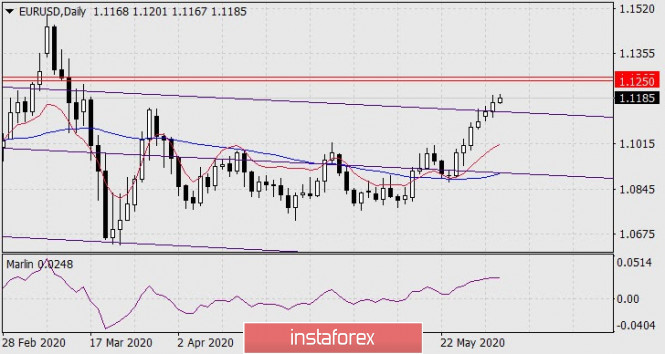
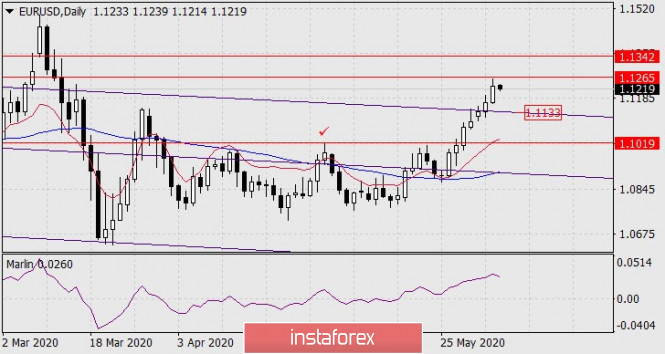
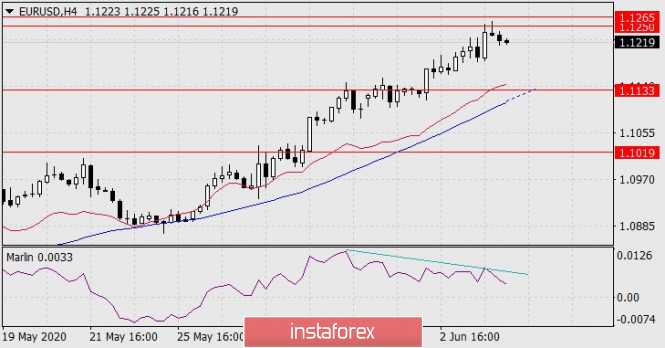
    The price was re-marked at the upper border of the price range and with the turn of the oscillator, Marlin headed down on the daily chart. The closest support for the price is the price channel line at 1.0918, below it is the MACD indicator line at 1.0888, overcoming it will confirm the euro's intention to go much deeper down to 1.0767 and 1.0578.


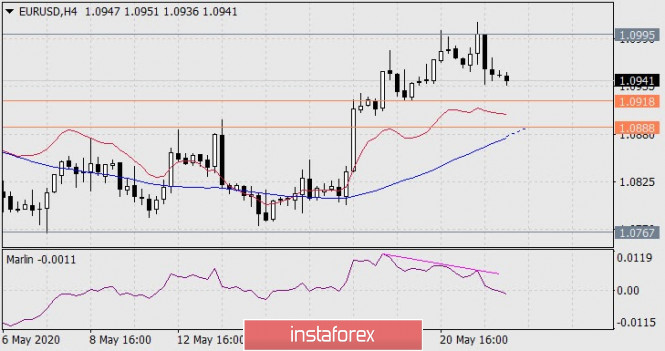
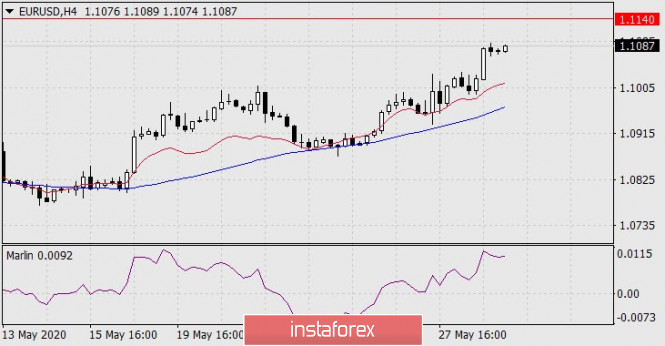
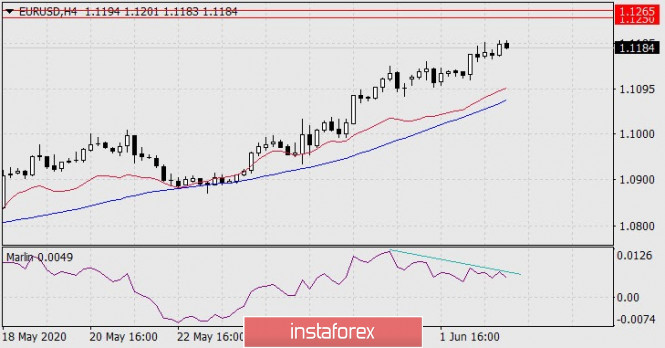
    The signal line of the Marlin oscillator penetrated into the downward trend zone after forming a double divergence on the four-hour chart. The closest target is the 1.0888 level, at which the MACD lines coincide on both scopes. Consolidation under the level opens the way to the lower border of the range 1.0767.

    *The market analysis posted here is meant to increase your awareness, but not to give instructions to make a trade.

    Analysis are provided byInstaForex.
    Best regards, PR Manager
    Learn more about InstaForex Company at http://instaforex.com

  2. #672
    Senior Member InstaForex Gertrude's Avatar
    Join Date
    Sep 2015
    Posts
    1,885
    Technical Analysis of BTC/USD for May 26, 2020:


    Crypto Industry News:
    New strict rules, in which many ways of using digital resources are punishable by a fine or imprisonment, may soon become law in Russia.

    New bills specifying how Russia should regulate cryptocurrencies were sent to the parliament of the country, the State Duma, earlier this week. Although the official site for the planned regulations has not yet been updated, both documents were published in the OrderCom telegram channel and were confirmed as authentic by the sources of the Russian news channel RBK.

    Legislative proposals were reportedly written by employees of the Digital Economy think tank and the Skolkovo business accelerator. They are looking for a new version of the Digital Resources Act that has been stuck in the Duma for over two years, as well as cryptocurrency-oriented additions to the national criminal code.

    The first bill would regulate digital currencies in Russia, or more precisely, prohibit the issuance and operation of digital currencies. It would even be forbidden to disseminate information on such activities.

    Individuals and companies will not be able to accept digital currencies as payments, unless they are inherited, transferred to the debtors of a bankrupt company or confiscated as a result of a court decision. People with cryptocurrency should declare it at the tax office, as well as provide information on how to buy.

    A second draft would introduce a new article in the Criminal Code imposing sanctions for illegal operations using digital resources. If the regulations are adopted, the issue of digital assets in Russia without permission to enter in the register, which is yet to be created in the central bank of this country, will result in a fine of up to two million rubles (almost $ 28,000). The same level of penalty is suggested for organizing operations with digital resources and cryptocurrencies without permission, while people would face fines of up to $ 2,800.

    Buying a cryptocurrency for cash or a bank transfer from a Russian bank would be subject to a fine of up to one million Russian rubles ($ 14,000) or up to seven years in prison, depending on the scale of the contract. A similar penalty would apply to those who accept crypto for goods and services.

    If such a business brings "particularly large" profits or particularly large damage to citizens and the state, the proposal would cause the person (s) involved to be imprisoned for up to seven years, or even forced labor.

    Mention of the central bank register suggests that legislators are free to some officially sanctioned entities to issue and use digital assets, while most general operations would be banned.

    According to the RBK report, Anatoly Aksakov, head of the Duma of the Financial Markets Commission, confirmed the authenticity of the documents, but stated that they had not been finalized.

    Technical Market Outlook:
    The BTC/USD pair has bounced from the level of $8,576 after breaking through the key trend line support located around the level of $8,800. The bounce is so far very shallow and the next the nearest resistance is located at the level of $8,919 and $9,013. On the other hand, the next technical support is seen at the level of $8,464 and $8,357.The momentum remains weak and negative, so the odds for another wave down are high.

    Weekly Pivot Points:
    WR3 - $10,568
    WR2 - $10,245
    WR1 - $9,478
    Weekly Pivot - $9,098
    WS1 - $8,333
    WS2 - $7,968
    WS3 - 7,231

    Trading Recommendations:
    The larger time frame trend remains down and as long as the level of $10,791 is not violated, all rallies will be treated as a counter-trend corrective moves. This is why the short positions are now more preferred until the level of $10,791 is clearly violated. The key mid-term technical support is located at the level of $7,897.

    *The market analysis posted here is meant to increase your awareness, but not to give instructions to make a trade.

    Analysis are provided byInstaForex.
    Best regards, PR Manager
    Learn more about InstaForex Company at http://instaforex.com

  3. #673
    Senior Member InstaForex Gertrude's Avatar
    Join Date
    Sep 2015
    Posts
    1,885
    Elliott wave analysis of EUR/GBP for May 27, 2020


    EUR/GBP is finally back to test the neckline support at 0.8866. This former resistance which now acts as support should be able to protect the downside for renewed upside pressure through minor resistance at 0.8930 indicating the next impulsive rally towards 0.9065 on the way higher to and above the peak at 0.9495.

    In the short-term, we should see a final dip to test the key-support at 0.8866 before EUR/GBP will be ready to turn higher again.
    R3: 0.9000
    R2: 0.8955
    R1: 0.8930
    Pivot: 0.8910
    S1: 0.8880
    S2: 0.8866
    S3: 0.8844

    Trading recommendation:
    We are long EUR from 0.8760 and our stop is placed at 0.8815.

    *The market analysis posted here is meant to increase your awareness, but not to give instructions to make a trade.

    Analysis are provided byInstaForex.
    Best regards, PR Manager
    Learn more about InstaForex Company at http://instaforex.com

  4. #674
    Senior Member InstaForex Gertrude's Avatar
    Join Date
    Sep 2015
    Posts
    1,885
    Forecast for GBP/USD on May 28, 2020

    GBP/USD
    The British pound lost 70 points on Wednesday due to investors' concerns regarding the Bank of England's lower rates towards the negative area. The current rate of the BoE is 0.10%. In addition, UK Brexit negotiator David Frost announced the country's refusal to extend the transition period ending at the end of this year and actually reported the failure of the current stage of negotiations.


    The pound's growth on the daily chart was suspended on the balance indicator line. Currently, the price is at the Fibonacci level of 161.8%. But the price is higher than the MACD indicator line, consolidated above it, and if the signal line of the Marlin oscillator moves to the zone of positive values, the upward trend can be restored with the immediate target of 1.2540 at the Fibonacci level of 123.6%.

    The price may return to the downward trend after the price goes below the MACD line (1.2165 - match with the April 7 low). Decreasing goals are also determined by Fibonacci levels: 1.1935, 1.1750.


    The price develops between two signal levels on the H4 chart: its exit above 1.2362 - yesterday's high, opens up the prospect of growth to 1.2540, consolidation below 1.2165 opens the first bearish target of 1.1935.

    *The market analysis posted here is meant to increase your awareness, but not to give instructions to make a trade.

    Analysis are provided byInstaForex.
    Best regards, PR Manager
    Learn more about InstaForex Company at http://instaforex.com

  5. #675
    Senior Member InstaForex Gertrude's Avatar
    Join Date
    Sep 2015
    Posts
    1,885
    Forecast for EUR/USD on May 29, 2020

    EUR/USD
    Yesterday, investors' expectations for positive US data did not materialize. The volume of orders for durable goods fell by 17.2% in April after a previous drop of 14.7%. The forecast was -19.0%, but of -17.2% optimism, of course, does not cause. The second estimate of GDP for the first quarter was revised down from -4.8% to -5.0% against the forecast without change (i.e. -4.8%). As a result, the dollar index lost -0.47%, the euro grew by 68 points, the S&P 500 fell by 0.21%. Macro statistics do not have to wait for optimism to an even greater extent today. The forecast for personal incomes of consumers for April is -7.0%, for personal expenses -12.6% versus the March contraction of -7.5%. The index of business activity in the manufacturing sector of the Chicago region in May is expected to increase from 35.4 to 40.1, but here (in the spirit of the times) there is a great emotional component, so the data may turn out to be worse.


    The euro is moving towards its first target of 1.1140 on the daily chart. Whether there will be a price reversal from this level or the euro will continue to grow higher is currently not clear, since there are no prerequisites for technical signs in any direction. Price in a local situation is a leading factor, indicators in a guided position.


    The price and indicators are growing on the H4 chart, there are no signs of a reversal. We are waiting for the price on the embedded line of the price channel of 1.1140.

    *The market analysis posted here is meant to increase your awareness, but not to give instructions to make a trade.

    Analysis are provided byInstaForex.
    Best regards, PR Manager
    Learn more about InstaForex Company at http://instaforex.com

  6. #676
    Senior Member InstaForex Gertrude's Avatar
    Join Date
    Sep 2015
    Posts
    1,885
    Technical Analysis of ETH/USD for June 1, 2020:


    Company does not offer investment advice and the analysis performed does not guarantee results. The market analysis posted here is meant to increase your awareness, but not to give instructions to make a trade.

    Crypto Industry News:
    The Cyble Research Team has conducted research that showed that data on more than 80,000 credit cards around the world has been put up for sale at Darknet.

    According to the information, the data leakage concerned credit card users from various countries, such as the United States (33,000), France (14,000), Australia (5,000), United Kingdom (5,000), Canada (2,000) .), Singapore (1.2 thousand) and India (1.3 thousand). According to the message from Cyble, these are both Visa and Matercard. Each of them contains the cardholder's surname, CVV number and expiry date. The price of these cards is $ 5 in crypto, and is independent of their value in a world outside of Darknet.

    According to research, information about the countries where the cards come from was disclosed due to a billing data leak. This information included the address of each cardholder, making it easier for cyber security companies to determine the country of origin of each card.

    It's not entirely clear where the hackers stole their card details, but Cyble thinks they may come from a phishing site or online stores that the hackers attacked. Cybele created a special search engine so that people could check if their personal data leaked into Darknet. In total, the company's database contains over 40 billion records.

    Technical Market Outlook:
    The ETH/USD pair has been hovering around the level of $235 for all the weekend and made a new local high at the level of $241.06. This level is just in line with the upper parallel channel line, so it might act as a dynamic resistance despite the fact that it was violated recently. The momentum is not increasing at the alarming rate, so some kind of a corrective pull-back is expected. The target level for correction is seen at $225.84, but the larger time-frame trend remains up. The next target for bulls is seen at 261% Fibonacci extension at $247.36.

    Weekly Pivot Points:
    WR3 - $307.85
    WR2 - $277.87
    WR1 - $257.91
    Weekly Pivot - $226.70
    WS1 - $208.30
    WS2 - $176.78
    WS3 - $157.13

    Trading Recommendations:
    The larger time frame trend on Ethereum remains down and as long as the level of $288 is not violated, all rallies will be treated as a counter-trend corrective moves. This is why the short positions are now more preferred. The next key technical support is seen at the level of $174.82.

    Analysis are provided byInstaForex.
    Best regards, PR Manager
    Learn more about InstaForex Company at http://instaforex.com

  7. #677
    Senior Member InstaForex Gertrude's Avatar
    Join Date
    Sep 2015
    Posts
    1,885
    Technical Analysis of EUR/USD for June 2, 2020:


    Technical Market Outlook:
    The EUR/USD pair has been consolidating the recent gains in a narrow zone located between the levels of 1.1148 - 1.1100. The bulls are hovering just below the lower supply zone boundary located between the levels of 1.1148 - 1.1190. Please notice, the market conditions are now overbought and despite the positive and strong momentum the price might start a corrective pull-back towards the nearest technical support located at the level of 1.1050.

    Weekly Pivot Points:
    WR3 - 1.1499
    WR2 - 1.1307
    WR1 - 1.1241
    Weekly Pivot - 1.1045
    WS1 - 1.0959
    WS2 - 1.0772
    WS3 - 1.0680

    Trading Recommendations:
    On the EUR/USD pair the main long term trend is down, but the local up trend continues. The key long-term technical support is seen at the level of 1.0336 and the key long-term technical resistance is seen at the level of 1.1540. Only if one of this levels is clearly violated, the main trend might reverse (1.1540) or accelerate (1.0336).

    Company does not offer investment advice and the analysis performed does not guarantee results. The market analysis posted here is meant to increase your awareness, but not to give instructions to make a trade.

    Analysis are provided byInstaForex.
    Best regards, PR Manager
    Learn more about InstaForex Company at http://instaforex.com

  8. #678
    Senior Member InstaForex Gertrude's Avatar
    Join Date
    Sep 2015
    Posts
    1,885
    Forecast for EUR/USD on June 3, 2020

    EUR/USD
    Risk appetites continue to grow despite protests and riots in the US: S&P 500 gained 0.82% yesterday, gold fell 0.69%, yield on 5-year US government bonds rose from 0.31% to 0, 32% The euro grew by 35 points, gaining a foothold on the daily chart over the trend line of the price channel. Target of 1.1250/65 is open.


    The price is growing in a stable trend on the four-hour chart, but the Marlin oscillator has formed a divergence. With an increase in the price of another 15 points, the divergence can be reorganized into a regular pullback of the indicator (indicator discharge) with the resumption of growth. We are waiting for the price in the specified target range, where it is possible to form a more stable reversal pattern.


    Analysis are provided byInstaForex.
    Best regards, PR Manager
    Learn more about InstaForex Company at http://instaforex.com

  9. #679
    Senior Member InstaForex Gertrude's Avatar
    Join Date
    Sep 2015
    Posts
    1,885
    Forecast for EUR/USD on June 4, 2020

    EUR/USD
    Yesterday, the euro reached the target range of 1.1250/65 and today, with the support of the Marlin oscillator turning down, it is ready to head for a correction. The purpose of the correction is the embedded line of the price channel in the region of 1.1133. Consolidating the price below it opens a deeper target 1.1019 (May 1 high). If the price goes above the upper boundary of the target range of 1.1265, the second bullish target at 1.1342 will open.


    The divergence on the Marlin oscillator still formed on the four-hour chart (yesterday we questioned the formation of this reversal pattern). Target level at 1.1133 coincides with the MACD line, which it is aiming for. Working out this correction level is our main scenario.


    Analysis are provided byInstaForex.
    Best regards, PR Manager
    Learn more about InstaForex Company at http://instaforex.com

  10. #680
    Senior Member InstaForex Gertrude's Avatar
    Join Date
    Sep 2015
    Posts
    1,885
    Forecast for USD/JPY on June 5, 2020

    USD/JPY The dollar continued to grow against the yen yesterday (23 percentage points) despite the decline in stock indices: the S&P 500 was down -0.34%, while the Nikkei 225 is losing -0.32% in the Asian session today. It seems that investors are counting on good US employment data today and continued growth in related markets. If such expectations are met, then with the price overcoming the first target level of 109.50, growth will continue to the second target level of 110.83 (November 2017 low).


    A weak divergence has formed on the Marlin oscillator on the four-hour chart, the structure is more similar to the indicator discharging before further growth. But this pattern is also a harbinger of increased intraday volatility, which is quite consistent with today's release of important US data.


    We are waiting for a clarification of the situation - whether investors will change their minds to buy risk.

    Analysis are provided byInstaForex.
    Best regards, PR Manager
    Learn more about InstaForex Company at http://instaforex.com

Page 68 of 164 FirstFirst ... 18 58 66 67 68 69 70 78 118 ... LastLast

Tags for this Thread

Bookmarks

Posting Permissions

  • You may not post new threads
  • You may not post replies
  • You may not post attachments
  • You may not edit your posts
  •