Page 6 of 164 FirstFirst ... 4 5 6 7 8 16 56 106 ... LastLast
Results 51 to 60 of 1639

Daily Market Analysis By FXOpen

This is a discussion on Daily Market Analysis By FXOpen within the Analytics and News forums, part of the Trading Forum category; AUD/USD and NZD/USD Signaling More Losses AUD/USD is slowly moving lower and it is now trading well below 0.7650. NZD/USD ...


  1. #51
    Junior Member FXOpen Trader's Avatar
    Join Date
    Dec 2020
    Location
    Asia
    Posts
    2,040
    AUD/USD and NZD/USD Signaling More Losses


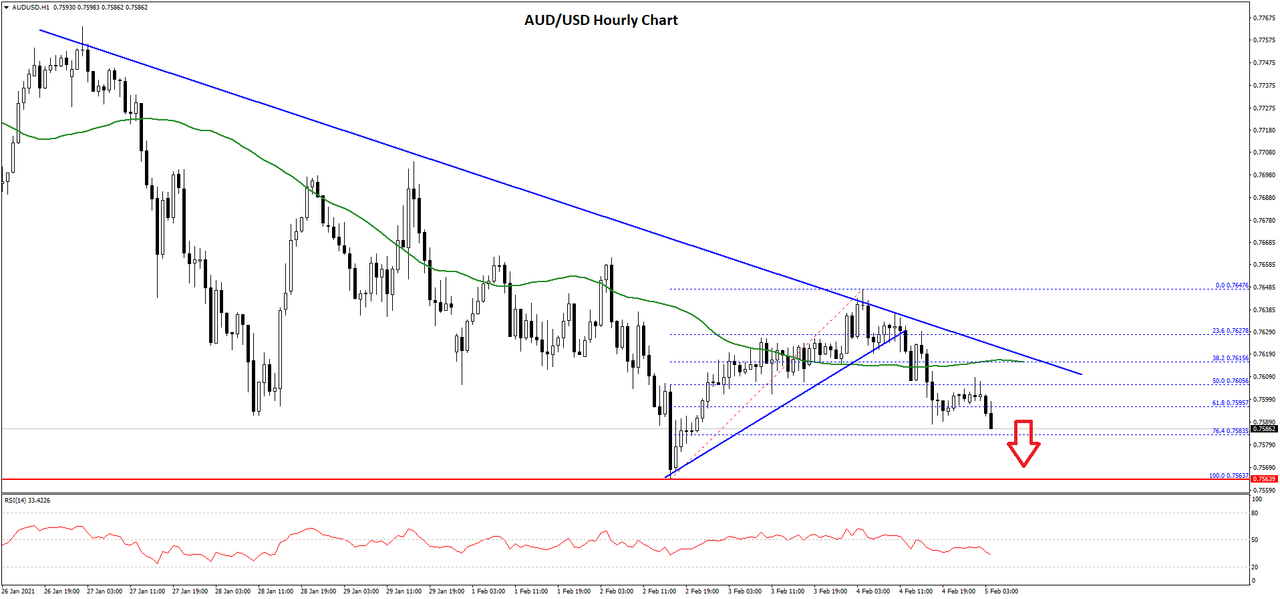
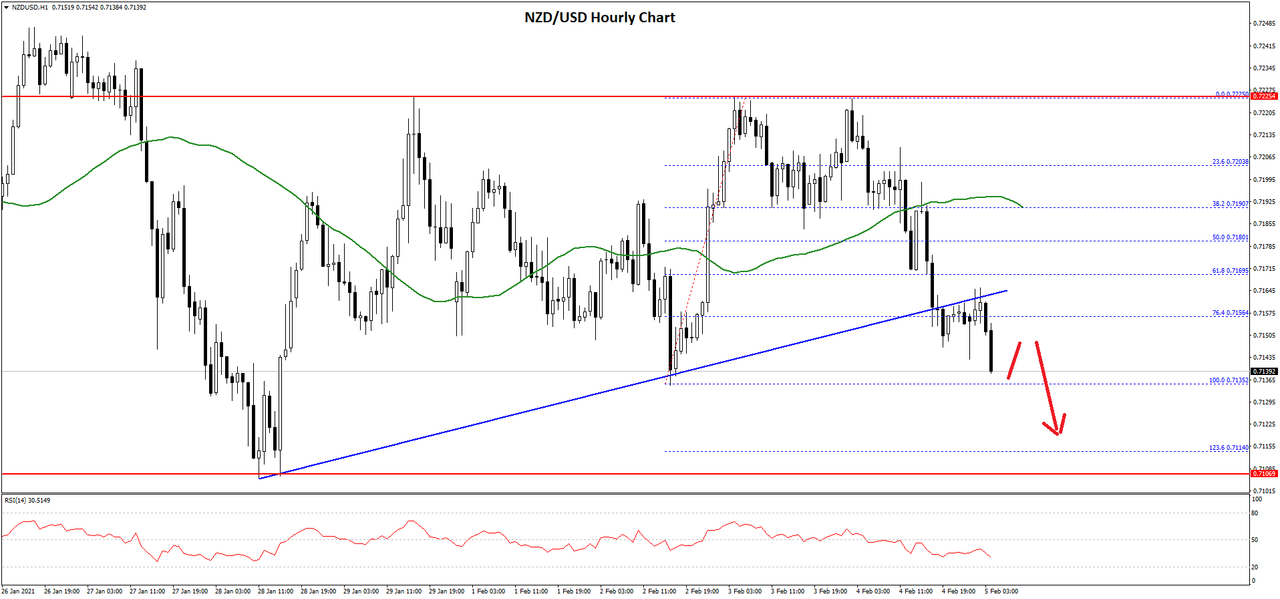
    AUD/USD is slowly moving lower and it is now trading well below 0.7650. NZD/USD is also declining and it seems like it could revisit the 0.7100 support zone.

    Important Takeaways for AUD/USD and NZD/USD

    • The Aussie Dollar started a fresh decline below the 0.7700 and 0.7650 support levels against the US Dollar.
    • There is a key bearish trend line forming with resistance near 0.7615 on the hourly chart of AUD/USD.
    • NZD/USD is also moving lower and it is now trading below the 0.7200 support level.
    • There was a break below a major bullish trend line with support near 0.7160 on the hourly chart of NZD/USD.


    AUD/USD Technical Analysis

    After struggling to gain momentum above the 0.7750 level, the Aussie Dollar started a fresh decline against the US Dollar. The AUD/USD pair broke the 0.7700 support level to move into a bearish zone.

    The pair even cleared the 0.7650 support level and settled below the 50 hourly simple moving average. A low was formed near 0.7563 on FXOpen before the pair corrected higher. It recovered above the 0.7600 level, but there was no clear break above 0.7650.


    As a result, the pair started a fresh decline below the 0.7620 support. The pair even traded below the 50% Fib retracement level of the upward move from the 0.7563 low to 0.7647 high.

    There is also a key bearish trend line forming with resistance near 0.7615 on the hourly chart of AUD/USD. It is now testing the 0.7585 support, which is close to the 76.4% Fib retracement level of the upward move from the 0.7563 low to 0.7647 high.

    If there is a downside break, the pair could test the 0.7550 support. Any more losses may possibly open the doors for a push towards the 0.7500 level.

    On the upside, the 0.7615 level is a major resistance along with the 50 hourly simple moving average. A clear break above the 0.7615 and 0.7620 levels may possibly open the doors for a fresh increase towards 0.7700 in the coming sessions.

    NZD/USD Technical Analysis

    The New Zealand Dollar also followed a similar path after it failed to clear the 0.7220 resistance against the US Dollar. The NZD/USD pair broke the 0.7200 support level to start the current decline.

    The pair broke the 0.7180 support level and settled well below the 50 hourly simple moving average. There was also a break below a major bullish trend line with support near 0.7160 on the hourly chart of NZD/USD.


    The pair is now trading below the 76.4% Fib retracement level of the upward move from the 0.7135 low to 0.7225 high. It is testing the last swing low at 0.7135 and it is likely to continue lower.

    The next key support is near the 0.7110 level. It is close to the 1.236 Fib extension level of the upward move from the 0.7135 low to 0.7225 high. Any more losses could push the pair below the 0.7100 support level.

    Conversely, the pair could attempt to correct higher above the 0.7155 and 0.7160 resistance levels. The main resistance is near the 0.7200 zone. A clear break and close above the 0.7200 level could increase the chances of more gains above the 0.7220 resistance.

    FXOpen Blog

  2. #52
    Junior Member FXOpen Trader's Avatar
    Join Date
    Dec 2020
    Location
    Asia
    Posts
    2,040
    GBP/USD and GBP/JPY: British Pound Eyes More Upsides


    GBP/USD remained strong above 1.3700, but it is facing hurdles near 1.3750. GBP/JPY is gaining momentum and it is trading well above 144.00.

    Important Takeaways for GBP/USD and GBP/JPY

    • The British Pound settled above the 1.3700 resistance zone against the US Dollar.
    • There is a rising channel forming with support near 1.3718 on the hourly chart of GBP/USD.
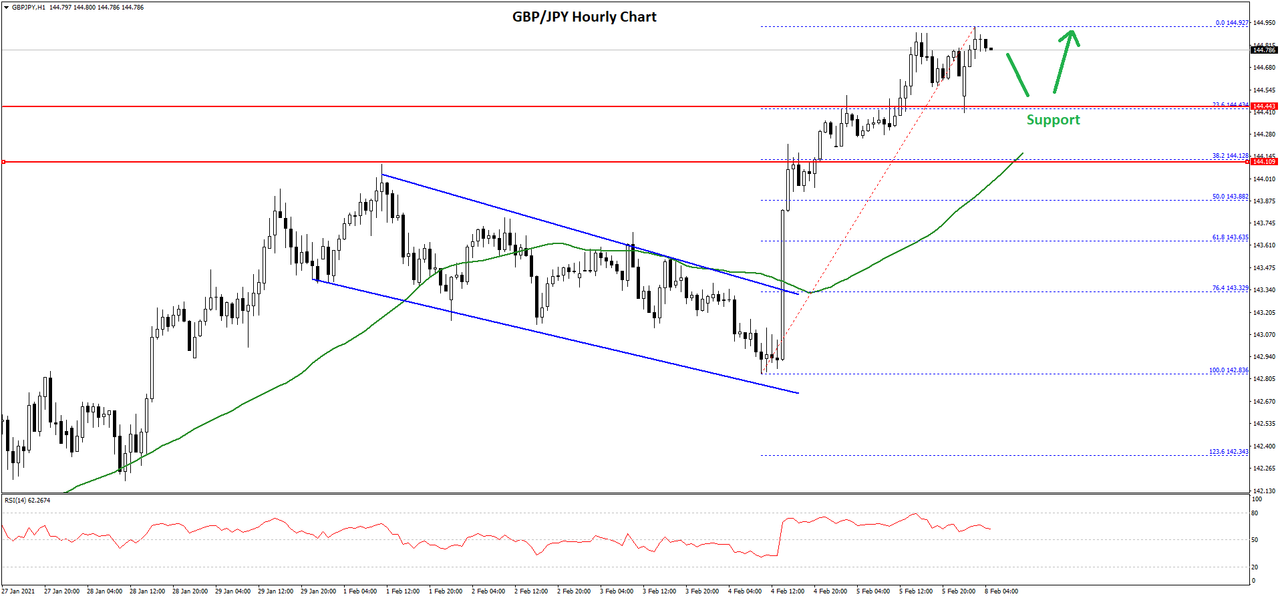
    • GBP/JPY gained momentum after it broke 143.80 and 144.00.
    • There was a break below a major declining channel with resistance near 143.30 on the hourly chart.


    GBP/JPY Technical Analysis


    The British Pound started a strong increase from the 142.80 swing low against the Japanese Yen. The GBP/JPY pair traded above the 143.20 and 143.50 resistance levels to move into a positive zone.

    There break below a major declining channel with resistance near 143.30 on the hourly chart. The pair settled nicely above the 144.00 level and the 50 hourly simple moving average. The pair even cleared the 144.50 resistance zone and it traded close to the 145.00.

    Read Full on FXOpen Company Blog...

  3. #53
    Junior Member FXOpen Trader's Avatar
    Join Date
    Dec 2020
    Location
    Asia
    Posts
    2,040
    Weak NFP Report Responsible for USD Bullish Trend Reversal


    The U.S. dollar traded with a bullish tone since the start of the trading year. While the move higher is not visible on all markets, the most relevant is the EURUSD as the pair eased from 1.23 to 1.20 in less than a month. Because the Euro has the bigger weight in the dollar index, it led to the dollar rallying against other currencies and even against gold.

    However, last Friday the USD reversed course. The February NFP report showed that the U.S. economy added 49k jobs in January. While that was positive, as well as the fact that the unemployment rate dropped to 6.3%, the market sold the USD because the December data was revised lower.

    Read Full on FXOpen Company Blog...

  4. #54
    Junior Member FXOpen Trader's Avatar
    Join Date
    Dec 2020
    Location
    Asia
    Posts
    2,040
    BTC and XRP – Bullish momentum confirmed


    BTC/USD

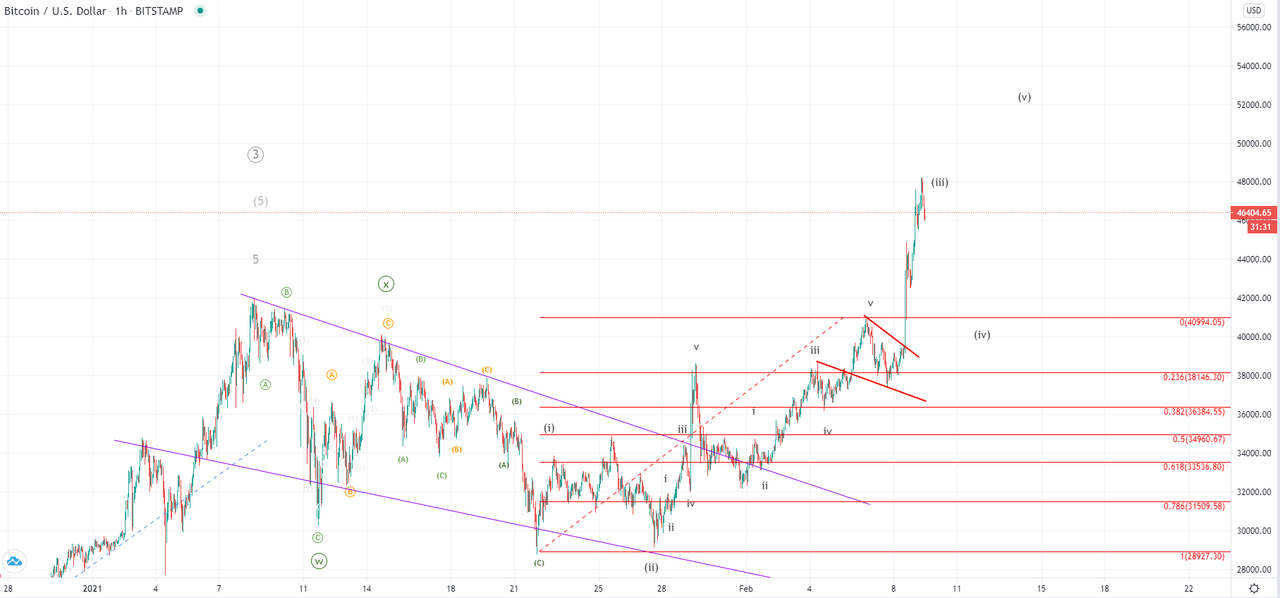
    The price of Bitcoin has broken out from its prior resistance and impulsively came to $48,200 at its highest point today. From its lowest point on Sunda when it was sitting around $37,430, this is an increase of 28%. Currently, a minor retracement is being made with the price sitting at $46,604 but is still in an upward trajectoty.


    This breakout indicates that the prior correctional formation from the 10th of January has ended and now we have a clear confirmation with the bullish momentum indicating a strong uptrend continuation. After the five-wave move inside the ascending channel was ended we have seen a minor pullback but an immediate breakout to the upside. This was most likely the 3rd sub-wave of the higher degree 3rd wave which is why further upside movement would now be expected.

    As the price is to develop its five-wave pattern further higher highs could be seen in the upcoming days with potentially exceeding the $60,000 mark by the end of its development. However not that an impulsive breakout has seen a local correction might form as the 4th wave should develop before further upside. It is still unclear where the 4th wave could land but most likely we are going to see a retest of the prior all-time high before uptrend continuation.

    Read Full on FXOpen Company Blog...

  5. #55
    Junior Member FXOpen Trader's Avatar
    Join Date
    Dec 2020
    Location
    Asia
    Posts
    2,040
    EUR/USD Showing Positive Signs, USD/JPY Turns Red


    EUR/USD started a fresh increase after testing the 1.1950 support zone. USD/JPY declined below the 105.00 support and tested the 104.50 zone.

    Important Takeaways for EUR/USD and USD/JPY

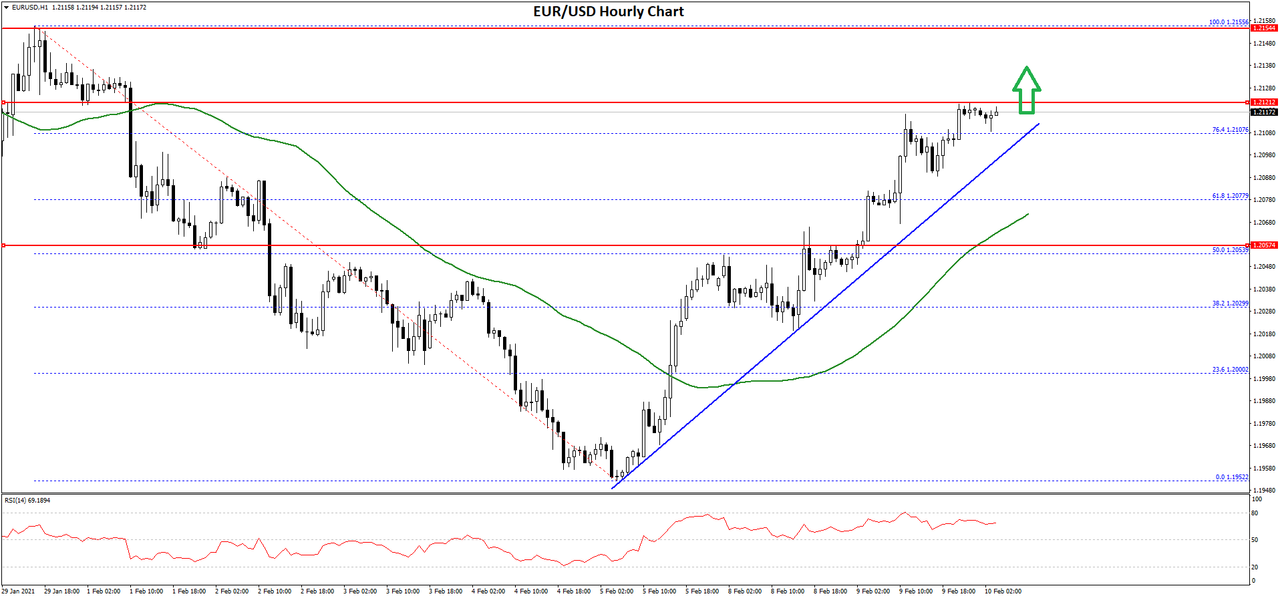
    • The Euro found support near the 1.1950 region and it started a fresh increase above 1.2050.
    • There is a key bullish trend line forming with support near 1.2100 on the hourly chart of EUR/USD.
    • USD/JPY declined heavily below the 105.20 and 105.00 support levels.
    • There was a break below a major bullish trend line with support at 105.30 on the hourly chart.


    EUR/USD Technical Analysis


    This past week, the Euro declined below the 1.2050 and 1.2000 support levels against the US Dollar. The EUR/USD pair traded close to the 1.1950 zone, where it found support.

    A low was formed near 1.1952 on FXOpen before the pair started a fresh increase. It climbed back above the 1.2000 level and the 50 hourly simple moving average. There was also a break above the 50% Fib retracement level of the downward move from the 1.2155 swing high to 1.1952 low.

    It is now trading above the 76.4% Fib retracement level of the downward move from the 1.2155 swing high to 1.1952 low. There is also a key bullish trend line forming with support near 1.2100 on the hourly chart of EUR/USD.

    An immediate resistance is near the 1.2120 level. The main resistance is near the 1.2155, above which EUR/USD is likely to accelerate higher towards the 1.2200 resistance area.

    Conversely, the pair could start a fresh decline below the 1.2100 support and the trend line. The first major support is near the 1.2075 level and the 50 hourly simple moving average.

    If there is a downside break below the 50 hourly simple moving average, the pair could dive towards the 1.2000 handle in the near term. Any more losses might call for a retest of the 1.1950 support level.

    Read Full on FXOpen Company Blog...

  6. #56
    Junior Member FXOpen Trader's Avatar
    Join Date
    Dec 2020
    Location
    Asia
    Posts
    2,040
    LTC and EOS – Resistance seen but for how long?


    LTC/USD

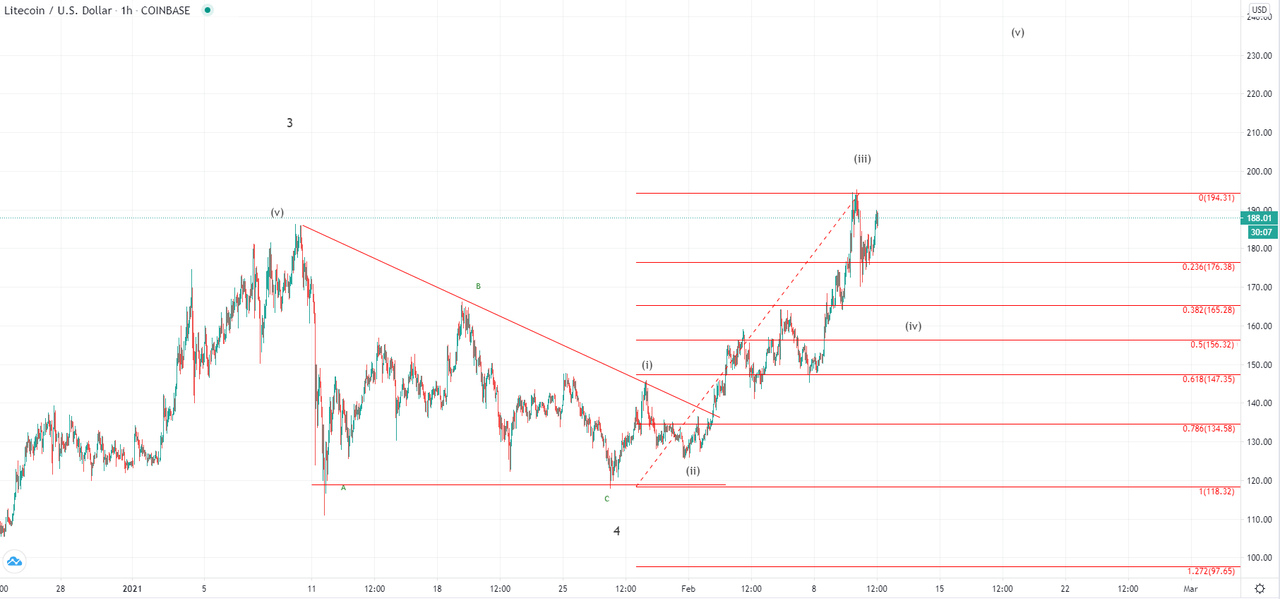
    The price of Litecoin has been increasing in the past week, and from last Thursday when it was sitting at $141.27 at its lowest, we have seen an increase of 37.8$ measured to its highest point yesterday at $194.31. Since then the price made a pullback to $170.54 but is again back in an upward trajectory, currently sitting at $188.


    On the hourly chart, we can see that the price broke the prior high made on the 10th of January when the price of Litecoin was sitting at $185.58. This confirmed the impulsiveness behind the move and that the previous correction ended at $118. We have seen the development of the 3rd sub-wave of the higher degree impulse which is why further upside would be expected. However if yesterday’s high was the end of the 3rd wave, now the price might be set for a local correction.

    Wave 4 should develop optimally to the 0.382 Fibonacci level which would bring the price of Litecoin to $165. But when the price tested prior resistance for support and confirms the bullish interest it is likely to continue moving past yesterday’s high and end around $230 before the completion of this five-wave move.

    Read Full on FXOpen Company Blog...

  7. #57
    Junior Member FXOpen Trader's Avatar
    Join Date
    Dec 2020
    Location
    Asia
    Posts
    2,040
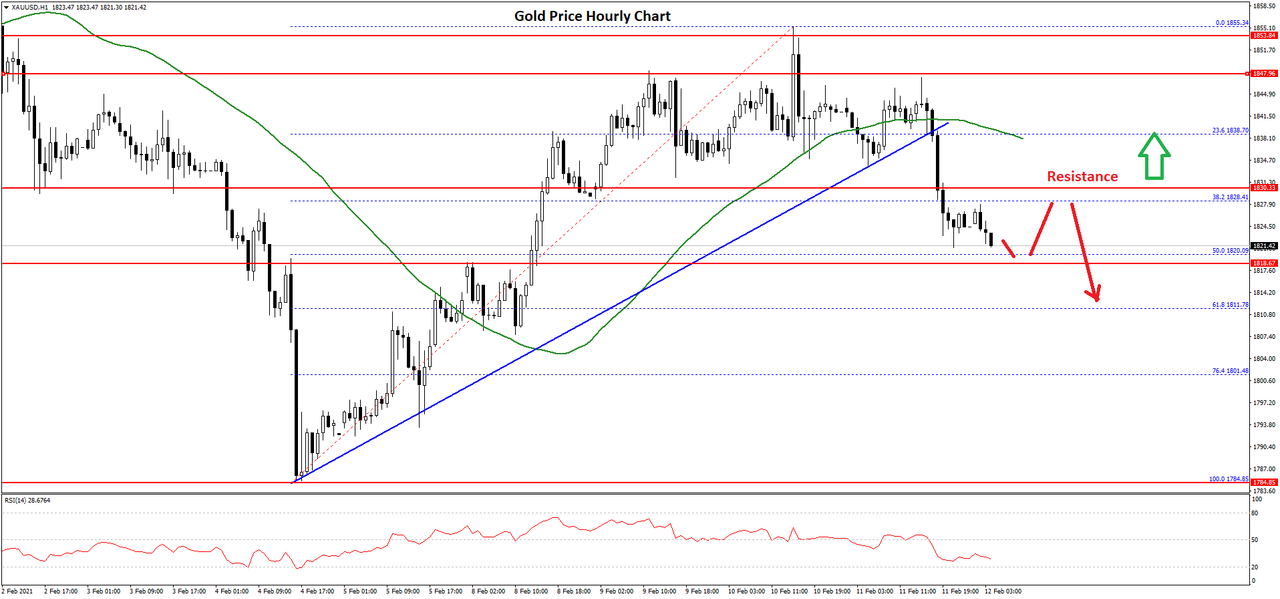
    Gold Price Starts Fresh Decline, Oil Price Correcting Gains


    Gold price failed to clear the $1,855 resistance and started a fresh decline. Crude oil price is correcting gains and it might test the $57.00 support zone.

    Important Takeaways for Gold and Oil

    • Gold price started a fresh increase, but it failed near $1,855 and $1,860 resistance levels against the US Dollar.
    • There was a break below a major bullish trend line with support near $1,838 on the hourly chart of gold.
    • Crude oil price traded to a new multi-month high near $58.75 before correcting lower.
    • There was a break below a key bullish trend line with support near $58.20 on the hourly chart of XTI/USD.


    Gold Price Technical Analysis


    Gold price started a decent recovery wave from the $1,785 zone against the US Dollar. The price climbed above the $1,820 and $1,840 resistance levels.

    However, the price struggled to clear the $1,855 and $1,860 resistance levels. A high was formed near $1,855 before the price started a fresh decline. There was a break below the $1,840 level and the 50 hourly simple moving average.

    The price traded below the 38.2% Fib retracement level of the upward move from the $1,784 swing low to $1,855 high. There was also a break below a major bullish trend line with support near $1,838 on the hourly chart of gold.

    The price is now approaching the $1,820 support zone. The 50% Fib retracement level of the upward move from the $1,784 swing low to $1,855 high is also near the $1,820 level.

    If there is a downside break below the $1,820 support level, the price might continue to move down towards the $1,800 level. Any more losses could lead the price towards the $1,784 swing low.

    On the upside, the price is likely to face resistance near the $1,830 level. The next major resistance is probably forming near the $1,840 level and the 50 hourly simple moving average.


    Read Full on FXOpen Company Blog...

  8. #58
    Junior Member FXOpen Trader's Avatar
    Join Date
    Dec 2020
    Location
    Asia
    Posts
    2,040
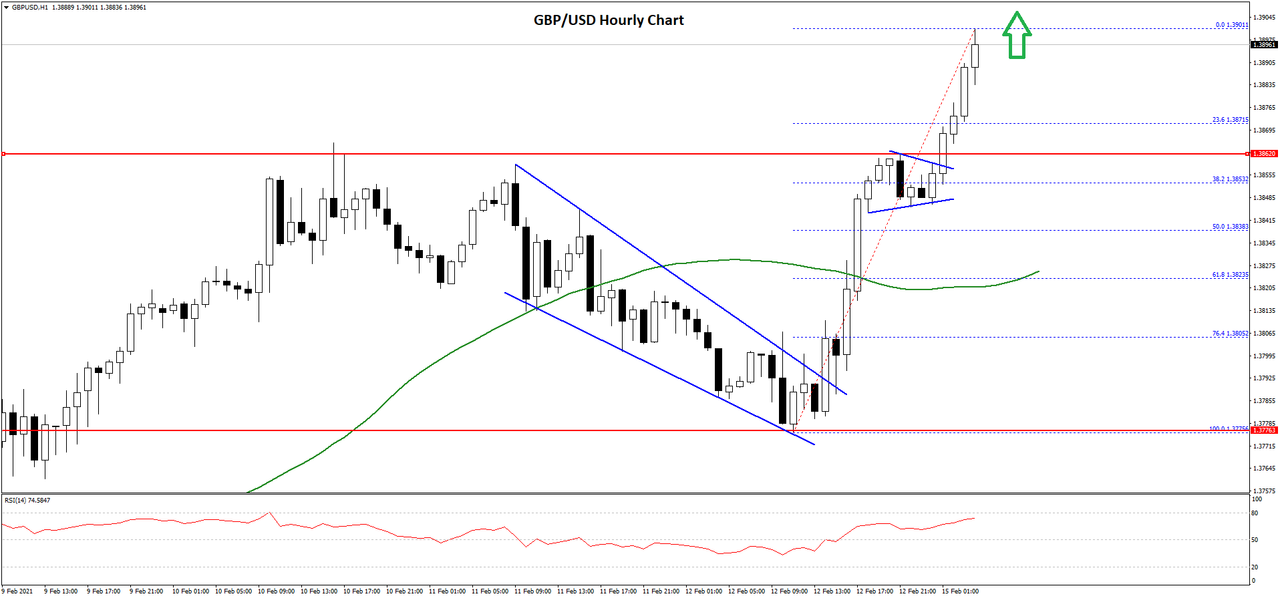
    GBP/USD and EUR/GBP: British Pound Gains Momentum


    GBP/USD is gaining bullish momentum above the 1.3800 and 1.3840 resistance levels. EUR/GBP is declining and it broke a major support at 0.8745.

    Important Takeaways for GBP/USD and EUR/GBP

    • The British Pound started a strong increase above the 1.3800 resistance zone.
    • There was a break above a major contracting triangle with resistance near 1.3790 on the hourly chart of GBP/USD.
    • EUR/GBP started a fresh decline after it failed to clear the main 0.8800 resistance zone.
    • There was a break below a key bullish trend line with support near 0.8760 on the hourly chart.


    GBP/USD Technical Analysis


    After forming a base above the 1.3750 and 1.3780, there was a fresh increase in the British Pound against the US Dollar. The GBP/USD pair broke the 1.3800 and 1.3840 resistance levels to move further into a positive zone.

    Moreover, there was a break above a major contracting triangle with resistance near 1.3790 on the hourly chart of GBP/USD. The pair strength and it was able to clear the 1.3850 resistance level.

    There was also a break above the 1.3880 level and the pair settled nicely above the 50 hourly simple moving average. A new multi-month high is formed near 1.3901 on FXOpen and the pair is currently consolidating gains.

    An initial support on the downside is near the 1.3880 level. The first key support is near the 1.3870 level. It is close to the 23.6% Fib retracement level of the upward move from the 1.3775 low to 1.3901 high.

    The next key support is near the 1.3850 level. Any more losses may possibly lead the pair towards the 1.3840 level. It coincides with the 50% Fib retracement level of the upward move from the 1.3775 low to 1.3901 high.

    On the upside, the 1.3900 level is a short-term resistance. A close above the 1.3900 level will most likely set the pace for a move towards the 1.4000 level in the near term.


    Read Full on FXOpen Company Blog...

  9. #59
    Junior Member FXOpen Trader's Avatar
    Join Date
    Dec 2020
    Location
    Asia
    Posts
    2,040
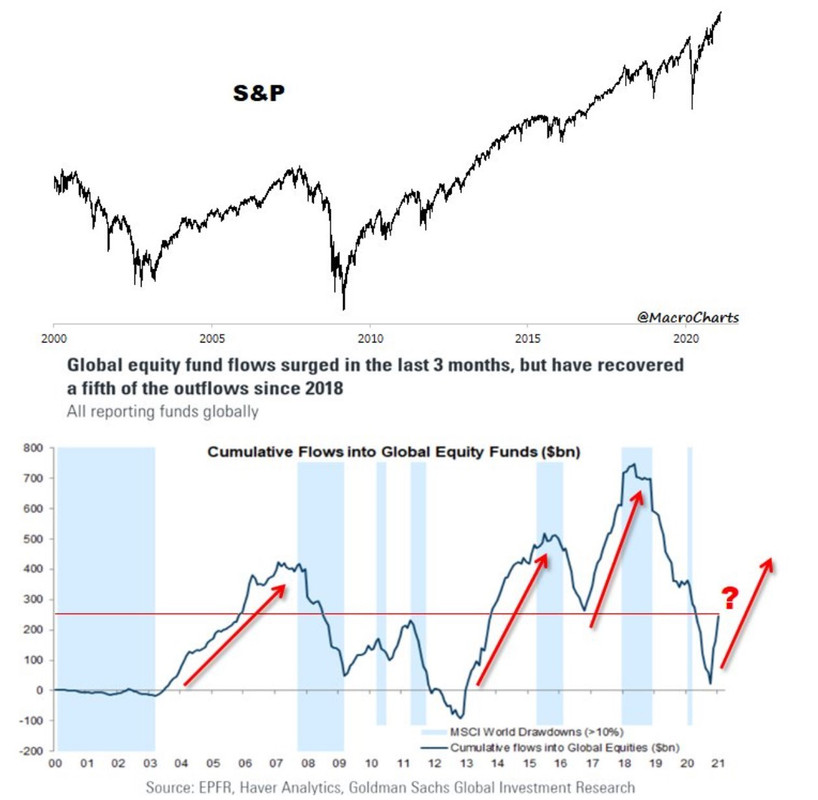
    Equity Indices Remain Bid as America Awaits New Fiscal Stimulus


    Last week brought little or no movements on the financial markets. The VIX index, which measures volatility, dropped to levels not seen so far during the pandemic.

    The lack of important economic data contributed to this environment. With a few exceptions, like the CPI or the inflation data in the United States, all other data was second- or third-tier. Effectively, it means that the focus was on the stock market’s price action. This week will likely be the same as it starts with a holiday (i.e., Presidents’ Day in the United States) and no important data until next Friday when the European PMIs are released.


    Read Full on FXOpen Company Blog...

  10. #60
    Junior Member FXOpen Trader's Avatar
    Join Date
    Dec 2020
    Location
    Asia
    Posts
    2,040
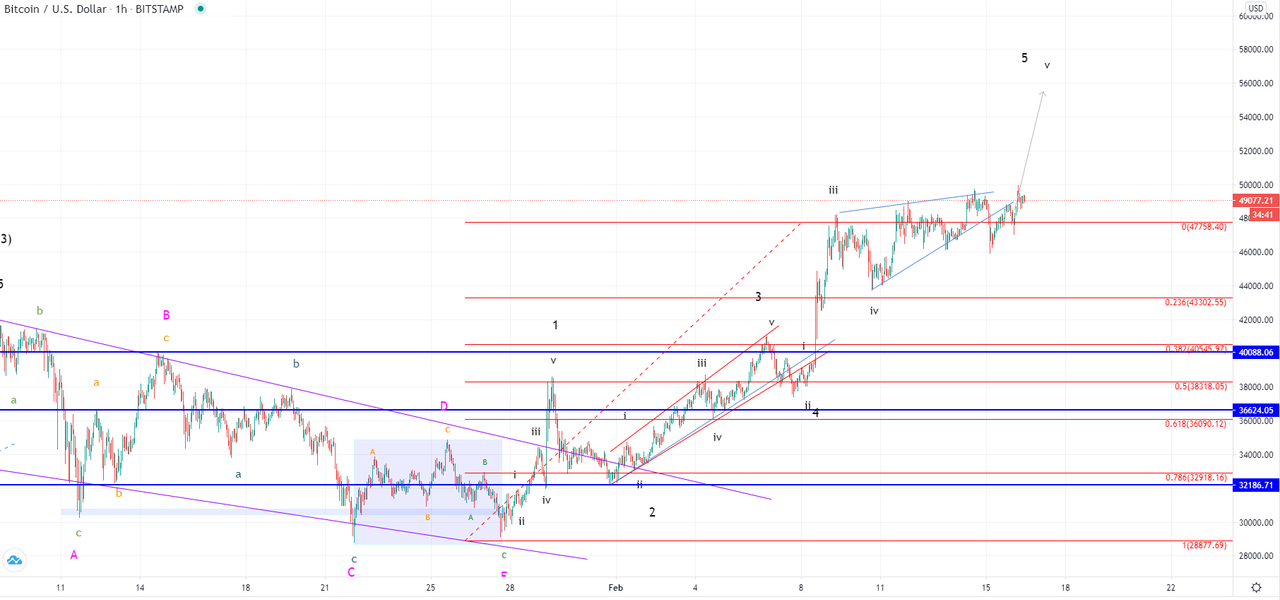
    BTC and XRP – New highs expected


    BTC/USD

    The price of Bitcoin has continued its upward trajectory from last Monday and came up from $37,691 at its lowest point to $49,808 at its highest point on Sunday which was an increase of 32.15%. From Sunday’s high, we have seen a pullback to the $46,000 zone but the price is now once again in an upward trajectory. Currently, it is sitting just slightly above $49,000 mark and is testing its horizontal resistance.


    On the hourly chart, you can see that this rise is the next developing 5th wave from the higher degree impulse and from the lower degree one as well. This is why further upside would be expected but is most likely the ending wave from the rise that started on the 27th of January.

    The price has been forming an ascending triangle from the 9th of February when the 3rd impulse wave was formed out of the lower degree. Now as the price has reached the apex of the triangle and then retraced back it appears that it made the completion of the 4th wave corrective structure.

    If this is true now another impulse to the upside has started with the price leading towards a new all-time high, potentially above $52,000.

    Read Full on FXOpen Company Blog...

Page 6 of 164 FirstFirst ... 4 5 6 7 8 16 56 106 ... LastLast

Bookmarks

Posting Permissions

  • You may not post new threads
  • You may not post replies
  • You may not post attachments
  • You may not edit your posts
  •