
 1Likes
 LinkBack URL
 About LinkBacks


AUD/USD: significant uncertainty remains
07/04/2020
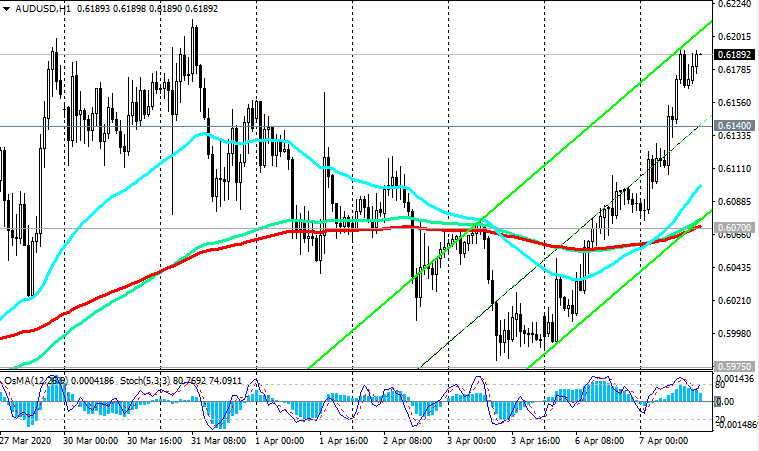
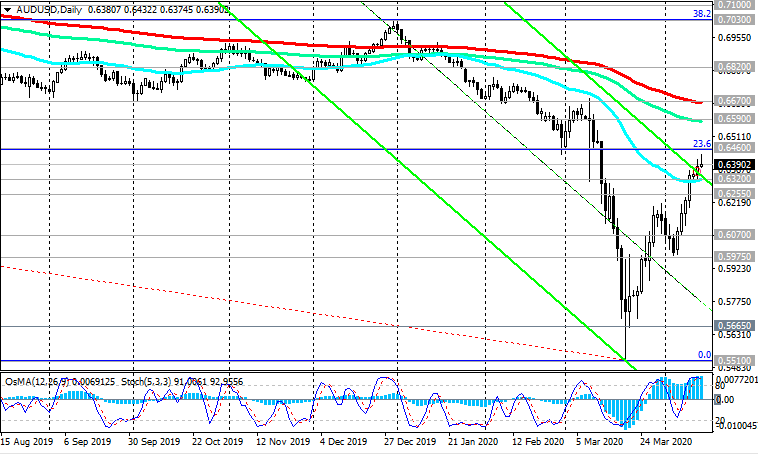
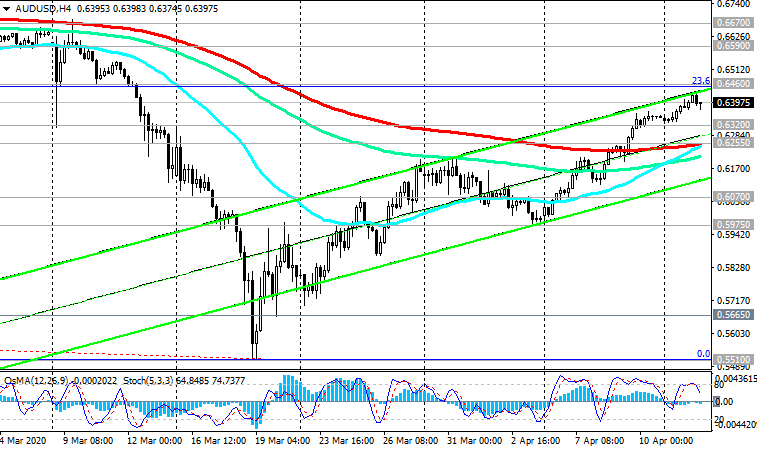
Having broken through the important short-term resistance level of 0.6070 (ЕМА200 on the 1-hour chart), AUD / USD is growing again today.
The pair is developing an upward correction, striving for resistance levels of 0.6232 (EMA200 on the 4-hour chart), 0.6300 (the upper border of the downward channel and EMA50 on the daily chart).
The growth of AUD quotes, as well as the growth of other commodity currencies, is facilitated by the growth of world stock indices and commodity prices. Indices, in turn, are rising thanks to the first signs that quarantine measures around the world are helping to curb the coronavirus pandemic, and also due to expectations of rising oil prices if this week the largest oil producers, including Saudi Arabia, the US and Russia, will come to an agreement to reduce oil production.
However, caution should be exercised in this regard. The peak of the coronavirus pandemic has not yet been passed, and the world's largest oil suppliers may not come to an agreement to reduce production.
At any moment, the upward correction of commodity currencies, including AUD, may break and be replaced by their decline.
Substantial uncertainty remains regarding the short-term prospects of the Australian economy. In April-June, a very strong reduction in GDP is expected, as well as unemployment growth to a multi-year maximum, said RBA managing director Philip Lowe after the central bank on Tuesday kept the current monetary policy unchanged. The pandemic dealt a painful blow to the country's economy, paralyzing the tourism and education segments and causing a sharp decline in consumer spending.
The board will not raise rates until there is progress in ensuring full employment and there is confidence in stabilizing inflation in the target range of 2% - 3%, Lowe added, and this is a negative factor for AUD.
AUD / USD purchases can only be short-lived, while the pair is trading above the support level of 0.6070, with targets at resistance levels of 0.6232 (EMA200 on the 4-hour chart), 0.6300 (upper border of the downward channel and EMA50 on the daily chart).
Below the resistance levels of 0.6670 (ЕМА200 on the daily chart), 0.6590 (ЕМА144 on the daily chart) the long-term negative dynamics of AUD / USD still prevails.
The breakdown of the support level of 0.6070 will resume the downward trend of AUD / USD and once again make short positions relevant with targets at local support levels of 0.5975, 0.5665, 0.5510 (the recent almost 18-year low and the Fibonacci level 0% of the correction to the decline wave, which began in July 2014 from the mark of 0.9500).
Support Levels: 0.6070, 0.5975, 0.5665, 0.5510
Resistance Levels: 0.6232, 0.6300, 0.6460, 0.6590, 0.6670
Trading Recommendations
Sell Stop 0.6130. Stop-Loss 0.6210. Take-Profit 0.6100, 0.6070, 0.5975, 0.5665, 0.5510
Buy Stop 0.6210. Stop-Loss 0.6130. Take-Profit 0.6232, 0.6300, 0.6460, 0.6590, 0.6670
*) For up-to-date and detailed analytics and news on the forex market visit Tifia Forex Broker website tifia.com


 Reply With Quote


Bookmarks