Page 68 of 70 FirstFirst ... 18 58 66 67 68 69 70 LastLast
Results 671 to 680 of 698
Like Tree1Likes

Tifia Daily Market Analytics

This is a discussion on Tifia Daily Market Analytics within the Analytics and News forums, part of the Trading Forum category; S&P 500: fundamental background is negative 23/03/2020 Having completed the past week with the largest losses since October 2008, futures ...


  1. #671
    Senior Member TifiaFX's Avatar
    Join Date
    Mar 2017
    Posts
    697
    S&P 500: fundamental background is negative
    23/03/2020

    Having completed the past week with the largest losses since October 2008, futures on major US stock indexes began a new trading week on Monday with a gap down about 3%. Investors are under stress amid the coronavirus pandemic and the fall of the global economy.
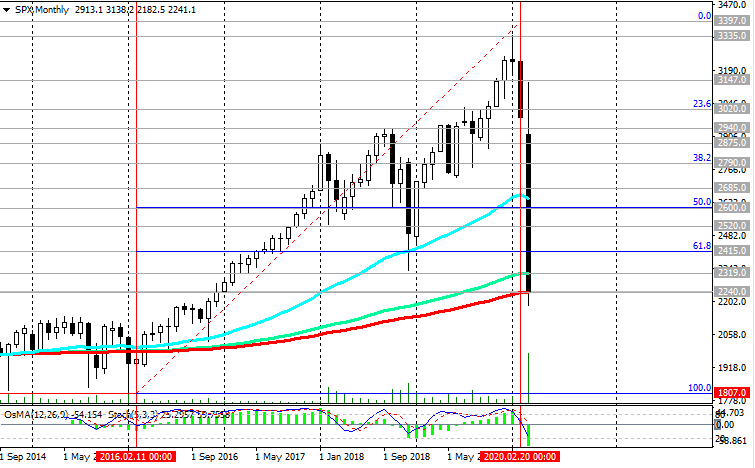
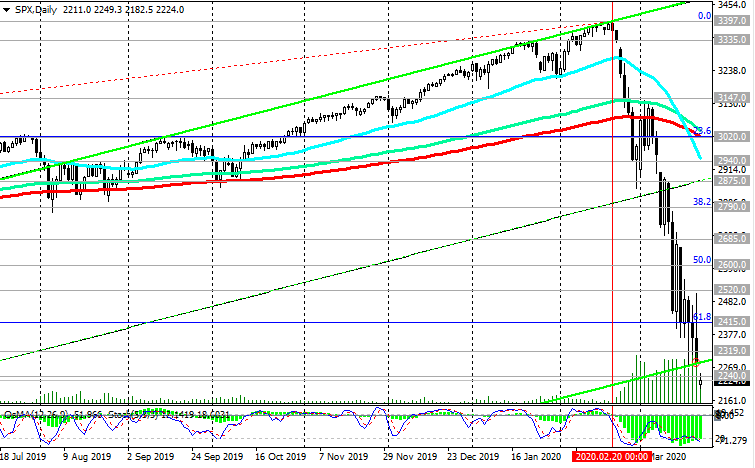
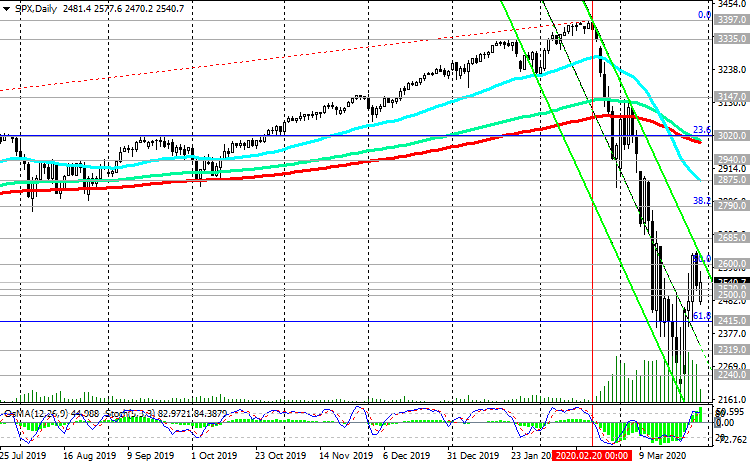
    The Dow Jones Industrial Average, S&P 500 and Nasdaq Composite fell from record highs reached in February by about 30%. At the same time, the Dow Jones Industrial Average, S&P 500 indices returned to levels of more than 3 years ago (November - December 2016).
    At the same time, the fall of stock indices occurs against the background of a sharp decline in oil prices, which is caused both by expectations of a sharp drop in world oil consumption due to the coronavirus and fears about a price war between the world's largest oil producing countries.
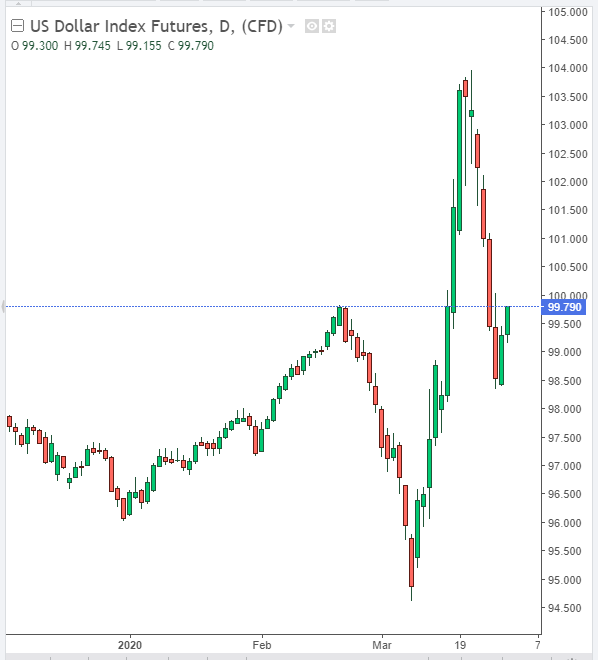
    At the same time, the dollar continues to enjoy strong demand, strengthening its position in the foreign exchange market. The DXY dollar index rose 5% last week, and continues to rise on Monday. At the beginning of today's European session, the DXY dollar index futures were traded near 103.59, 9 points above the closing price last Friday.
    Nevertheless, at the reached critical levels, a local bottom may form, and further growth of indices is possible.
    This point of view is supported by the technical aspect of our analysis. On the monthly chart, the S&P 500 futures reached a strategic long-term support level at around 2240.0, through which a 200-period moving average passes.
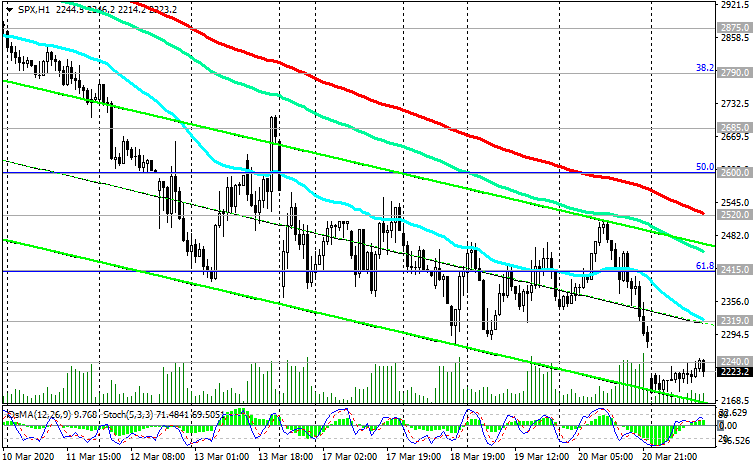
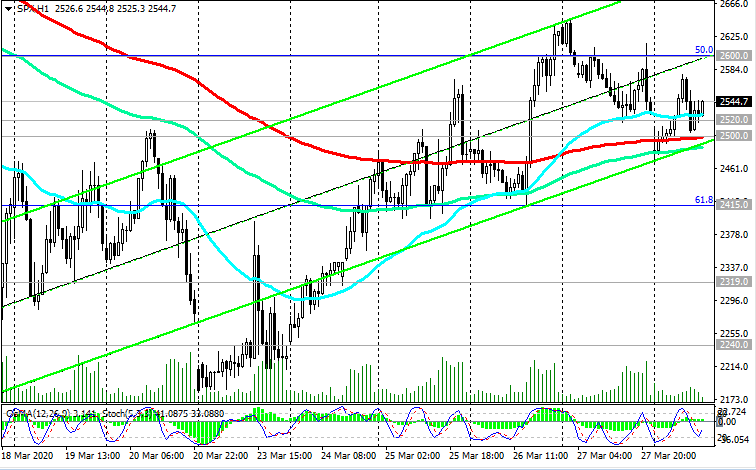
    A growth into the zone above the resistance levels of 2520.0 (ЕМА200 on the 1-hour chart), 2600.0 (Fibonacci level 50% of the downward correction to the growth since February 2016 and the level of 1807.0) may be a signal for the beginning of the stock market recovery and further growth of the S&P 500.
    At the same time, below the resistance levels of 2319.0 (ЕМА144 on the monthly chart), 2415.0 (Fibonacci level of 61.8%), only short positions should be considered.
    The long-term reduction target is located at the support level of 1900.0 (February 2016 lows).
    Downward prevailing amid strong negative fundamental background.
    Support Levels: 2240.0, 2180.0, 2020.0, 1900.0, 1807.0
    Resistance Levels: 2319.0, 2415.0, 2520.0, 2600.0, 2685.0

    Trading Recommendations

    Sell Stop 2180.0. Stop-Loss 2320.0. Goals 2100.0, 2020.0, 1900.0, 1807.0
    Buy Stop 2320.0. Stop-Loss 2180.0. Goals 2415.0, 2520.0, 2600.0, 2685.0, 3020.0


    *) For up-to-date and detailed analytics and news on the forex market visit Tifia Forex Broker website tifia.com

  2. #672
    Senior Member TifiaFX's Avatar
    Join Date
    Mar 2017
    Posts
    697
    XAU/USD: positive dynamics of gold remains
    24/03/2020

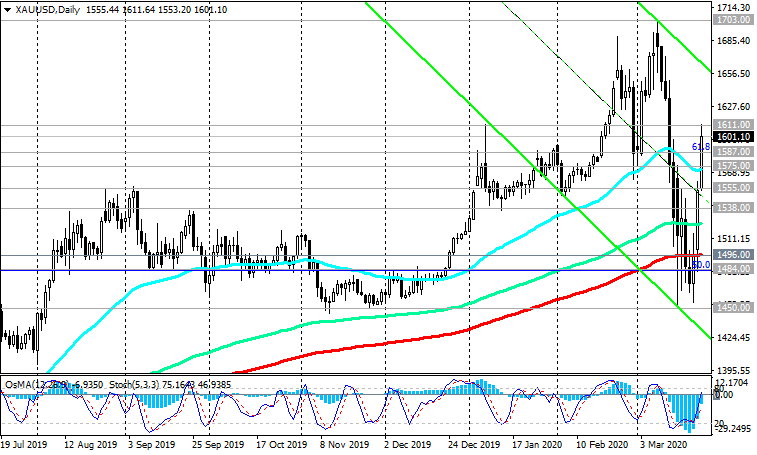
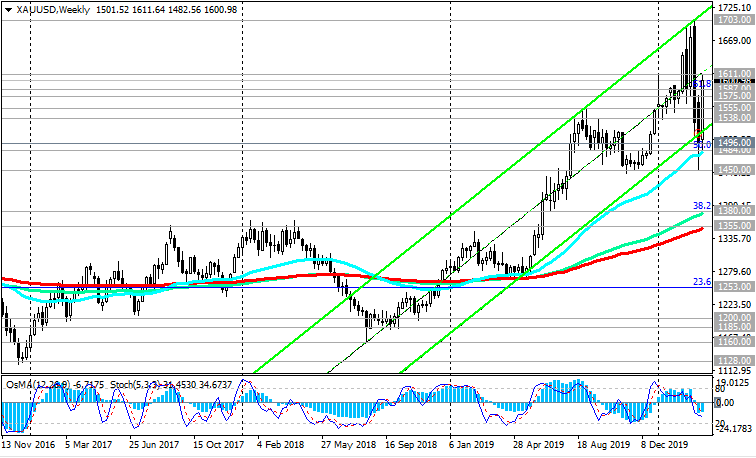
    At the beginning of this month, having reached a new, more than 7-year high, near the mark of 1703.00, over the next 2 weeks the XAU / USD pair fell by 250 points (more than 17%), to the 1452.00 mark. Investors were forced to sell their gold reserves, hedging stock market transactions and covering margin stake requirements.
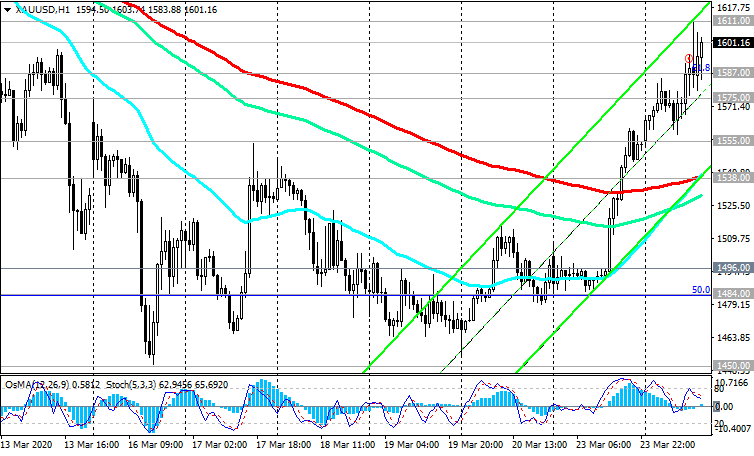
    However, the growth of gold quotes seems to have resumed. Having bounced from the strong support levels of 1496.00 (ЕМА200 on the daily chart), 1484.00 (Fibonacci level 50% of the correction to the wave of decline since September 2011 and the mark of 1920.00), the XAU / USD has increased by 6.5% since the beginning of the week, today reaching an intraday maximum near the mark of 1611.00.
    The aggressive stimulating actions of the Fed and the weakening of the dollar against this background contribute to the growth of gold quotes.
    On Monday, the Fed announced new measures to stimulate the US economy and stabilize financial markets. Now the Fed intends to buy government bonds and securities issued by mortgage agencies if necessary in unlimited quantities. Over the past week, the Fed's balance sheet increased by $ 350 billion, to a record $ 4.7 trillion. According to CNBC, the Fed’s incentive measures are the most aggressive market intervention by the Fed since its inception.
    After the Fed has approached the limit of its ability to support the economy, reducing its interest rates to almost zero and pouring billions of dollars into the financial system, investors are now waiting for no less strong action from the US government.
    According to media reports, the US government is working on a large-scale package of incentive measures to help businesses and citizens. The amount of the package may exceed $ 1 trillion. However, last Sunday the US Senate did not reach an agreement on the rescue package, which includes assistance to companies and households.
    Demand for gold and other protective assets will continue until the coronavirus epidemic declines, the global economy begins to recover, and the Fed does not think about tightening its monetary policy. And this is still very far away.
    In the current situation, long positions are preferred. Above the short-term support levels of 1538.00 (EMA200 on the 1-hour chart), 1575.00 (EMA200 on the 4-hour chart), purchases look safe, and above the support level of 1496.00, the long-term positive dynamics of XAU / USD remains.
    Support Levels: 1587.00, 1575.00, 1555.00, 1538.00, 1496.00, 1484.00, 1450.00
    Resistance Levels: 1611.00, 1703.00, 1718.00

    Trading Recommendations

    Sell Stop 1550.00. Stop-Loss 1613.00. Take-Profit 1538.00, 1496.00, 1484.00, 1450.00
    Buy "by the market". Stop-Loss 1550.00. Take-Profit 1611.00, 1703.00, 1718.00


    *) For up-to-date and detailed analytics and news on the forex market visit Tifia Forex Broker website tifia.com

  3. #673
    Senior Member TifiaFX's Avatar
    Join Date
    Mar 2017
    Posts
    697
    USD/JPY: investors are not yet ready to actively sell the dollar
    25/03/2020

    After the measures announced by the Fed last Monday, investors cheered up a bit and markets revived. The Fed launched the printing press at full capacity and poured billions of dollars into the financial system. Over the past week, the Fed's balance sheet increased by $ 350 billion, to a record $ 4.7 trillion.
    Last Tuesday, US stock indices showed record growth. The Dow Jones Industrial Average grew by more than 11%, showing the largest single-day growth in almost 90 years. The S&P 500 gained 9.4%, and the Nasdaq Composite - 8.1%. On Wednesday, the growth of futures for US stock indexes continued in the first half of the trading day.
    Nevertheless, despite the Fed’s aggressive stimulus measures, investors are not yet ready to actively sell the dollar, although this moment may come - abruptly and “as always”, unexpectedly.
    The pair USD / JPY continues to trade in the range of the last 5 days (between support / resistance levels of 109.70 / 111.70). A summary of the views of Bank of Japan executives published Tuesday evening (23:50 GMT) states that “the consequences of a coronavirus pandemic can be long-lasting and significant”, and “the bank can take timely action as part of an emergency meeting”, if the need arises.
    Last week (March 16), the Bank of Japan this time chose not to lower the key rate, leaving it at -0.1%, and the target level of yield on 10-year government bonds in Japan is about zero. The Bank of Japan said it would double ETF purchases to 12 trillion yen ($ 112 billion) a year, and raised the target level of corporate bonds on its balance sheet to 4.2 trillion yen from 3.2 trillion yen, and commercial paper to 3.2 trillion yen from 2.2 trillion yen.
    The Bank of Japan also confirmed its intention to buy Japanese government bonds of 80 trillion yen per year (over the past year, he bought them of about 14 trillion yen).
    Japanese stock index Nikkei Stock Average also rose on Tuesday by 8%, showing the largest percentage increase since October 2008.
    In a quiet market, with the growth of the Nikkei Stock Average, the pair USD / JPY also usually grows. Nevertheless, in the current rapidly changing situation, it is probably still better to focus on technical analysis and on the breakdown of the levels and / or boundaries of the range formed in the last days (between support / resistance levels of 109.70 / 111.70).
    Support Levels: 110.50, 110.15, 109.70, 109.25, 108.85, 108.50
    Resistance Levels: 111.70, 112.20, 113.10

    Trading Scenarios

    Buy Stop 111.80. Stop Loss 109.20. Take-Profit 112.20, 113.10, 114.00, 115.00
    Sell Stop 109.20. Stop Loss 111.80. Take-Profit 109.00, 108.85, 108.50, 107.00, 106.50, 105.00, 104.00, 103.00, 102.00
    *) For up-to-date and detailed analytics and news on the forex market visit Tifia Forex Broker website tifia.com

  4. #674
    Senior Member TifiaFX's Avatar
    Join Date
    Mar 2017
    Posts
    697
    WTI: pessimism keeps prices at multi-year lows
    26/03/2020

    Oil quotes remain under pressure. The pessimism of the oil market participants associated with the price war among the largest oil producers, the coronavirus pandemic and the slowdown in the global economy, and as a result - a decrease in oil demand, is pushing oil prices towards new multi-year lows.
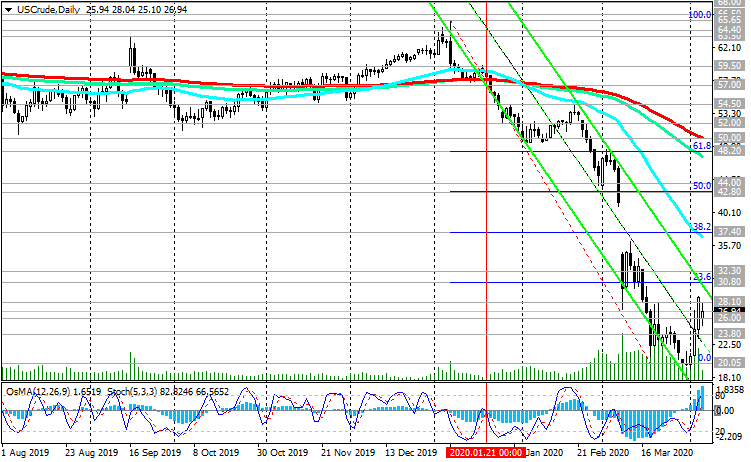
    Having broken through the key support level of 57.00 (EMA200 on the daily and weekly charts) in January, the price of WTI crude oil rushed down, updating the record for falling in March. The 4-year low at the psychologically important support level of 26.00 also could not resist, and the price fell last week to record lows near the mark of $ 20.00 per barrel.
    The decline in WTI crude oil over the past 3 months has been 78% to date. Last week, a new anti-record was broken when WTI oil quotes fell to around $ 20.05 per barrel.
    On Thursday, oil market participants will follow an emergency G20 summit where statements can be made regarding the price war between major oil producers. Investors still hope that the price war between leading oil exporters, including the United States, Russia and Saudi Arabia, will end soon.
    This is a positive factor for oil quotes.
    At the same time, quarantine measures taken in connection with the coronavirus pandemic, according to economists, can lead to a decrease in April of global oil demand by 18.7 million barrels per day. Such a large-scale drop in demand can outweigh any reduction in oil production, including a possible freeze or restriction of OPEC production, oil market analysts say.
    Currently, a strong negative impulse prevails, holding oil quotes near multi-year lows.
    The first timid signal for purchases may be a breakdown of the resistance level of 26.00 (EMA200 on the 1-hour chart and the recent 4-year low). In case of further growth and after the breakdown of the resistance level of 30.80 (Fibonacci level 23.6% of the upward correction to the fall from this year's highs near 65.65 to the local minimum of 20.05), the price may go towards the level of 52.00, through which EMA200 on the daily chart is currently passing.
    However, short positions are preferred, which are best entered at the rebound from the nearest resistance zone near the levels of 26.00, 27.00, 28.00, 29.00, 30.00.
    Support Levels: 23.00, 22.00, 21.00, 20.00
    Resistance Levels: 26.00, 28.10, 30.80, 37.40, 42.80, 44.00, 48.20, 50.30, 52.00

    Trading Recommendations

    Sell by market. Sell-Limit 26.00, 27.00, 28.00. Stop-Loss 28.50. Take-Profit 23.00, 22.00, 21.00, 20.00
    Buy Stop 28.20. Stop-Loss 25.80. Take-Profit 30.80, 37.40, 42.80, 44.00, 48.20, 50.30, 52.00

    *) For up-to-date and detailed analytics and news on the forex market visit Tifia Forex Broker website tifia.com

  5. #675
    Senior Member TifiaFX's Avatar
    Join Date
    Mar 2017
    Posts
    697
    S&P 500: talking about breaking a negative trend is prematurely
    30/03/2020

    Investors enthusiastically welcomed the efforts of the Fed and the US government to support the US economy and population - US stock indexes completed last week with a record increase. The S&P 500, for example, grew by 15%, to 2530.0, DJIA - by 17%, to 21540.0. For US stock indices, last week was the most successful since 1938.
    Earlier in mid-March, the ECB leadership introduced a new program for the purchase of Eurobonds in the amount of 750 billion euros in addition to the two ongoing quantitative easing programs - a regular monthly purchase of assets worth 20 billion euros and the announced “antivirus” tranche of purchases with a budget of 120 billion euros, which to be spend before the start of summer. In total, the ECB will buy in sum 1,11 trillion euros in asset markets this year.
    Participants in the financial market cannot but take into account the joint actions of world central banks, which sharply softened monetary policy, as well as the record filling of the financial market with cheap liquidity.
    It’s too early to talk about the turning point in the negative trend in US and global stock indices. Investors are still under stress amid the coronavirus pandemic and the collapse of the global economy.
    Nevertheless, the first signals appeared to resume purchases, which should not be ignored. On the 1-hour chart of the S&P 500, the price broke through an important short-term resistance level (EMA200) near 2500.0.
    A return of the index to the zone above resistance levels of 3000.0 (ЕМА200 on the daily chart), 3020.0 (Fibonacci level 23.6% of the downward correction to the growth since February 2016 and from the level 1807.0) will indicate a resumption of the bull trend.
    However, a breakdown of the support level of 2500.0 will be a signal for the sale of the S&P 500.
    Support Levels: 2500.0, 2415.0, 2319.0, 2240.0, 2180.0, 2020.0, 1900.0, 1807.0
    Resistance Levels: 2600.0, 2685.0, 2790.0, 2940.0, 3000.0, 3020.0

    Trading Recommendations

    Sell Stop 2465.0. Stop-Loss 2580.0. Goals 2415.0, 2319.0, 2240.0, 2180.0, 2020.0, 1900.0
    Buy Stop 2580.0. Stop-Loss 2465.0. Goals 2600.0, 2685.0, 2790.0, 2940.0, 3000.0, 3020.0


    *) For up-to-date and detailed analytics and news on the forex market visit Tifia Forex Broker website tifia.com

  6. #676
    Senior Member TifiaFX's Avatar
    Join Date
    Mar 2017
    Posts
    697
    EUR/USD: further growth of the dollar is likely
    31/03/2020

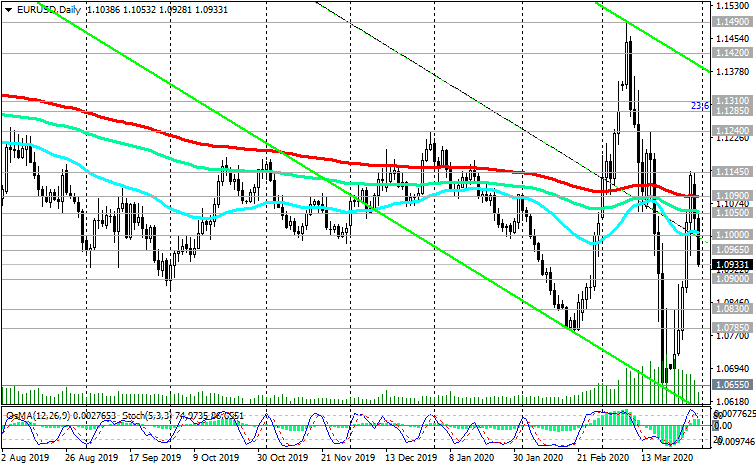
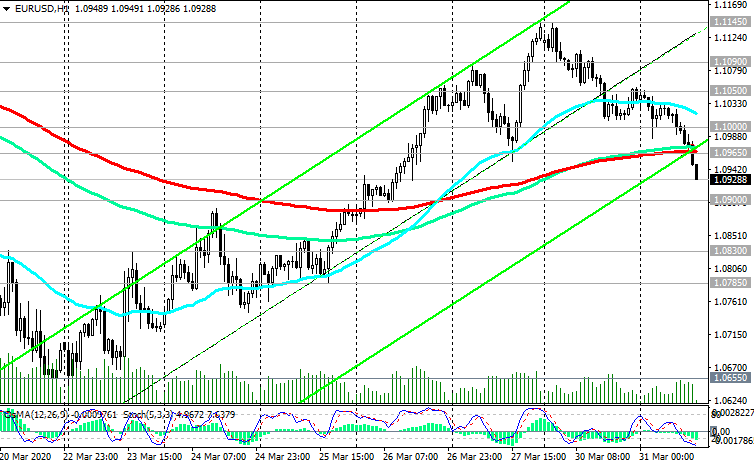
    At the beginning of today's European session, EUR / USD is traded near 1.0965, through which an important short-term support level is passing (ЕМА200 on the 1-hour chart). The break of this support level may lead to an acceleration of the EUR / USD decline.
    According to preliminary official data released on Tuesday, in March the annual inflation rate in the Eurozone was 0.7% versus 1.2% in February. The target inflation rate set by the ECB is just below 2%.
    At the same time, the indicator of the mood of companies and consumers in the Eurozone in March showed the largest one-month drop in the entire history of observations against the background of the proliferation and tightening of measures aimed at containing the pandemic of the coronavirus.
    Economists' forecasts regarding the GDP of two competing economies (the US and the Eurozone) speak in favor of the American economy and, as a result, in favor of the US assets and the dollar (economists suggest that Eurozone GDP will decrease by 3.6% in 2020 due to the effects of coronavirus on the economy , while US GDP this year will also decline, but less than Eurozone GDP, by 2.9%).
    At the same time, the uncertainty is still too high, and the growth prospects of the global economy remain under the influence of downward risks, which also supports the dollar as a safe haven.
    Despite the fact that in the near future an avalanche of dollar liquidity will pour into the financial system of the world (after the announcement of extraordinary incentive measures by the Fed and the US government), the dollar continues to be in demand. In the near future, its further growth is most likely, including in the EUR / USD pair.
    Support Levels: 1.0900, 1.0830, 1.0785, 1.0655, 1.0600, 1.0580, 1.0530
    Resistance Levels: 1.0965, 1.1000, 1.1050, 1.1090, 1.1145

    Trading Recommendations

    Sell by market. Stop-Loss 1.1010. Take-Profit 1.0900, 1.0830, 1.0785, 1.0655, 1.0600, 1.0580, 1.0530
    Buy Stop 1.1010. Stop-Loss 1.0960. Take-Profit 1.1050, 1.1090, 1.1145


    *) For up-to-date and detailed analytics and news on the forex market visit Tifia Forex Broker website tifia.com

  7. #677
    Senior Member TifiaFX's Avatar
    Join Date
    Mar 2017
    Posts
    697
    USD/CAD: the resumption of the rally of the dollar is probably
    01/04/2020

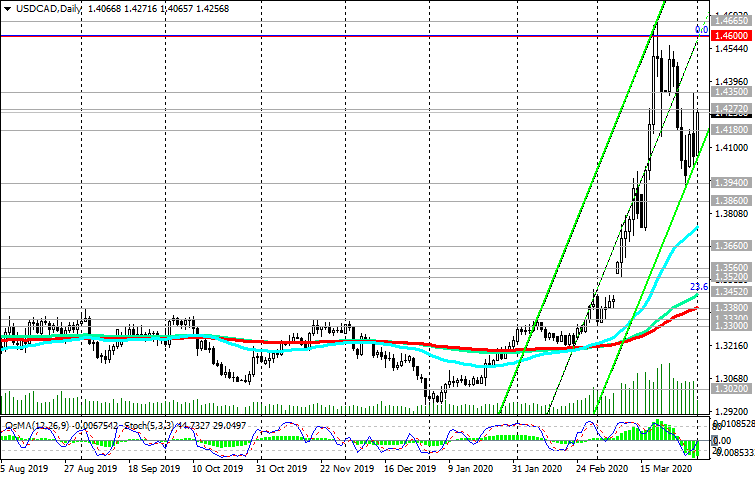
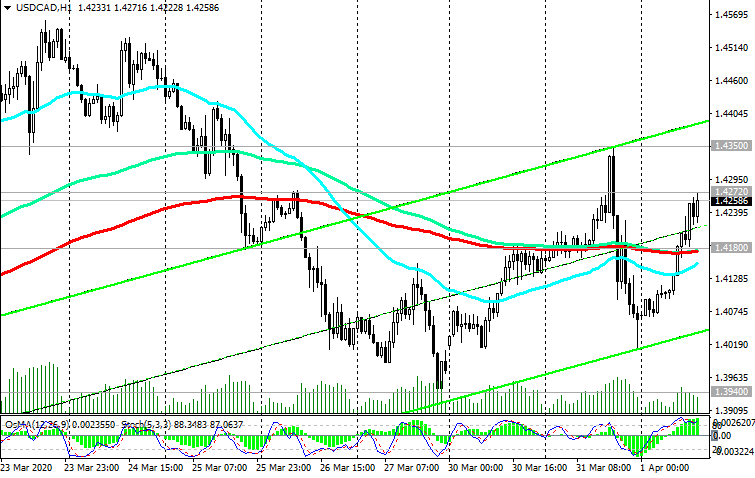
    Despite new extraordinary measures to support the US economy taken by the Fed and the US government last week, the dollar is growing again at the start of a new week and month. On Wednesday, USD / CAD is trading at the start of the European session near 1.4250, above the important short-term support level of 1.4180 (200-period moving average on the 1-hour chart).
    The coronavirus pandemic has not yet reached its peak in Europe, and in the United States it is gaining momentum, threatening to grow on an even larger scale. Moreover, the economic situation in other countries (outside the United States) with the largest economies is even worse than in the United States.
    It is possible that panic sales of assets and risky assets will recur, which will contribute to the continuation of the dollar rally.
    Last week, the Bank of Canada again unscheduled lowered its key interest rate by 0.50%, bringing it even closer to zero in order to mitigate the economic damage from the new coronavirus pandemic.
    A press release from the central bank also said that the spread of coronavirus and a sharp drop in world oil prices in the aggregate are putting serious pressure on Canadians and the Canadian economy. The Bank of Canada also announced its intention to launch a quantitative easing program (QE) in the form of purchases of government bonds of Canada in the secondary market.
    The QE program and a significant reduction in interest rates should help weaken CAD. CAD quotes are also under pressure from a sharp drop in oil prices.
    Thus, despite the overbought, the growth of USD / CAD may resume. In case of breakdown of the local resistance level of 1.4350, USD / CAD growth is likely to continue towards the resistance levels of 1.4600, 1.4660 (annual and almost 17-year highs).
    In an alternative scenario and in case of breakdown of the support level 1.4180 USD / CAD will go towards the support levels 1.3860 (ЕМА200 on the 4-hour chart), 1.3380 (ЕМА200 on the daily chart).
    At the moment, a strong positive momentum is prevailing, making long positions preferable.
    Support Levels: 1.4180, 1.3940, 1.3860, 1.3660, 1.3520, 1.3452, 1.3380, 1.3330, 1.3300
    Resistance Levels: 1.4350, 1.4600, 1.4665, 1.4700

    Trading Scenarios

    Sell Stop 1.4170. Stop-Loss 1.4280. Take-Profit 1.4100, 1.3940, 1.3860, 1.3660, 1.3520, 1.3452, 1.3380, 1.3330, 1.3300
    Buy Stop 1.4280. Stop-Loss 1.4170. Take-Profit 1.4350, 1.4600, 1.4665, 1.4700


    *) For up-to-date and detailed analytics and news on the forex market visit Tifia Forex Broker website tifia.com

  8. #678
    Senior Member TifiaFX's Avatar
    Join Date
    Mar 2017
    Posts
    697
    EUR/USD: to the level of 1.0500 in the next 3 months?
    02/04/2020

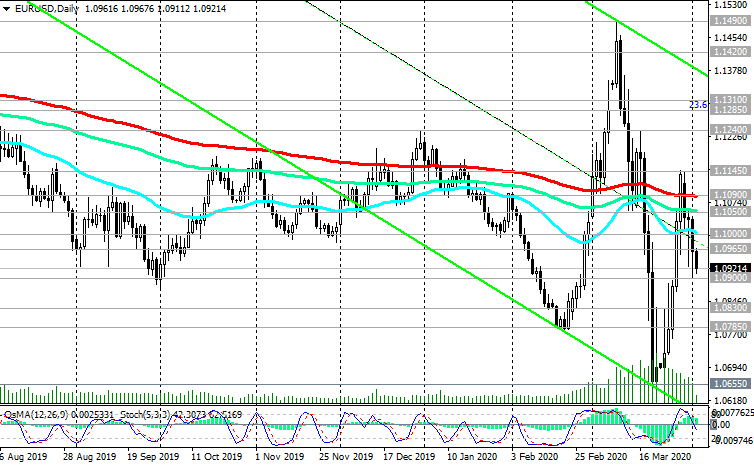
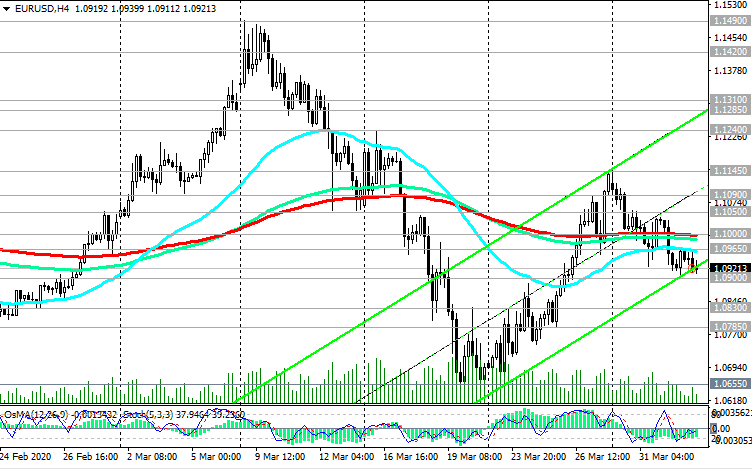
    Over the past week, the EUR / USD has been growing, making an attempt last Friday to break through the important long-term resistance level of 1.1090 (ЕМА200 on the daily chart). However, a breakthrough did not work, and on Monday the decline in EUR / USD resumed.
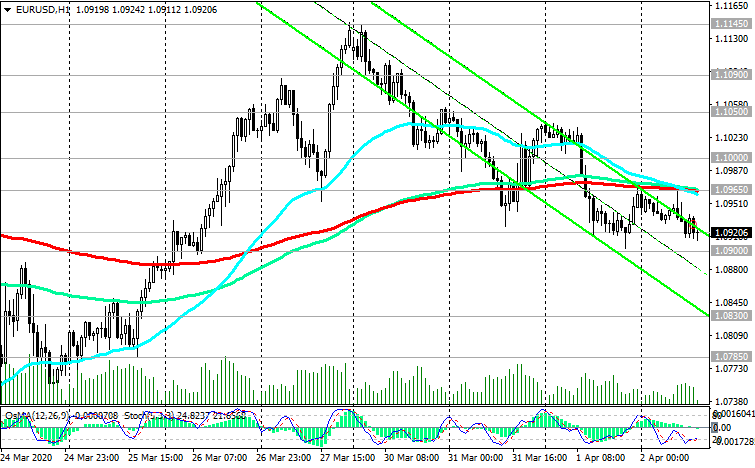
    Today, the EUR / USD pair is falling for the 4th day in a row, traded at the beginning of the European session near the level of 1.0925, below the resistance level of 1.1090.
    In Europe, the situation around the negative impact of coronavirus on the economy is even worse than in the United States.
    The current account surplus of the Eurozone balance of payments will provide some support to the euro. However, the growing political tensions and disagreements within the bloc may lower the EUR / USD to 1.0500 mark over the next 3 months, economists say. Will Eurozone leaders be able to resolve their differences over the economic response to the coronavirus pandemic? So, recently Germany and other countries of Northern Europe, members of the European Union, refused the proposal of Italy, France, Spain and six other countries of the Eurozone to issue joint bonds.
    EUR / USD also remains below important short-term resistance levels of 1.1000 (ЕМА200 on the 4-hour chart), 1.0965 (ЕМА200 on the 1-hour chart), which speaks in favor of short positions.
    Today, financial market participants will pay attention to the publication (at 12:30 GMT) of the US Department of Labor weekly report on the number of unemployment claims.
    It is expected that the number of initial claims for unemployment benefits in the week of March 20 - 27 will be 3,500,000, which will be a new, from October 1982, anti-record.
    The position of the dollar may suffer in the foreign exchange market, since extremely negative data from the US labor market will indicate a slowdown in the US economy, which may soon face the problem of not just recession, but also depression. According to a report presented last week, the number of initial claims for unemployment benefits amounted to 3,283,000. Economists attribute this to the coronavirus, which hit the US economy.
    In an alternative scenario, the growth of EUR / USD into the zone above the resistance levels of 1.0965, 1.1000 will speak about the resumption of upward dynamics.
    Support Levels: 1.0900, 1.0830, 1.0785, 1.0655, 1.0600, 1.0580, 1.0530
    Resistance Levels: 1.0965, 1.1000, 1.1050, 1.1090, 1.1145

    Trading Recommendations

    Sell by market. Stop-Loss 1.1010. Take-Profit 1.0900, 1.0830, 1.0785, 1.0655, 1.0600, 1.0580, 1.0530
    Buy Stop 1.1010. Stop-Loss 1.0960. Take-Profit 1.1050, 1.1090, 1.1145


    *) For up-to-date and detailed analytics and news on the forex market visit Tifia Forex Broker website tifia.com

  9. #679
    Senior Member TifiaFX's Avatar
    Join Date
    Mar 2017
    Posts
    697
    Brent: price increases may be limited
    03/04/2020

    The news that major oil producers, including Saudi Arabia and Russia, on Monday will discuss the possibility of reducing production, has given new impetus to oil prices. Earlier Thursday, oil prices strengthened significantly after U.S. President Donald Trump tweeted that he expects Russia and Saudi Arabia to agree to reduce production by millions of barrels. After that, Brent prices jumped by 47%, but then went down, as the Kremlin said it was not negotiating with Saudi Arabia.
    A little later, official sources in Saudi Arabia reported that the kingdom is ready to consider a significant reduction in production, if other G20 countries support it.
    On Thursday, Brent crude rose 21% to $ 29.94, showing a record one-day increase since 1988, and on Friday its price has continued to rise.
    If OPEC does not receive signals from US companies that they will also limit oil production, then the oil coalition and Russia will most likely not reduce production, which will lead to a resumption of price reductions.
    But still, Russia may go for some reduction in production, as it is forced to do so. An unprecedented drop in demand due to coronavirus has led to the lack of demand for some oil shipments and to the rapid filling of storage facilities.
    For technical reasons, Saudi Arabia and Russia may go for a slight decrease in production, but this is unlikely to greatly change the direction of the current trend of oil quotes. And it is downward at the moment. There are simply no buyers for the current volume of oil supply.
    Today, the oversupply is approximately 20 million barrels of oil per day. Oil storages are overcrowded, while gas and diesel consumption has declined.
    In the current situation of the prevalence of supply over demand, Brent oil prices may soon fall below the recent 18-year low and test the strength of $ 10 per barrel.
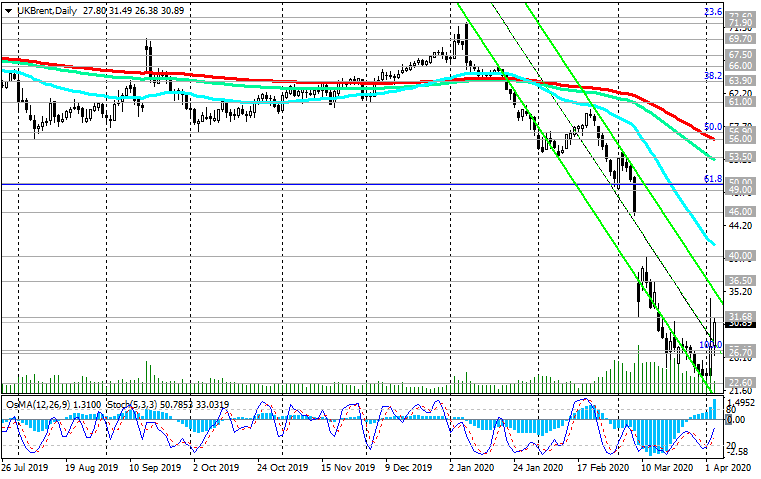
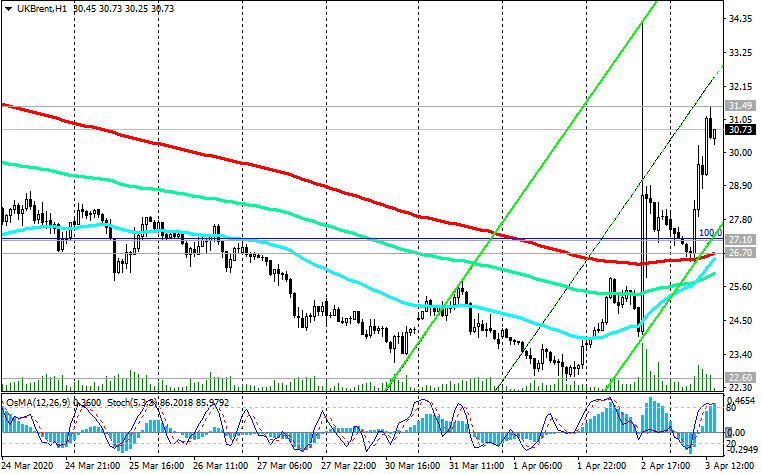
    Meanwhile, from a technical point of view, there may still be some increase in the price of Brent crude oil to resistance levels near 36.50 (EMA200 on the 4-hour chart) and even 40.00 (local maximum).
    The price broke through an important short-term resistance level of 26.70 (ЕМА200 on the 1-hour chart), and technical indicators on the 1-hour, 4-hour, daily charts turned to the long positions.
    But only a breakdown of the key resistance level 56.00 (EMA200 on the daily chart) will resume the bullish trend. Below this level of resistance, long-term negative dynamics prevail.
    If the decline resumes, then after returning to the zone below the level of 26.70, the price will go towards annual and long-term lows near the level of 22.60, and possibly even lower.
    Support Levels: 27.10, 26.70, 22.60
    Resistance Levels: 32.00, 36.50, 40.00, 46.00, 50.00, 53.50, 56.00, 56.90, 60.00, 61.00

    Trading Recommendations

    Sell Stop 27.70. Stop-Loss 32.10. Take-Profit 27.10, 26.70, 22.60, 21.00, 20.00
    Buy Stop 32.10. Stop-Loss 27.70. Take-Profit 36.50, 40.00, 46.00, 50.00, 53.50, 56.00


    *) For up-to-date and detailed analytics and news on the forex market visit Tifia Forex Broker website tifia.com

  10. #680
    Senior Member TifiaFX's Avatar
    Join Date
    Mar 2017
    Posts
    697
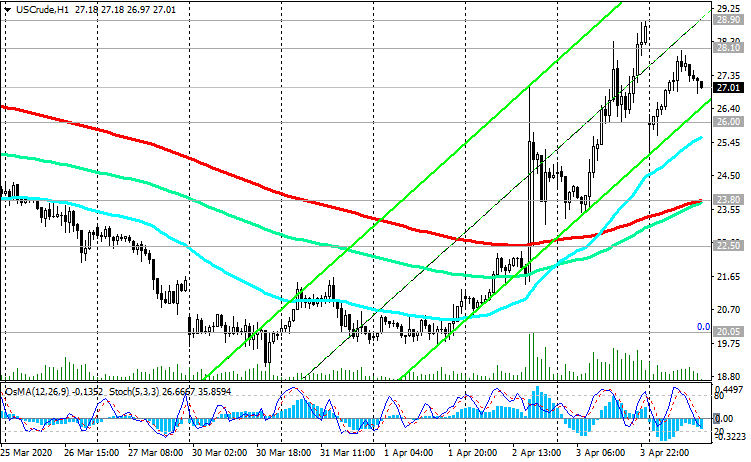
    WTI: negative dynamics
    06/04/2020

    Despite the opening of today's trading day with the gap down (due to the fact that the OPEC+ teleconference was postponed to Thursday), during the Asian session, oil prices rose again. At the beginning of today's European session, WTI crude oil is traded near 27.00 mark.
    OPEC+ was expected to resume consultations as early as Monday to consider the possibility of a coordinated reduction in production by 10 million barrels per day. OPEC also hoped that the United States would join the teleconference, however, the event was postponed for four days amid some disagreement between Saudi Arabia and Russia, and also because of the US’s unwillingness to decide on its own production cuts.
    Now the Organization of Petroleum Exporting Countries (OPEC) will convene in a virtual meeting on Thursday with the participation of several other oil producing countries, including Canada and Russia. Negotiations are expected to mark the end of the price war between Saudi Arabia and Russia, which led to a record collapse in oil prices over the past 30 days.
    Oil market participants are optimistic about the outcome of this teleconference, even if they are more modest than a 10 million barrels a day reduction in oil, as Russian President Putin said last week.
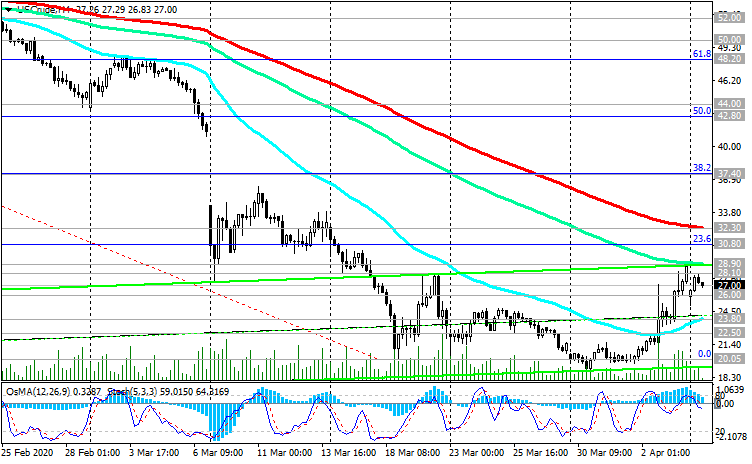
    From a technical point of view, the first signal for purchases (breakdown of the resistance level of 22.50 - ЕМА200 on the 1-hour chart) worked.
    If the growth continues, the immediate targets will be the resistance levels 28.90 (local maximum and ЕМА144 on the 4-hour chart), 30.80 (Fibonacci level 23.6% of the upward correction to the fall from this year's highs near 65.65 to the local minimum 20.05), 32.30 (ЕМА200 on the 4-hour chart).
    However, long-term purchases of oil futures should still be abstained. A coronavirus pandemic and a slowdown in the global economy will put pressure on oil prices in the long run for at least several weeks, or even months.
    So far, a strong negative momentum prevails, holding oil quotes near multi-year lows.
    Support Levels: 26.00, 23.80, 22.50, 22.00, 21.00, 20.05
    Resistance Levels: 28.10, 28.90, 30.80, 32.30, 37.40, 42.80, 44.00, 48.20, 50.00, 52.00

    Trading Recommendations

    Sell by market. Stop-Loss 29.10. Take-Profit 26.00, 23.80, 22.50, 22.00, 21.00, 20.05
    Buy Stop 29.10. Stop-Loss 25.80. Take-Profit 28.90, 30.80, 32.30, 37.40, 42.80, 44.00, 48.20, 50.00


    *) For up-to-date and detailed analytics and news on the forex market visit Tifia Forex Broker website tifia.com

Page 68 of 70 FirstFirst ... 18 58 66 67 68 69 70 LastLast

Tags for this Thread

Bookmarks

Posting Permissions

  • You may not post new threads
  • You may not post replies
  • You may not post attachments
  • You may not edit your posts
  •