DJIA: Current Dynamics
11/18/2019
US stock indexes continue to grow and break new records, updating absolute highs.
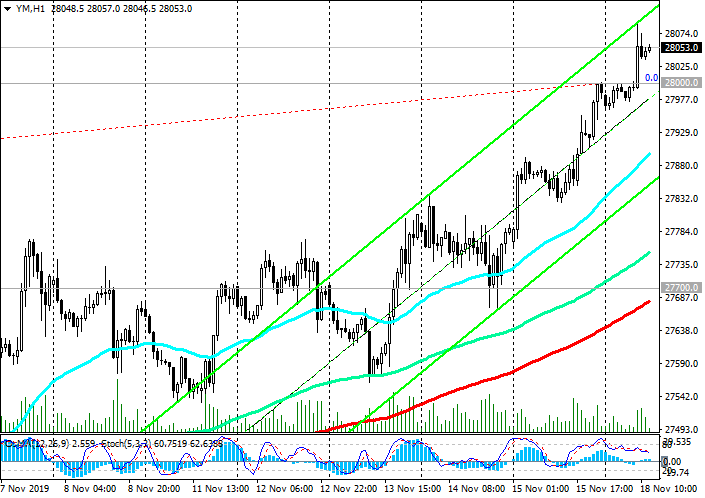
At the beginning of the European session on Monday, the S&P 500 is trading near the 3122.0 mark, and the Nasdaq100 is near the 8330.0 mark. Dow Jones Industrial Average broke through the resistance level of 28000.0, trading at the time of publication of the article near the mark of 28050.00.
Investor enthusiasm stems from expectations of a trade agreement between the US and China. Investors continue to follow any comments by the US and Chinese authorities regarding trade negotiations. The deterioration of prospects in this direction may again bring down stock indices.
The Fed’s propensity to maintain soft policy, as well as a revival of economic activity in the US, which is exceeded by expectations for GDP data for the 3rd quarter and the improvement of the American labor market in October, according to data presented at the beginning of the month, are also of positive importance for American stock indices.
In an alternative scenario, the signal for DJIA sales will be a breakdown of the short-term support level of 27700.0 (ЕМА200 on the 1-hour chart). The immediate goal of the decline is located at the support level of 27250.0 (ЕМА200 on the 4-hour chart).
In case of further decline, the targets will be the key support levels 26600.0 (ЕМА144 on the daily chart), 26400.0 (ЕМА200 on the daily chart).
The breakdown of the support level of 26400.0 may provoke a further decrease to support levels of 25270.0 (August lows), an important support level of 25050.0 (Fibonacci level 23.6% of the correction to the DJIA growth wave, which began in February 2016 from 15500.0), 24600.0 (lows of June 2019).
Nevertheless, the long-term positive dynamics of US stock indices remains. Long positions by DJIA are preferred.
On Wednesday (at 19:00 GMT) the minutes of the October meeting of the Fed will be published, which may cause increased volatility in the financial markets if the protocol texts contain unexpected information regarding the prospects for monetary policy or the state of the US economy.
Support Levels: 28000.0, 27700.0, 27400.0, 27250.0, 26900.0, 26600.0, 26400.0
Resistance Levels: 28100.0
Trading Scenarios
Buy in the market. Stop-Loss 27680.0. Take-Profit 28100.0, 28500, 29000.0
Sell Stop 27680.0. Stop-Loss 28040.0. Take-Profit 27400.0, 27250.0, 26900.0, 26600.0, 26400.0
*) For up-to-date and detailed analytics and news on the forex market visit Tifia Forex Broker website tifia.com


 1Likes
 LinkBack URL
 About LinkBacks




 Reply With Quote




Bookmarks