Page 41 of 70 FirstFirst ... 31 39 40 41 42 43 51 ... LastLast
Results 401 to 410 of 698
Like Tree1Likes

Tifia Daily Market Analytics

This is a discussion on Tifia Daily Market Analytics within the Analytics and News forums, part of the Trading Forum category; EUR/USD: pending US retail statistics 14/02/2019 Futures on the dollar index DXY, reflecting its value against a basket of 6 ...


  1. #401
    Senior Member TifiaFX's Avatar
    Join Date
    Mar 2017
    Posts
    697
    EUR/USD: pending US retail statistics
    14/02/2019

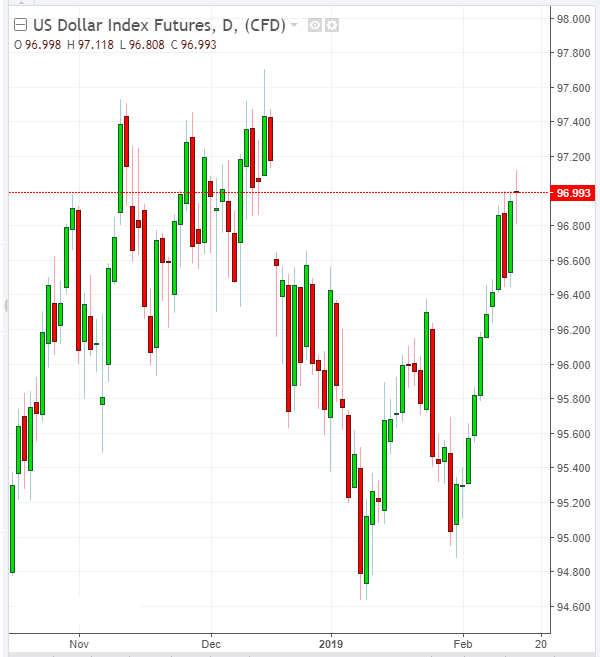
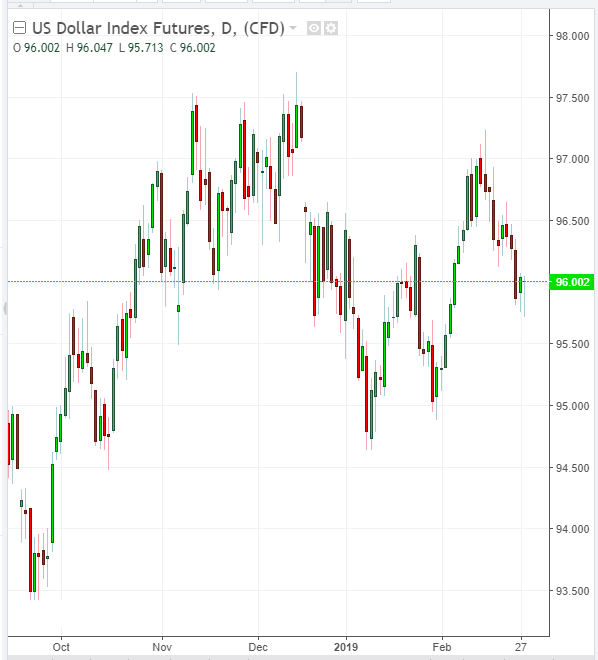
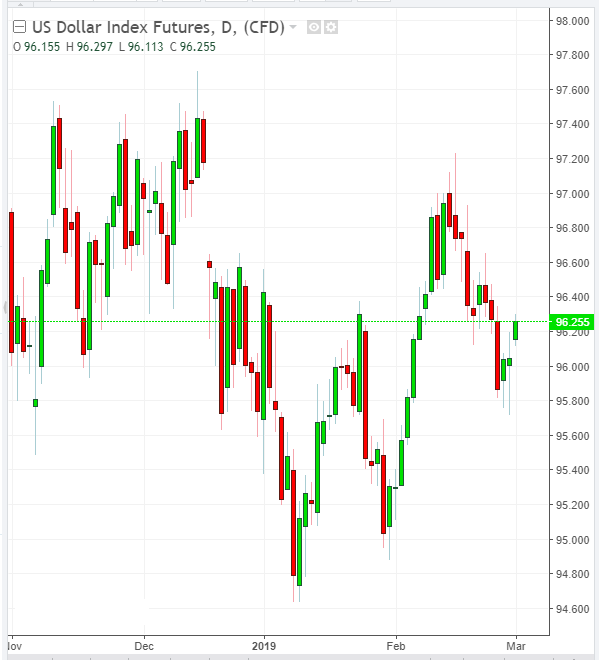
    Futures on the dollar index DXY, reflecting its value against a basket of 6 major world currencies, is traded on Thursday almost unchanged before the publication of US reports on inflation and retail sales, near the mark of 97.00. The DXY dollar index has been growing for the second week in a row.
    On Wednesday, the growth of the dollar was supported by positive macro statistics, which indicated a rise in inflation in the US + 1.6% in January, which turned out to be better than the forecast + 1.5%. The base consumer price index (excluding food and energy) in January increased by 2.2% (the forecast was + 2.1%). The data indicated that inflation in the US is near the target Fed level of 2%. If inflation continues in the coming months, the likelihood of another interest rate increase in the United States will increase, making the dollar more expensive and attractive to investors.
    At the same time, European macro statistics released on Thursday indicated a slowdown in the European economy at the end of 2018.
    According to the data of the Federal Bureau of Statistics of Germany, published on Thursday, the country's GDP grew in the 4th quarter of 2018 by only 0.1% after a decrease in the 3rd quarter of 2018 by 0.8% (year-on-year).
    The German economy in the 4th quarter of 2018 for the first time in six years was on the verge of recession.
    Eurozone GDP in the 4th quarter rose by + 0.2% (+ 1.2% in annual terms), which coincided with the forecast and the first estimate. Eurozone GDP growth in 2018 was 1.8% versus 2.4% in 2017, which once again indicated a slowdown in the growth of the European economy.
    The Eurodollar reacted negatively to the publication of statistics on Wednesday and Thursday, updating the 3-month low near the 1.1249 mark.
    On Thursday, market participants will follow the publication of US retail sales data at 1:30 pm (GMT). Retail sales in the US are expected to increase by + 0.4% in December (against + 0.9% in November and + 0.3% in October).
    In general, the indicators can be considered positive. However, their relative decline may adversely affect the dollar quotes. Data better than the forecast will resume the growth of the dollar.
    *)An advanced fundamental analysis is available on the Tifia Forex Broker website at tifia.com/analytics

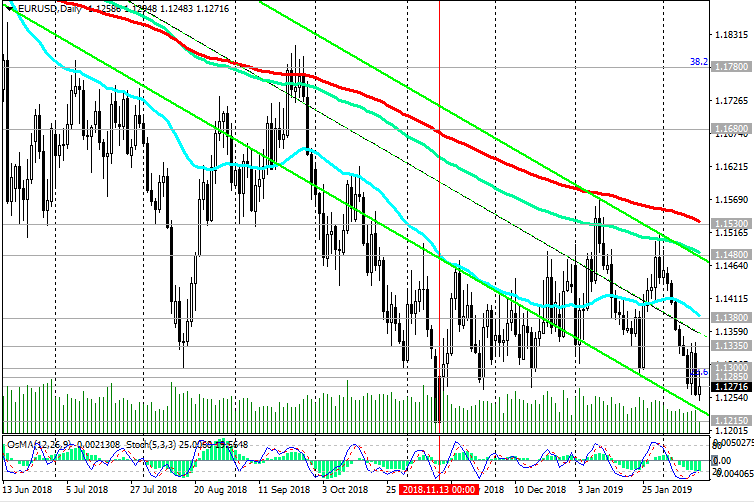
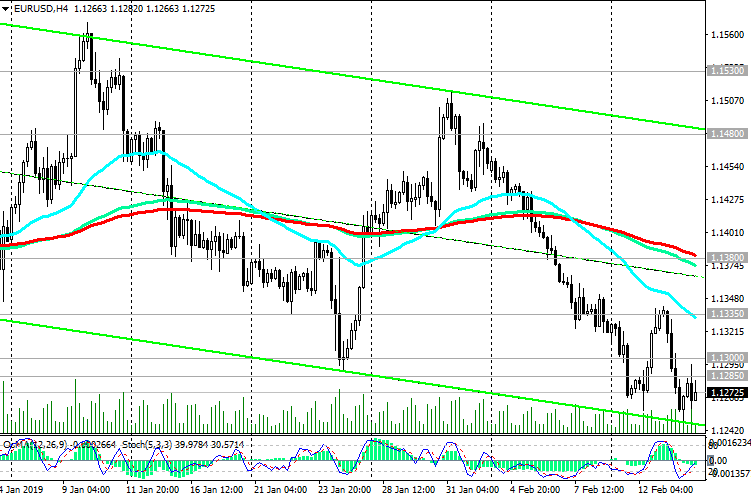
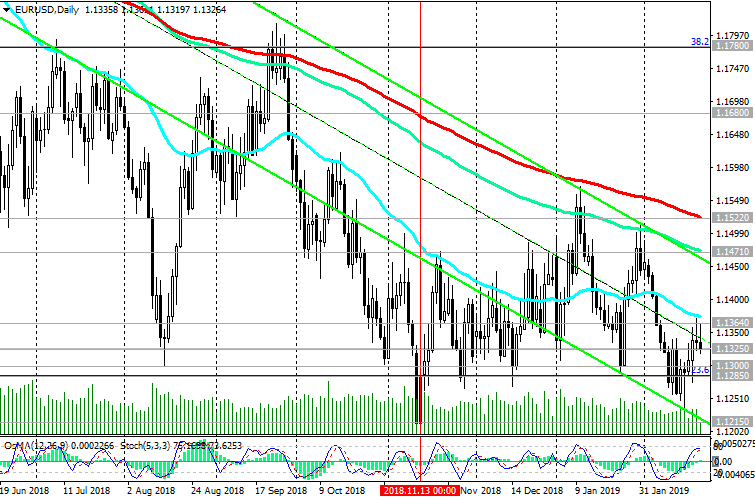
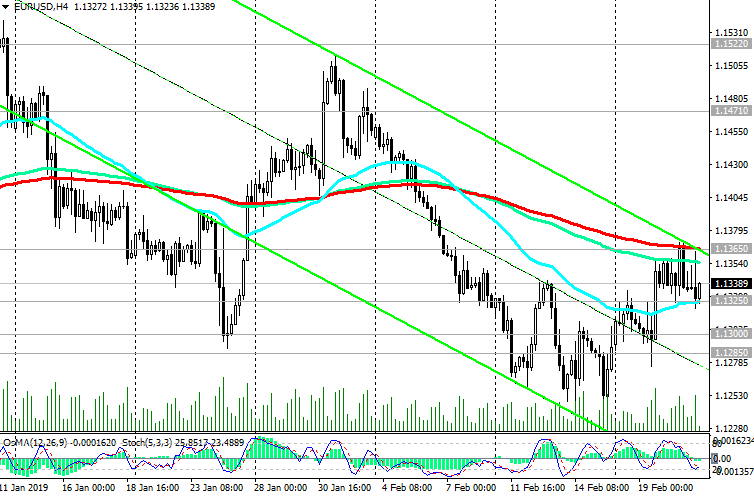
    Currently, EUR / USD is trading near 1.1270, below key resistance levels of 1.1530 (ЕМА200 on the daily chart), 1.1480 (ЕМА144 and the upper line of the downward channel on the daily chart). Downward dynamics prevail. A further decline is likely with targets at support levels of 1.1215 (November and year lows), 1.1200, 1.1000 (bottom line of the downward channel on the weekly chart).
    Support Levels: 1.1270, 1.1215, 1.1120, 1.1000
    Resistance Levels: 1.1335, 1.1380, 1.1480, 1.1530, 1.1680, 1.1780

    Trading recommendations

    Sell Stop 1.1245. Stop-Loss 1.1310. Take-Profit 1.1215, 1.1120, 1.1000
    Buy Stop 1.1310. Stop Loss 1.1245. Take-Profit 1.1335, 1.1380, 1.1480, 1.1530


    *) For up-to-date and detailed analytics and news on the forex market visit Tifia Forex Broker website tifia.com

  2. #402
    Senior Member TifiaFX's Avatar
    Join Date
    Mar 2017
    Posts
    697
    WTI: Market expectations
    15/02/2019

    On Friday, WTI oil prices are in a narrow range near $54.50 a barrel, and oil market participants are waiting for the publication (at 18:00 GMT) of a weekly report from the American oilfield service company Baker Hughes on the number of active oil drilling rigs in the US. Their number increased in the previous week and currently stands at 854 units, although this is below the maximum of 887 units reached at the end of 2018.
    At the moment, oil prices are recovering after falling in the 4th quarter of 2018 (oil prices in the end of December hit bottom near the mark of 42.00 dollars per barrel of WTI crude oil). Rising oil prices create an incentive for American oil companies to increase production, which, in turn, is a deterrent to rising oil prices. The increase in the number of drilling rigs is a negative factor for oil prices and will create prerequisites for the subsequent decline in oil prices.
    At the present moment, a number of positive fundamental factors prevail over negative ones. Possible further rise in oil prices.
    *)An advanced fundamental analysis is available on the Tifia Forex Broker website at tifia.com/analytics

    Last Tuesday, the price of WTI crude oil broke through an important resistance zone at 52.75 (ЕМА200 on 4-hour chart), 53.10 (ЕМА200 on 1-hour chart, ЕМА50 on the daily chart) and maintains a positive trend, trading on Friday at resistance level of 54.50 (December highs).
    In case of breakdown of the local resistance level of 55.50, the price growth will continue with targets at the resistance levels of 56.50 (ЕМА200 on the weekly chart), 57.80 (ЕМА144 on the daily chart and the Fibonacci 38.2% level of the correction to the growth wave that started in February 2016 from the support level, passing near the mark of 27.30), 59.00 (EMA200 on the daily chart).
    The alternative scenario will be associated with the breakdown of the support level of 52.00 (Fibonacci level of 50%) and the resumption of decline in the downstream channels on the daily and weekly charts, the lower limit of which passes near the mark of 27.30.
    So far, positive dynamics prevail. Long positions are preferred.
    Support Levels: 53.55, 53.10, 52.75, 52.00, 51.60, 50.25, 50.00, 49.00, 46.00, 42.20
    Resistance Levels: 55.50, 56.50, 57.00, 57.80, 59.00, 60.00

    Trading Scenarios

    Sell Stop 52.90. Stop Loss 55.10. Take-Profit 52.75, 52.00, 51.60, 50.25, 50.00, 49.00, 46.00, 42.20
    Buy Stop 55.10. Stop Loss 52.90. Take-Profit 55.50, 56.50, 57.00, 57.80, 59.00, 60.00


    *) For up-to-date and detailed analytics and news on the forex market visit Tifia Forex Broker website tifia.com

  3. #403
    Senior Member TifiaFX's Avatar
    Join Date
    Mar 2017
    Posts
    697
    EUR/USD: Support and resistance levels
    18/02/2019

    At the beginning of the European trading session, the EUR / USD pair is trading above the support level of 1.1300, attempting to break the short-term resistance level of 1.1320 (ЕМА200 on the 1-hour chart).
    The indicators OsMA and Stochastic on the 1-hour, 4-hour, daily charts turned to long positions.
    In case of a breakdown of the resistance level and continued growth, EUR / USD will be able to reach the next important resistance level of 1.1375 (ЕМА200 on the 4-hour chart, ЕМА50 on the daily chart).
    The maximum correctional growth is possible to the key resistance levels of 1.1480 (EMA144 on the daily chart), 1.1530 (EMA200 on the daily chart). Above the resistance level of 1.1530, growth is unlikely against the background of strong fundamental factors indicating the slowdown of the European economy and the acceleration of the American economy.
    The dollar remains the preferred currency. Downward dynamics prevail. Short positions are preferred.
    In case of resumption of decline and after the breakdown of the support level of 1.1285 (Fibonacci 23.6% of the correction to the fall from the level of 1.3900, which began in May 2014), the reduction targets will be the support levels of 1.1270 (December lows), 1.1215 (November and year lows), 1.1200, 1.1000 (bottom line of the downward channel on the weekly chart).
    Today is a public holiday on the occasion of President’s Day The exchanges will be closed, trading volumes will be small.
    Probably, until the end of today's trading day, the EUR / USD pair will remain trading near the current levels and the support level of 1.1300. Breakdown of the resistance level of 1.1320 today is unlikely due to the lack of important news drivers and low trading volumes.
    *)An advanced fundamental analysis is available on the Tifia Forex Broker website at tifia.com/analytics

    Support Levels: 1.1300, 1.1285, 1.1215, 1.1120, 1.1000
    Resistance Levels: 1.1320, 1.1375, 1.1480, 1.1530

    Trading recommendations

    Sell Stop 1.1290. Stop Loss 1.1335. Take-Profit 1.1215, 1.1120, 1.1000
    Buy Stop 1.1335. Stop Loss 1.1280. Take-Profit 1.1375, 1.1480, 1.1530
    *) For up-to-date and detailed analytics and news on the forex market visit Tifia Forex Broker website tifia.com

  4. #404
    Senior Member TifiaFX's Avatar
    Join Date
    Mar 2017
    Posts
    697
    GBP/USD: Brexit theme is in the foreground
    02/19/2019
    Current dynamics

    The data presented on Tuesday by the National Bureau of Statistics of the United Kingdom, which generally coincided with the forecast, indicated an increase in the average wage in the country from October to December (excluding bonuses by 3.4%) and a decrease in the number of unemployed.
    Unemployment remained at 4%, the lowest in four decades, the number of unemployed in the UK from October to December declined by 14,000 compared with the previous three-month period. The growth rate of wages far exceeds inflation, which in January was 1.8%.
    However, the Bank of England is unlikely to take any action regarding monetary policy, given the uncertainty about the prospects for Brexit.
    The economic performance of the UK is still in the background, as market participants expect clarification of prospects for Brexit.
    The British pound almost did not respond to strong data on the UK labor market, indicating an increase in average wages and a decrease in the number of unemployed.
    Now market participants will expect the results of the voting next week in the British Parliament regarding Brexit. If British Prime Minister Theresa May is defeated again, the pound will again be under pressure. If there is no agreement between the EU and the UK regarding trade relations after March 29 (the UK’s exit date), then a "hard" Brexit, as Bank of England CEO Mark Carney stated earlier, will be a disaster for the British economy. This may not happen in reality; however, a significant blow will be dealt to the pound in the foreign exchange market.
    *)An advanced fundamental analysis is available on the Tifia Forex Broker website at tifia.com/analytics

    For now, the GBP / USD remains within the narrow range between the support level of 1.2900 (ЕМА200 on the 1-hour chart, ЕМА200 on the 4-hour chart, ЕМА50 on the daily chart) and the resistance level of 1.2960 (ЕМА144 on the daily chart).
    So far, more likely resumption of decline. In the event of a breakdown of the support level of 1.2700, the targets for the decline will be the support levels of 1.2600 (lows of June 2017), 1.2485, 1.2365.
    Support Levels: 1.2900, 1.2800, 1.2785, 1.2700, 1.2670, 1.2600, 1.2485, 1.2365, 1.2110, 1.2000
    Resistance Levels: 1.2960, 1.3020, 1.3065, 1.3125, 1.3210

    Trading scenarios

    Sell Stop 1.2890. Stop Loss 1.2970. Take-Profit 1.2800, 1.2785, 1.2700, 1.2670, 1.2600, 1.2485, 1.2365
    Buy Stop 1.2970. Stop Loss 1.2890. Take-Profit 1.3020, 1.3065, 1.3125, 1.3210


    *) For up-to-date and detailed analytics and news on the forex market visit Tifia Forex Broker website tifia.com

  5. #405
    Senior Member TifiaFX's Avatar
    Join Date
    Mar 2017
    Posts
    697
    AUD/USD: on the eve of the publication of the minutes from the January Fed meeting
    20/02/2019

    The focus of traders on Wednesday will be the publication (19:00 GMT) of the minutes from the January Fed meeting. Earlier in the week, New York Fed President John Williams said he did not see the need to raise interest rates if growth or inflation rates did not change.
    Fed Chairman Jerome Powell, after the January meeting of the Fed, also spoke more restrained about the prospects for further monetary tightening, saying that "the policy is not predetermined. We (at the Fed) will pay close attention to incoming economic and financial data".
    If the texts of the protocols are also soft in content and rhetoric of statements by the Fed leaders, this will have a stimulating effect on the US stock markets.
    The dollar is likely to react with more restraint to the publication of the protocols, since market participants are unlikely to find something new for themselves in them.
    Recently, there has been a restrained approach on the part of the leaders of world central banks with regard to the monetary policy of their banks.
    The decisive role in these conditions for the dynamics of the US dollar will be played by macro statistics coming from the United States.
    In the context of world trade wars, the American economy looks more stable, which will attract investment in it and will support the demand for the dollar in the long term.
    For traders who trade AUD and AUD / USD, pay attention to the publication at 00:30 (GMT) on Thursday of data from the Australian labor market.
    As expected, in January, the number of employed Australian citizens increased by 15,000 people (against +21600 in December), while unemployment remained unchanged at 5%. In general, the indicators can be called positive. Data better than forecast will strengthen AUD.
    On Wednesday, the Australian Finance Minister said that “risks (for the Australian economy) are increasing both domestically and abroad”, although, in his opinion, “the labor market remains strong”, and “will eventually support wage growth”.
    *)An advanced fundamental analysis is available on the Tifia Forex Broker website at tifia.com/analytics

    Meanwhile, AUD / USD is trading on Wednesday at the 0.7150 balance line (ЕМА50 on the daily chart, ЕМА200 on the 4-hour chart), which is also in the middle of the range between the levels of 0.7055 (February lows) and 0.7225 (ЕМА144 on the daily chart).
    In case of breakdown of the local resistance level of 0.7180, AUD / USD will go to the upper part of the specified range and to resistance levels of 0.7225, 0.7275 (ЕМА200 on the daily chart). Growth above the resistance level of 0.7275 is unlikely.
    The breakdown of the short-term support level of 0.7130 (ЕМА200 on the 1-hour chart) will be a signal to resume sales with targets at the support levels of 0.6910 (lows of September 2015), 0.6830 (2016 lows).
    Support Levels: 0.7150, 0.7130, 0.7100, 0.7085, 0.7055, 0.7025
    Resistance Levels: 0.7225, 0.7275

    Trading recommendations

    Sell Stop 0.7120. Stop Loss 0.7180. Take-Profit 0.7100, 0.7085, 0.7025, 0.6910, 0.6830
    Buy Stop 0.7180. Stop Loss 0.7120. Take-Profit 0.7225, 0.7245, 0.7275


    *) For up-to-date and detailed analytics and news on the forex market visit Tifia Forex Broker website tifia.com

  6. #406
    Senior Member TifiaFX's Avatar
    Join Date
    Mar 2017
    Posts
    697
    EUR/USD: breakdown of the range is expected
    02/21/2019

    Euro sluggishly reacted to the publication at the beginning of the European session on Thursday of the purchasing managers' indices (PMI) for the manufacturing sector in Germany (according to IHS Markit) and the services sector. In February, the PMI for the manufacturing sector fell to 47.6 (the forecast was 49.7), which was the lowest level in more than six years.
    The composite PMI index of the Eurozone in February came out with a value of 51.4 (the forecast was 51.1 and 51.0 in January).
    *)An advanced fundamental analysis is available on the Tifia Forex Broker website at tifia.com/analytics

    The EUR / USD pair for the second day continues to trade in the range between the levels of 1.1325 (ЕМА200 on the 1-hour chart) and 1.1365 (ЕМА200 on the 4-hour chart).
    A breakthrough in one direction or another will determine the further dynamics of EUR / USD.
    The growth targets in case of continuation of the upward correction will be the resistance levels of 1.1471 (ЕМА144 and the upper limit of the downward channel on the daily chart), 1.1522 (ЕМА200 on the daily chart). Below these levels, there is a long-term bearish trend that began in May 2014 near the 1.3870 mark.
    In case of breakdown of the support level of 1.1325, the targets for the decline will be the support levels of 1.1270 (December lows), 1.1215 (November and year lows), 1.1200, 1.1000 (the lower line of the downward channel on the weekly chart).
    Short positions are preferred.
    Support Levels: 1.1325, 1.1300, 1.1285, 1.1215, 1.1120, 1.1000
    Resistance Levels: 1.1365, 1.1471, 1.1522

    Trading recommendations

    Sell Stop 1.1310. Stop-Loss 1.1380. Take-Profit 1.1285, 1.1215, 1.1120, 1.1000
    Buy Stop 1.1380. Stop-Loss 1.1310. Take-Profit 1.1471, 1.1522


    *) For up-to-date and detailed analytics and news on the forex market visit Tifia Forex Broker website tifia.com

  7. #407
    Senior Member TifiaFX's Avatar
    Join Date
    Mar 2017
    Posts
    697
    WTI: long positions are preferred
    02/22/2019

    Despite another increase in oil reserves in the US storages, oil prices continue to grow. According to the Energy Information Administration (EIA), the US Department of Energy, oil reserves in storage last week rose by 3.672 million barrels (the forecast was +3.080 million barrels). At the same time, oil production in the United States grew by 100,000 barrels to a record 12 million barrels per day. Thus, oil reserves in the United States rose to 455 million barrels, the highest level since November 17, 2017.
    The growth of oil prices contributes to a number of fundamental factors. Among them - the recovery of stock markets, investor optimism regarding the positive outcome of trade negotiations between the US and China, expectations of a further reduction in production at OPEC, increased risks of disruptions in oil supplies from Venezuela.
    On Friday, oil market participants will be waiting for the publication (at 18:00 GMT) of a weekly report from the American oilfield service company Baker Hughes on the number of active oil drilling rigs in the United States. Their number increased in the previous week and currently stands at 857 units, although this is below the maximum of 887 units reached at the end of 2018.
    At the moment, oil prices are recovering after falling in the 4th quarter of 2018 (oil prices in the end of December hit bottom near the mark of 42.00 dollars per barrel of WTI crude oil). Rising oil prices create an incentive for American oil companies to increase production, which, in turn, is a deterrent to rising oil prices. The increase in the number of drilling rigs is a negative factor for oil prices and creates prerequisites for the subsequent decline in oil prices.
    However, in the current situation, positive fundamental factors outweigh the negative ones, which creates prerequisites for a further increase in oil prices.
    *)An advanced fundamental analysis is available on the Tifia Forex Broker website at tifia.com/analytics

    To date, the price has reached the zone of important levels: resistance level 57.80 (EMA144 on the daily chart, Fibonacci 38.2% of the correction to the growth wave, which began in February 2016 with the support level near the level of 27.30), 59.00 (EMA200 on the daily chart) and support level 56.50 (EMA200 on the weekly chart).
    The indicators OsMA and Stochastic on the weekly and daily charts recommend long positions.
    Immediate growth targets are resistance levels 57.80, 59.00.
    In the case of a breakdown of the short-term support level of 55.50 (ЕМА200 on the 1-hour chart), the price will again go into the downward channel on the daily chart.
    This will return WTI oil prices to a bearish trend that began in October, with a target at the 42.20 support level (2017 and 2018 lows).
    In the current situation, long positions are preferred.
    Support levels: 56.50, 55.50, 53.80, 52.00, 50.25, 49.00, 46.00, 42.20
    Resistance Levels: 57.80, 59.00, 60.00

    Trading recommendations

    Sell Stop 55.40. Stop Loss 57.10. Take-Profit 53.80, 52.00, 50.25, 49.00, 46.00, 42.20
    Buy Stop 57.10. Stop Loss 55.40. Take-Profit 57.80, 59.00, 60.00


    *) For up-to-date and detailed analytics and news on the forex market visit Tifia Forex Broker website tifia.com

  8. #408
    Senior Member TifiaFX's Avatar
    Join Date
    Mar 2017
    Posts
    697
    NZD/USD: investors' optimism returned to the markets
    02/25/2019

    Progress in trade negotiations between the United States and China contributed to the growth of world stock indices and the weakening of the US dollar.
    US President Donald Trump tweeted last Sunday that he intends to postpone the increase in fees scheduled for March 1, explaining that to significant progress towards a trade agreement.
    The new trade agreement between the two countries will end the trade war and revive investor optimism, pushing global stock markets to accelerate recovery after falling in the 4th quarter.
    China's leading stock indexes ended the trading session on Monday at new heights, thanks to optimism about the US-China trade negotiations.
    Leading stock indicators of the country on Monday rose by about 5.5%. For the Chinese stock exchanges, this was the best trading day since 2015.
    At the same time, the US dollar resumed its decline on Monday, including against the yuan and major commodity currencies, such as Canadian, Australian, New Zealand dollars.
    The pair NZD / USD was trading at the beginning of the European session near the level of 0.6890, which is 0.5% higher than the closing price of the previous week (at the level of 0.6842).
    The data, which indicated the growth of retail sales in New Zealand in the 4th quarter compared to the 3rd quarter (by 1.7% while the growth forecast was +0.5% and +0.3% in the previous quarter), also contributed the growth of the New Zealand dollar. This positive information was published at the beginning of the trading day on Monday.
    On Tuesday and Wednesday, Fed Chairman Jerome Powell will give a speech in the US Congress. If he shows a tendency toward a softer monetary policy, the US dollar will continue to decline, including against the NZD.
    *)An advanced fundamental analysis is available on the Tifia Forex Broker website at tifia.com/analytics

    Meanwhile, NZD / USD is developing a positive trend above key support levels of 0.6860 (Fibonacci level 23.6% of the upward correction to the global wave of the pair's decline from the level of 0.8800, started in July 2014; wave minima are near the level of 0.6260), 0.6815 (ЕМА200 on daily chart). Growth targets are resistance levels of 0.6970 (December highs and EMA144 on the weekly chart), 0.7070 (EMA200 on the weekly chart).
    So far, positive dynamics prevail. Above the support level of 0.6815 long positions are preferable.
    Support Levels: 0.6860, 0.6815, 0.6785, 0.6745, 0.6710, 0.6655, 0.6515, 0.6430
    Resistance Levels: 0.6900, 0.6970, 0.7070

    Trading recommendations

    Sell Stop 0.6850. Stop-Loss 0.6910. Take-Profit 0.6815, 0.6785, 0.6745, 0.6710, 0.6655, 0.6515, 0.6430
    Buy Stop 0.6910. Stop Loss 0.6850. Take-Profit 0.6970, 0.7070


    *) For up-to-date and detailed analytics and news on the forex market visit Tifia Forex Broker website tifia.com

  9. #409
    Senior Member TifiaFX's Avatar
    Join Date
    Mar 2017
    Posts
    697
    XAU/USD: Current trend
    02/28/2019

    The dollar index stopped falling after the publication of stronger than expected US GDP data. According to the data released on Thursday by the US Department of Commerce, gross domestic product, a broad indicator of goods and services produced in the United States, rose by 2.6% per annum in the 4th quarter (the forecast was + 2.2%). GDP growth by 2.6% was lower than economic growth by 3.4% in the 3rd quarter and 4.2% in the 2nd quarter. The pace of economic activity slowed down as consumers limited their spending and the housing market held back economic growth.
    This report by the Ministry of Commerce states that the decrease in services provided by the federal government due to the partial shutdown, that started on December 22 made a negative contribution to GDP growth of 0.1 percentage point in the 4th quarter.
    Consumer spending, which is more than two-thirds of US GDP, rose by 2.8% per annum in the 4th quarter after rising by 3.5% in the 3rd quarter. Americans' spending on services and consumer goods and short-term use has become more moderate.
    Nevertheless, the dollar reacted positively to the information provided. In the first half of the trading day on Thursday, the dollar was falling, and DXY dollar index futures, reflecting the value of the dollar against a basket of 6 major world currencies, were traded before the publication of US GDP data near the 95.75 mark, 25 points lower than the opening price of today's trading day. However, the DXY dollar index rose sharply after the publication of GDP data and moved to positive territory, above the 96.00 mark.
    In the first half of the trading day, investors increased the demand for defensive assets such as the yen, franc, and gold. However, the publication of positive information on US GDP strengthened the demand for the dollar and caused the sale of gold.
    *)An advanced fundamental analysis is available on the Tifia Forex Broker website at tifia.com/analytics

    At the same time, the XAU / USD pair maintains a positive trend, trading in the ascending channel on the daily chart, the upper limit of which passes near the mark of 1357.00 (2017 highs).
    In case of breakdown of a strong resistance level of 1326.00 (ЕМА200 on the 1-hour chart) the immediate goal of XAU / USD growth will be a local resistance level of 1346.00 (February and 2019 highs).
    In the case of renewed decline and breakdown of the support level of 1310.00 (ЕМА200 on the 4-hour chart) XAU / USD may decline to the key support level of 1266.00 (ЕМА200 on the weekly and daily charts) and further with the goals of decline at support levels of 1197.00 (November lows) , 1185.00 (Fibonacci level 23.6% of the correction to the wave of decline since July 2016), 1160.00 (minimums of 2018).
    Support Levels: 1316.00, 1310.00, 1303.00, 1297.00, 1277.00, 1266.00, 1248.00
    Resistance Levels: 1326.00, 1346.00, 1357.00, 1365.00, 1370.00, 1375.00

    Trading recommendations

    Sell Stop 1314.00. Stop Loss 1331.00. Take-Profit 1310.00, 1303.00, 1297.00, 1277.00, 1266.00, 1248.00, 1234.00, 1220.00, 1197.00, 1185.00, 1160.00
    Buy Stop 1331.00. Stop Loss 1314.00. Take-Profit 1346.00, 1357.00, 1365.00, 1370.00, 1375.00


    *) For up-to-date and detailed analytics and news on the forex market visit Tifia Forex Broker website tifia.com

  10. #410
    Senior Member TifiaFX's Avatar
    Join Date
    Mar 2017
    Posts
    697
    USD/CAD: Current Dynamics
    03/01/2019

    The US dollar declines on Friday against commodity currencies such as Australian, New Zealand and Canadian dollars. Participants in the financial market are inspired by the expectations of a speedy conclusion of a new trade agreement between China and the United States. As reported by the Bloomberg News agency on Thursday, the American negotiators will soon complete the preparation of a trade agreement with China, which may be signed in the coming weeks. The United States expects to complete the preparation of the agreement by mid-March, when President Donald Trump may meet with China’s leader Xi Jinping. US Treasury Secretary Stephen Mnuchin said Thursday that a 150-page document was being prepared, noting that "there is still a lot of work left".
    Earlier on Thursday, Larry Cudlow, director of the National Economic Council of the United States, said he had made "amazing" progress, and the signing of the agreement was approaching.
    World stock indices resumed their growth on Friday, while positive macro data came from China, indicating growth in the country's manufacturing sector. The final index of purchasing managers (PMI) for the manufacturing sector of China from Caixin in February was 49.9 against 48.3 in January, recovering to a 3-month high.
    Also, the growth of these currencies, including CAD, contributed by the growth of oil and commodity prices.
    *)An advanced fundamental analysis is available on the Tifia Forex Broker website at tifia.com/analytics

    USD / CAD is dropping on Friday. However, USD / CAD found support at a key level of 1.3135 (ЕМА200 on the daily chart).
    Strong support levels of 1.3235 (ЕМА200 on the 4-hour chart), 1.3182 (ЕМА200 on the 1-hour chart, ЕМА144 on the daily chart) are broken. Breakdown of support level 1.3135 will accelerate further decline. In this case, the USD / CAD will go to support levels 1.3090, 1.3020 (the bottom line of the downward channel on the daily chart).
    A return to the zone above the resistance level of 1.3235 will cause a resumption of the upward trend and the growth of USD / CAD with the closest targets at the local resistance levels of 1.3340, 1.3370.
    Support Levels: 1.3135, 1.3100, 1.3090, 1.3020
    Resistance Levels: 1.3182, 1.3235, 1.3340, 1.3370, 1.3450, 1.3600, 1.3665, 1.3790

    Trading Scenarios

    Sell Stop 1.3110. Stop Loss 1.3190. Take-Profit 1.3090, 1.3020
    Buy Stop 1.3190. Stop Loss 1.3110. Take-Profit 1.3235, 1.3340, 1.3370, 1.3450, 1.3600, 1.3665, 1.3790


    *) For up-to-date and detailed analytics and news on the forex market visit Tifia Forex Broker website tifia.com

Page 41 of 70 FirstFirst ... 31 39 40 41 42 43 51 ... LastLast

Tags for this Thread

Bookmarks

Posting Permissions

  • You may not post new threads
  • You may not post replies
  • You may not post attachments
  • You may not edit your posts
  •