Page 46 of 164 FirstFirst ... 36 44 45 46 47 48 56 96 146 ... LastLast
Results 451 to 460 of 1634

Wave Analysis by InstaForex

This is a discussion on Wave Analysis by InstaForex within the Analytics and News forums, part of the Trading Forum category; Forecast for EUR/USD on June 28, 2019 EUR/USD The third day began, as the euro hardly moves from its place ...


  1. #451
    Senior Member InstaForex Gertrude's Avatar
    Join Date
    Sep 2015
    Posts
    1,885
    Forecast for EUR/USD on June 28, 2019


    EUR/USD
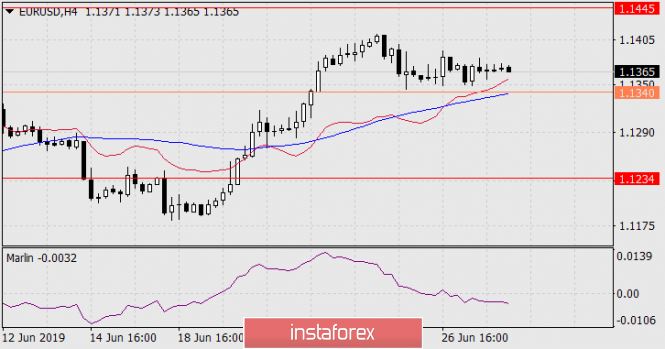
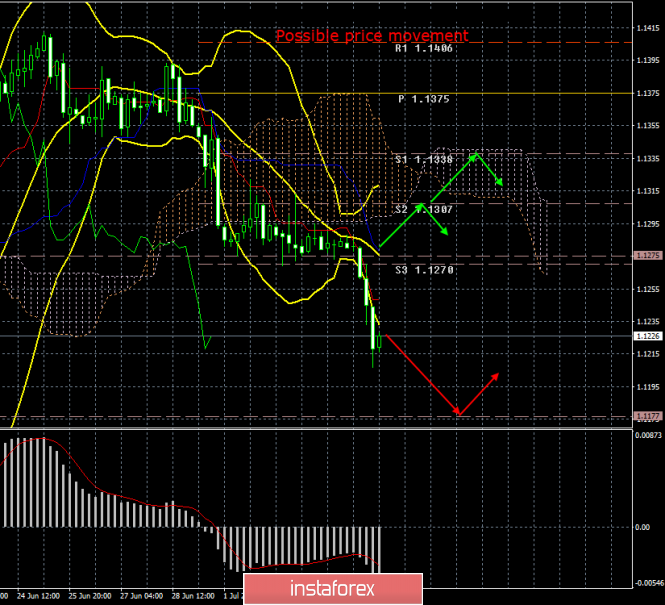
    The third day began, as the euro hardly moves from its place in anticipation of decisions from the fields of the G20 and the EU summit. As a result, the indicator lines on the H4 chart are approaching the current price, the oscillator lines on the daily and H4 continue to decline. Now, to create a signal in the medium-term sale, the price is enough to gain a foothold under the MACD line on the four-hour chart (1.1340), which is very close to the lows of the last days. The goal of reducing 1.1234 – the area of coincidence of the nested line of the price channel and the MACD line on the daily scale chart.

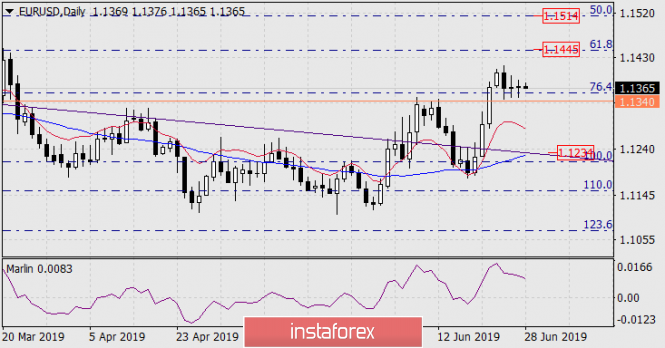
    But, despite the strengthening of the declining version of the order to 65%, the possibility of growth of 35% is high enough to be realized in the movement to 1.1514 – the Fibonacci level of 50% on the daily chart (coincides with the top of January 2019). The growth can consist of two stages: the movement to the Fibonacci level of 61.8% at the price of 1.1445 and the movement to 1.1514. It remains to wait for developments. Again, on the G20, preliminary events are still developing in favor of the dollar.

    Analysis are provided byInstaForex.
    Best regards, PR Manager
    Learn more about InstaForex Company at http://instaforex.com

  2. #452
    Senior Member InstaForex Gertrude's Avatar
    Join Date
    Sep 2015
    Posts
    1,885
    EURUSD: Unemployment will only provide temporary support for the euro, while other indicators will continue to disappoint

    The euro rose after a report that the number of applications for unemployment benefits in Germany fell, and the unemployment rate in the eurozone fell. This indicates a good state of the labor market, which has recently caused concern to the European Central Bank.

    However, ahead of the report on the labor market, there were indices for manufacturing in France, Italy, Germany and the eurozone, which leave much to be desired, confirming the negative impact of the protectionist policies of the United States and the slowdown in the global economy against trade conflicts.

    As I noted above, according to published official data, the number of applications for unemployment benefits in Germany in June of this year fell by 1,000, after rising by 60,000 in May. The employment agency noted that the weak economic situation continues to be reflected in the labor market. Taking into account the seasonal adjustment, unemployment in June remained at the level of 5.0%, whereas in April of this year it reached a record minimum of 4.9%. The number of registered vacancies in June was 798,000, which is also less than in May.

    The sharp rise in the euro occurred after it became known that the unemployment rate in the eurozone in May of this year fell, not coinciding with the forecasts of economists. However, looking ahead, it is necessary to say that speculative traders in vain ignored the report on the eurozone production index for June, the decline of which will force enterprises to reduce staff, adversely affecting the June report on the labor market.

    According to the data, in May of this year, the number of unemployed in the eurozone decreased by 103,000 people, while the unemployment rate itself fell to 7.5% (the level of the crisis of 2008) from 7.6% in April. The report noted that the largest reduction in the number of unemployed was registered in Spain and Italy.


    Why is low unemployment so important for the ECB? In addition to influencing the growth rate of the economy, low unemployment also stimulates the acceleration of inflation, which the regulator is counting on.

    Data on lending to companies in the eurozone were ignored by traders. According to the ECB report, in May of this year, compared with April, lending to non-financial companies increased by 3.9%, which corresponds to the April rate. Lending to households in the euro area in May increased by 3.3%, as well as in April. Eurozone M3 monetary aggregate grew by 4.8%, while economists had expected the indicator to grow by 4.6% in May.

    As I noted above, ignoring weak reports on production activity will not lead to anything good. According to the data, the PMI Purchasing Managers Index for the Italian manufacturing sector fell to 48.4 points in June, while Italy's manufacturing PMI was 49.7 points in May. In France, the same index rose slightly in June, reaching 51.9 points, against 50.6 points in May.

    In Germany, the situation with production activity remains at a very bad level. There, the index remained below 50 points, which indicates a reduction, and amounted to 45.0 points in June against 44.3 points in May. In the euro area as a whole, the PMI purchasing managers index for the manufacturing sector in June dropped even more - to 47.6 points versus 47.7 points in May.

    As for the technical picture of the EURUSD pair, it remained unchanged. The upward momentum after a good report on the eurozone labor market helped to carry out a number of stop-orders of speculative players, but the market remains on the sellers side. The purpose of the bears is the support test of 1.1310, below which the lows open as early as June 21 - 1.1285 and June 20 - 1.1225. In case of a breakout level of 1.1350, the upward correction will be limited to a high of 1.1370.

    Analysis are provided byInstaForex.
    Best regards, PR Manager
    Learn more about InstaForex Company at http://instaforex.com

  3. #453
    Senior Member InstaForex Gertrude's Avatar
    Join Date
    Sep 2015
    Posts
    1,885
    Technical analysis of GBP/USD for 03/07/2019:


    Technical Overview:
    The GBP/USD pair has broken below the 61% Fibonacci retracement located at the level of 1.2611 and is heading lower. The next technical support is seen at the level of 1.2559 and 1.2529. The key support is seen at the level of 1.2505 and if this level is violated the downtrend will accelerate. On the other hand, the nearest technical resistance is seen at the level of 1.2605.

    Weekly Pivot Points:
    WR3 - 1.2870
    WR2 - 1.2829
    WR1 - 1.2757
    Weekly Pivot - 1.2708
    WS1 - 1.2629
    WS2 - 1.2585
    WS1 - 1.2508

    Trading Recommendations:
    The best strategy for the current market conditions is to buy the corrections in anticipation of the uptrend to resume. This strategy is valid as long as the level of 1.2505 is clearly violated. The larget time frame trend is still down and the recent rally up is the first sign the trend might be reversing. The key long-term technical resistance is seen at the level of 1.2775 and only if this level is violated, there is a chance for the trend reversal.

    Analysis are provided byInstaForex.
    Best regards, PR Manager
    Learn more about InstaForex Company at http://instaforex.com

  4. #454
    Senior Member InstaForex Gertrude's Avatar
    Join Date
    Sep 2015
    Posts
    1,885
    AUD/USD: commodity market growth and the "hangover" of dollar bulls

    The Australian dollar continues to gain momentum: the AUD/USD pair confidently overcame the key mark of 0.7000 and consolidated in the middle of the 70th figure. For two days, the pair shows a nearly recoilless growth, returning lost positions. It is noteworthy that the aussie turned 180 degrees after the July meeting of the RBA, at which the regulator lowered the interest rate and allowed a further easing of monetary policy. Such an abnormal market reaction is primarily associated with the general weakening of the US currency. In addition, the aussie continues to receive support from domestic data and the commodity market - in particular, the cost of iron ore continues to stay above $100 per ton.


    And yet the main driving force behind the growth of AUD/USD is a weak greenback. After the unjustified euphoria, which was associated with the outcome of the G20 summit, a regular "hangover" gradually ensues, aggravated by loud statements by top White House officials. The essence of their comments comes down to the fact that, firstly, relief from Washington is more of a formal nature - for example, Chinese technology giant Huawei remains on the United States' blacklist, despite certain concessions processors).

    Secondly, the very fact of the truce is under a big question mark - after all, a non-aggression pact was concluded rather than an armistice agreement in Osaka. Today, the White House announced a meeting between US Trade Representative Robert Lighthizer and Chinese Deputy Prime Minister Liu He, which will clear the future prospects for the negotiation process. Washington did not say exactly when this meeting will take place, but noted that it will occur "in the near future."

    In general, the initial optimism of traders was replaced by concern and uncertainty that another attempt to find a compromise will be crowned with success. Similar doubts from investors have background pressure on the US dollar. To one degree or another, this also affects the US currency's postions in dollar pairs. Weak macroeconomic reports in the US only exacerbate the position of the greenback. The slowdown is demonstrated by both key and secondary economic indicators.

    Take, for example, the latest releases: an indicator of consumer confidence in the US, an indicator of growth in orders for durable goods, a report on the labor market from ADP, regional indicators of production activity — all of these indicators came out in the red zone, not reaching weak forecast levels. Almost every day, US statistics disappoint investors to some extent, and today is no exception. Thus, activity in the service sector slowed to 55.1 points - this is the weakest result since July 2017. The extremely low influx of new orders (this component of the indicator updated a 2.5-year low) caused a decline in employment in this area, having a mediated effect on the overall slowdown in the US labor market.


    Experts have previously warned that the service sector will begin to slow down after the manufacturing sector, and now, apparently, these predictions are beginning to materialize. By the way, the indicator of production orders published today came out at the lowest values since the summer of 2016. The indicator is actively decreasing for the second consecutive month, and the May indicator was revised downward (-1.2% instead of the previous -0.8%). This fundamental picture does not allow the dollar to develop to feel comfortable, even with continued demand. And together with the Australian dollar, the greenback is losing its position at the expense of the aussie's "independent" growth.

    The Australian dollar won back a decline in the interest rate by 0.25% and after the announcement of the expected decision, it began to recover throughout the market. Although Philip Lowe did not rule out further easing of monetary policy, the market focused on current events, pulling up the aussie. First, the strategically important raw material for Australia - iron ore - continues to grow. To date, the cost of a ton of this raw material is already $124 (for comparison, in April this figure was in the level of $80). Secondly, due to the growth in the value of exports of iron ore, Australia recorded a growth in the trade surplus by 16.2% to $4 billion in May compared with April. Judging by the price dynamics of iron ore, the June figures will exceed the May results. High demand for this type of raw materials from Chinese steel mills only confirms this assumption.


    Thus, despite the RBA's dovish position, AUD/USD buyers use the market's current situation to their advantage. Uncertain positions of the US currency against the background of a substantial growth in the commodity market makes it possible for the aussie to open new price horizons. The first resistance level is the mark 0.7060 - this is the upper line of the Bollinger Bands indicator on the daily chart. When it is overcome, the Ichimoku trend indicator will form a bullish "Parade of lines" signal, which will open the way for AUD/USD bulls to the next resistance level of 0.7180 (the top line of the Bollinger Bands indicator is already on the weekly chart). Support is the aussie's key for a 0.7000 mark.

    Analysis are provided byInstaForex.
    Best regards, PR Manager
    Learn more about InstaForex Company at http://instaforex.com

  5. #455
    Senior Member InstaForex Gertrude's Avatar
    Join Date
    Sep 2015
    Posts
    1,885
    EUR/USD. Calm before the storm: the market hid in anticipation of the Nonfarm report

    Today, the windless weather on the foreign exchange market: the European session was not rich in macroeconomic reports, and the US trading platforms are completely closed: Independence Day is celebrated in the United States. The nearly empty economic calendar allows you to take a wait-and-see position, especially on the eve of Friday's releases, which will certainly provoke strong volatility. It is noteworthy that on the eve of a "stormy Friday" the market ignored a rather alarming signal, which was voiced by US President Donald Trump. He again accused China and Europe of using currency manipulations, also complaining that Washington only obediently observes this process. The Chinese Foreign Ministry has already responded to this statement by Trump, publishing a concise refutation of the voiced accusations. Brussels ignored the words of the American president, although the reaction of Europe would hardly be different from the Chinese.


    On the one hand, the situation has exhausted itself - Donald Trump often voices his thoughts or complaints with the help of Twitter. On the other hand, the concern of the US president about this issue is alarming for some currency strategists (in particular, Bank of America), given Trump's ability to take unconventional steps in his policy. Therefore, after the head of the White House once again accused Europe and China of manipulating currency, experts began saying that the president could initiate the use of currency intervention in the coming months. Analysts estimate the likelihood of this scenario in different ways. But almost all of the economists surveyed by Bloomberg do not exclude such a scenario. Especially - if the Fed in July does not reduce the interest rate, and the ECB, in turn, will prepare the ground for the introduction of additional incentives in the autumn.

    As some currency strategists believe, the White House needs a substantial dollar drawdown across the entire market - by 10-20%. In the context of the euro-dollar pair, this means that the price should rise to levels five years ago, to the area of 1.31-1.37, up to level 40. Naturally, this will cause a domino effect - eurozone inflation is not the only thing that will suffer, but the entire EU economy as a whole, after which the ECB will resort to appropriate mitigation measures. But, as they say, "in war - as war": by launching a flywheel of currency manipulations, the White House will understand perfectly well that central banks of other countries will take a defensive position, devaluing their currencies.

    As you know, there are several types of interventions, among them sterilized and unsterilized. In the first version of the intervention, the New York Fed will acquire or sell securities on the open market, but will not interfere with monetary policy. Unsterilized intervention directly affects the money supply and rates. And if during sterilized currency intervention the value of the monetary base is maintained, in the second case, the intervention leads to a change in the monetary base. What kind of tool the White House will apply is an open question, and it has become increasingly discussed in the foreign exchange market. According to many analysts, Trump's rhetoric in this regard will only become tougher in the near future.

    But the traders actually ignored the important, in my opinion, signal from the US president. The market is focused on the upcoming events, namely the Nonfarm, which will be published tomorrow. According to preliminary forecasts, the growth rate of people employed in the non-agricultural sector will grow to "acceptable" values, that is, to 164 thousand. This is much less than the levels at which the indicator went out during the past year and the first quarter of the current year: the indicator practically did not fall below the 200 thousandth mark, and often exceeded the 300 thousandth level. But compared to May, when the number of employed has grown by only 74 thousand, this result will look quite good - but only if the real figures coincide with the predicted ones.

    Let me remind you that, according to the latest ADP report, the number of people employed in June increased by only 102 thousand. This report is the main guideline on the eve of the publication of official data. Given the relatively weak result from ADP, the June Nonfarm may also disappoint traders. In this case, the dollar is unlikely to be able to hold its position and weaken throughout the market. You should also pay attention to the indicator of the average hourly wage, which is an inflationary indicator. On a monthly basis, over the past three months, it has been at the same level - 0.2%. And on an annualized basis, the index in May is minimal, but unexpectedly dropped from 3.2% to 3.1%. In June, wages should demonstrate a positive trend - both in monthly and annual terms. If this forecast is not justified, the US currency will fall under additional pressure.


    In general, tomorrow's release either eliminates concerns about the aggressive easing of the monetary policy of the Fed, or, conversely, returns concern about this. In the second case, the EUR/USD pair will get another chance to gain a foothold in the 13th figure, breaking the resistance levels of 1.1305 (the Bollinger Bands average line on the daily chart) and 1.1340 (the Tenkan-sen line on the same timeframe). Otherwise, the bears will finally seize the initiative on the pair, up to the achievement in the medium term, up to the lower limit of the Kumo cloud on D1, that is, to the level of 1.1185.

    Analysis are provided byInstaForex.
    Best regards, PR Manager
    Learn more about InstaForex Company at http://instaforex.com

  6. #456
    Senior Member InstaForex Gertrude's Avatar
    Join Date
    Sep 2015
    Posts
    1,885
    EUR/USD. 5th of July. Results of the day. NonFarm Payrolls - the killer of European currencies

    4-hour timeframe


    The amplitude of the last 5 days (high-low): 42p - 90p - 47p - 44p - 22p.

    Average amplitude for the last 5 days: 49p (51p).

    The last trading day of the current week has passed with the US currency having full advantage. There was only one reason for this - the publication of the NonFarm Payrolls report for June. Analysts' forecasts predicted 162,000 new jobs outside the agricultural sector, but in reality there were 224,000. Such a strong excess of the real value over the forecast naturally provoked strong purchases of the US dollar and so the US currency rose by 60 points against the euro. Against the background of strong NonFarms, traders ignored unemployment in the United States, which rose to 3.7%, as well as weaker wage growth than originally estimated. However, the key question for the entire currency market now is: do strong NonFarm mean the end of a period of failed macroeconomic statistics in the US or is it just an accident? As we all see, the US dollar has almost completely offset all losses against the European currency, which suffered during the month when reports from the United States could not please even the most ardent optimists. Only 120 points are left to reach the year lows and such a resurrection of the US dollar occurred, by and large, without particularly strong support from the foundation. Now a new question arises: if the macroeconomic statistics ceases to disappoint, the Fed may not soften the monetary policy in 2019, respectively, the main advantage of the euro, which bulls of the euro/dollar pair could plummet into oblivion. What should the euro count on in this case? There is no answer to this question yet, but we state the fact: the US dollar is very close to "returning to the game" and in the near future it will be possible to state the resumption of a downward trend.

    Trading recommendations:

    The EUR/USD pair resumed its downward movement. Thus, it is now again recommended to sell the euro with the target of 1.1177. At the beginning of the new trading week, new levels of support and resistance will be formed.

    It is recommended that you buy the euro/dollar pair not earlier than when prices have consolidated above the Kijun-sen line. However, this will require a strong fundamental basis for the bulls.

    In addition to the technical picture should also take into account the fundamental data and the time of their release.

    Explanation of the illustration:
    Ichimoku indicator: Tenkan-sen - the red line.
    Kijun-sen - the blue line.
    Senkou Span A - light brown dotted line.
    Senkou Span B - light purple dotted line.
    Chikou Span - green line.
    Bollinger Bands indicator:
    3 yellow lines. MACD Indicator:
    Red line and histogram with white bars in the indicator window.

    Analysis are provided byInstaForex.
    Best regards, PR Manager
    Learn more about InstaForex Company at http://instaforex.com

  7. #457
    Senior Member InstaForex Gertrude's Avatar
    Join Date
    Sep 2015
    Posts
    1,885
    Technical analysis of GBP/USD for 09/07/2019:


    Technical Market Overview:
    The GBP/USD pair has broken through the technical support at the levels of 1.2559, 1.2529 and 1.2505 on its way down to the new swing low made at the level of 1.2476. As we can see the price is now out of the descending channel, which is a very bearish sign. There is a Pin Bar made at the new swing low at the level of 1.2476, but so far there is not much bullish pressure on the market and the bears are still in full control of the market. The nearest technical resistance is located at the level of 1.2559 and it might be tested soon due to the oversold market conditions.

    Weekly Pivot Points:
    WR3 - 1.2853
    WR2 - 1.2772
    WR1 - 1.2630
    Weekly Pivot - 1.2551
    WS1 - 1.2402
    WS2 - 1.2319
    WS3 - 1.2180

    Trading Recommendations:
    The best strategy for the current market conditions is to follow the larger timeframe trend. The larger time frame trend is still down and there are no signs of any trend reversal. The key long-term technical support is seen at the level of 1.2431 and the key long-term technical resistance is seen at the level of 1.2775 and only if this level is violated, there is a chance for the trend reversal.

    Analysis are provided byInstaForex.
    Best regards, PR Manager
    Learn more about InstaForex Company at http://instaforex.com

  8. #458
    Senior Member InstaForex Gertrude's Avatar
    Join Date
    Sep 2015
    Posts
    1,885
    Forecast for USD/JPY on July 10, 2019

    USD/JPY
    Yesterday and today, the price is testing the strength of the resistance of the embedded line of the price channel at around 109.00. As we expected, the reversal of the signal line of the Marlin oscillator from the border with the territory of the decline on the daily chart took place. Now, the pair USD/JPY needs to overcome this resistance to pass only 25 points to the next resistance on the daily chart – the MACD line, which is an indicator of the current trend.


    As seen on the four-hour chart, the growth of the Marlin oscillator slowed down, the price may roll back from the current level. But the general upward trend remains stable – the price is above the balance line (red indicator) and the MACD line. The level of 108.20 in this case is not the goal of a possible correction, it marks the "last line of defense" of the bulls. With the departure of the price below this line, a deeper drop is possible.


    Analysis are provided byInstaForex.
    Best regards, PR Manager
    Learn more about InstaForex Company at http://instaforex.com

  9. #459
    Senior Member InstaForex Gertrude's Avatar
    Join Date
    Sep 2015
    Posts
    1,885
    EUR/USD. 1-0 in favor of the euro

    The US dollar did not rest long on its laurels: after Friday's take-off on strong Nonfarm, today it began to swoop down just as rapidly throughout the entire market. Contrary to the hopes of dollar bulls, the Federal Reserve chief did not revise his position on the prospects for monetary policy and in fact confirmed the previously announced intention to lower the interest rate at the July meeting. The tone of his rhetoric was quite categorical and key messages were not ambiguous. Powell made it clear that the Fed is ready to ease monetary policy, and will proceed to this step in the very near future.

    The key message of the Fed head is that the US economy is in a strong form, but assistance from the regulator is needed in order to maintain it - in the form of lower interest rates. Throughout his speech, he cited facts arguing this idea. In general, despite the fact that Powell has positively assessed the state of the US economy, he expressed serious concern about its prospects.


    The head of the US Federal Reserve noted that after the June Fed meeting (at which, in fact, the dovish intentions of the regulator were announced), the overall uncertainty only increased. Powell actually offset the optimism of traders associated with the outcome of the US-China talks in Osaka. He said that a truce is certainly a positive signal, but in general the situation has not changed. Global trade conflicts, according to Powell, have slowed the economic momentum in many countries, and this fact has a negative effect on the US economy. A temporary truce, unfortunately, does not solve these problems. Denoting problems of a global nature, Powell also mentioned Brexit (which is likely to follow the "hard" scenario), as well as the issue of federal debt.

    As for internal problems, the key "headache" of the Fed is inflation. According to Jerome Powell, inflation continues to be weak, and this weakness may be more stable and systemic. It is worth recalling that during the first half of the year, the Fed chief assured investors that the slowdown in key inflation indicators is a temporary phenomenon, and that the situation will change for the better in the second half of the year. Now Powell is by no means certain of that.

    According to him, the latest indicators of wage growth are "very weak" for accelerating inflation (the June figures were in the red zone, not reaching the forecast values). Early inflation indicators suggest that inflationary pressure will remain muted this year. The latest published releases were really not in favor of the dollar. For example, the indicator of consumer confidence in Americans slumped to two-year lows, and the volume of orders for durable goods disappointed traders with negative dynamics. The indicator remained in the negative area (-1.3%), thus continuing the April trend. It is also worth noting the fall in business investment, the slowdown in global growth and the decline in investment in housing and manufacturing. I'm not even talking about the release of the consumer price index (general and pivotal), which also showed weak growth.

    In other words, Powell's dovish position looks quite justified. It even "got" to the US labor market, which showed growth last Friday. Powell stated a fact, but noted that for many residents of the United States, this growth was "uneven". He voiced the structure of Nonfarms, according to which Asians and whites found work more often, unlike African Americans and Latin Americans. Powell also assured Congress that the labor market is not "overheated", and therefore there is no need to restrain with high rates.


    Thus, Jerome Powell made it clear that the Fed will cut interest rates by 25 basis points at the end of this month. But the next steps of the regulator will depend on the incoming data, above all - inflation. The head of the Fed has mentioned that the real numbers may show a lower result relative to the preliminary forecasts of the regulator. In this case, he assured members of Congress that the Fed "will use all its means to keep economic growth and key indicators in the right path." In other words, inflation indicators will particularly strongly influence the dollar position - and in this context, tomorrow's release can cause increased volatility for the EUR/USD pair.

    We are talking about the publication of data on the growth of US inflation. The overall consumer price index should show a negative trend, dropping to 1.6% in annual terms and down to zero - on a monthly basis. Core inflation, excluding prices for food and energy, can demonstrate minimal growth in monthly terms (from 0.1% to 0.2%) and remain at the same level (2.0%) in annual terms. If the real numbers are below fairly weak forecast values, the dollar may again fall under the wave of sales.

    Tomorrow, Powell will continue his speech in the US Congress - this time in the Banking, Housing and Urban Affairs Committee. Today's round of "correspondence" has ended in favor of the euro. On Thursday, EUR/USD bulls can consolidate their results and enter the area of the 13th figure, hinting at the restoration of the upward trend.

    Analysis are provided byInstaForex.
    Best regards, PR Manager
    Learn more about InstaForex Company at http://instaforex.com

  10. #460
    Senior Member InstaForex Gertrude's Avatar
    Join Date
    Sep 2015
    Posts
    1,885
    EUR/USD: US inflation drowned out the upward impulse

    Data on the growth of US inflation was very controversial. The general consumer price index showed mixed dynamics: on a monthly basis, it remained at the level of May (that is, at the level of 0.1%) with the forecast of decline to zero. In annual terms, the index came out in accordance with the forecast, being at the level of 1.6% (previous value - 1.8%). But core inflation has pleased investors with minimal growth. On a monthly and annual basis, CPI turned out to be better than forecast, coming out in the "green zone" (0.3 m/m and 2.1% y/y)


    After the release of this report, the market hesitated for a while - on the one hand, the inflation rate was pleasantly surprising (especially the base one), on the other hand, the growth of the main indicators was minimal. But an hour later, the market decided that "the glass was half full" than vice versa, and so the US currency gradually began to restore its position. The dollar index moved away from lows of the day (and week), rising from 96.417 to the current value of 96.620. Although the growth of the greenback is not of a large scale, this situation indicates that the upward impulse of the EUR/USD pair is too unsteady and uncertain, and the dollar, in turn, retains the potential for further growth. After Powell's pessimistic comments and the release of the dovish Fed minutes, such dynamics from the greenback looks abnormal. But if we consider this situation in terms of market expectations, many things fall into place.

    By and large, the Fed follows the expectations of the market, and to be more precise, it prepared the traders fairly smoothly and well in advance for their further steps. Representatives of the dovish wing of the Fed (James Bullard, Rafael Bostic, Lael Brainard) first spoke about the need to mitigate monetary policy. Then the likelihood of such a scenario did not exclude Jerome Powell, however, as a necessary (extreme) measure. Over the coming weeks, the Fed chief strengthened the dovish tone, allowing for a rate cut this year. In the end, at its June meeting, the Fed excluded from the text of the accompanying statement the phrase "showing patience" regarding the prospects for monetary policy, thus opening the door to the first rate cut. Thus, the probability of monetary policy easing gradually grew and reached almost 100% at the end of last month. Moreover, the market began to exaggerate information that the Fed would reduce the rate immediately by 50 basis points or start a rate reduction cycle (one decrease in July, one more in the fall). Against the background of such conversations, the dollar has noticeably weakened - in particular, the EUR/USD pair even tested the 14th figure for the first time since March of this year.

    But strong Nonfarm weakened the fears of traders about an aggressive rate cut. At the same time, the likelihood of a July decline was still preserved. That is why the dollar relatively calmly survived Jerome Powell's unambiguously dovish report to Congress. Despite the clear hints of the Fed, the dollar just moved away from annual lows against the euro, but buyers could not even enter the area of the 13th figure. The thing is that the market was ready for the July rate cut - the only question was how aggressive the Fed's actions would be after this "preventive" step. In turn, today's data on inflation has suggested that the Fed will take a wait-and-see position following the decline in July.

    In other words, the Fed has been preparing the markets for monetary policy easing for quite a long time. Therefore, the Fed chief's semi-annual report did not provoke a large-scale weakening of the dollar. If we talk about the EUR/USD pair, in this case, Powell only interrupted the downward trend and allowed the pair's bulls to go for a correction, the "ceiling" of which is 1,1300. This ceiling is not only due to the growth of core inflation in the United States.


    The single currency is also under pressure from the fundamental background, primarily from the ECB. So, the minutes of the last meeting of the European regulator was released today, which demonstrated the dovish intentions of the ECB. In the opinion of the members of the Governing Council, the regulator needs to prepare for easing monetary policy in view of the reduction in inflation expectations. Almost all representatives of the ECB agreed that the central bank needed to change its position, demonstrating readiness for "retaliation". Arsenal of possible measures includes both the resumption of QE and lower interest rates. It is not known what algorithm of actions the regulator will choose for itself, but at the same time it is obvious that the ECB will take the path of easing monetary policy - just like the Fed.

    This fact limits the potential correctional growth of the EUR/USD pair. The first resistance level is the mark of 1,1285 (the middle line of the Bollinger Bands indicator on the daily chart, which coincides with the Tenkan-sen line). Today, the pair has reached this level, but was unable to break through it, and after the publication of the US CPI, it retreated to the level of today's opening. Just above - at around 1.1300 - is the next resistance level, which corresponds to the Kijun-sen line. But if the demand for the dollar will increase (especially if tomorrow's producer price index will be released in the "green zone"), then the pair will most likely return to the base of the 12th figure, namely, to the support of 1.1205, which corresponds to the lower Kumo cloud on D1.

    Analysis are provided byInstaForex.
    Best regards, PR Manager
    Learn more about InstaForex Company at http://instaforex.com

Page 46 of 164 FirstFirst ... 36 44 45 46 47 48 56 96 146 ... LastLast

Tags for this Thread

Bookmarks

Posting Permissions

  • You may not post new threads
  • You may not post replies
  • You may not post attachments
  • You may not edit your posts
  •