Page 124 of 164 FirstFirst ... 24 74 114 122 123 124 125 126 134 ... LastLast
Results 1,231 to 1,240 of 1634

Wave Analysis by InstaForex

This is a discussion on Wave Analysis by InstaForex within the Analytics and News forums, part of the Trading Forum category; Forex Analysis & Reviews: Forecast for EUR/USD on August 1, 2022 By this morning, the euro's situation is such that ...


  1. #1231
    Senior Member InstaForex Gertrude's Avatar
    Join Date
    Sep 2015
    Posts
    1,885
    Forex Analysis & Reviews: Forecast for EUR/USD on August 1, 2022

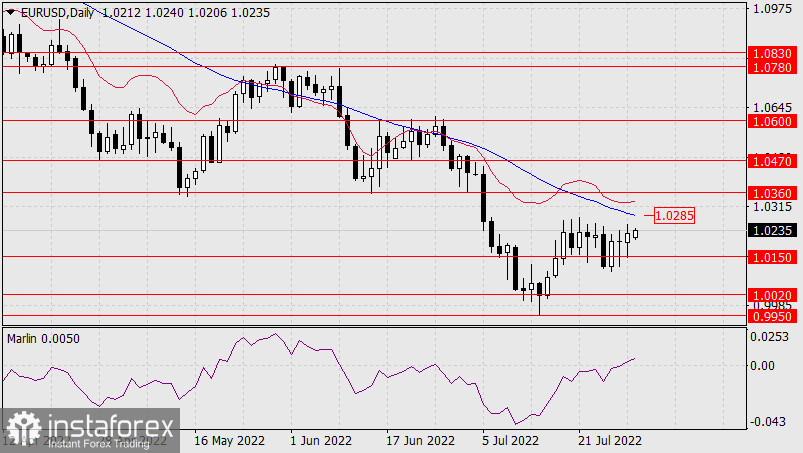
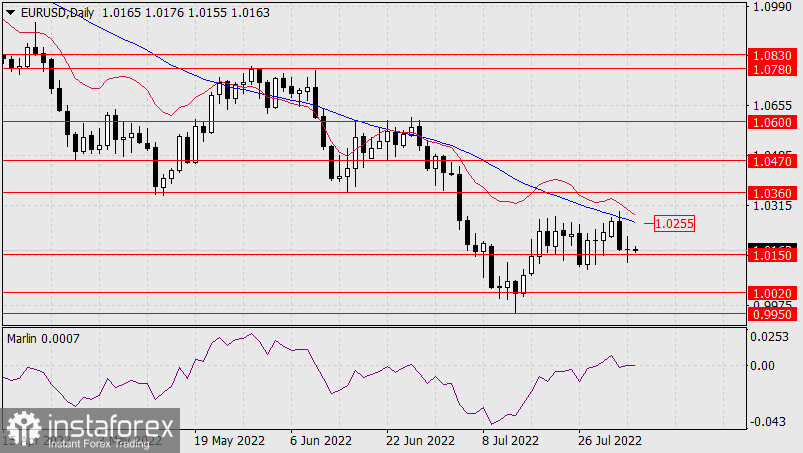
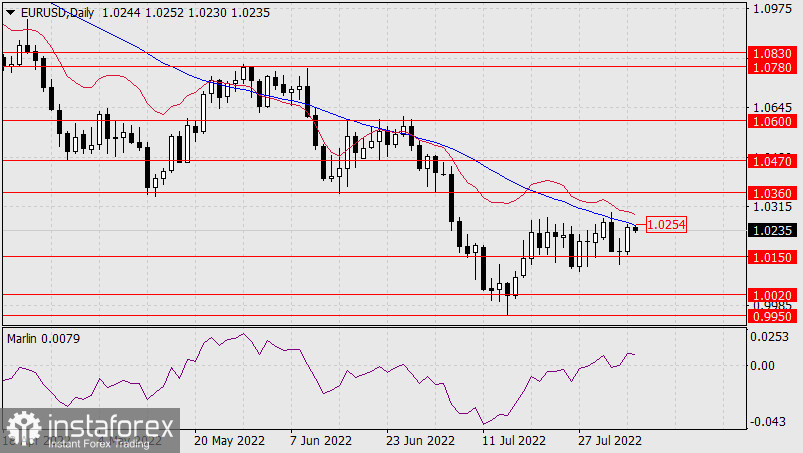
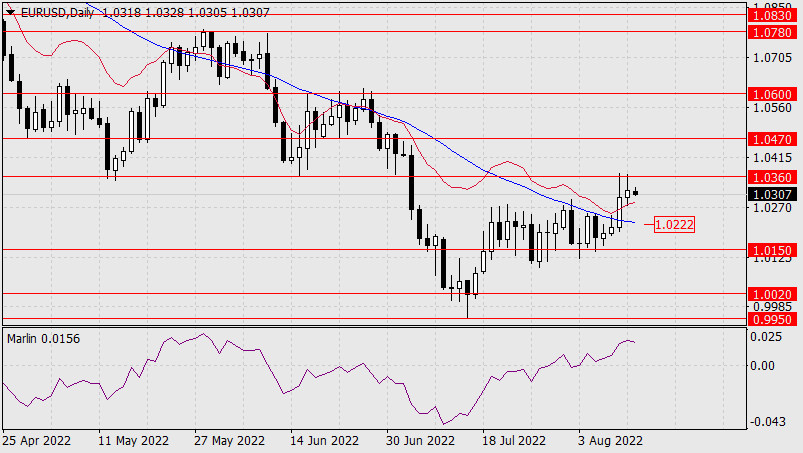
    By this morning, the euro's situation is such that over the past four days the price has not overcome the support level of 1.0150, the downward potential was lost, and now the price is growing towards the nearest target of 1.0285 supported by the Marlin Oscillator growing in the positive area on the daily scale chart.


    Breaking the MACD line (1.0285) will open the target level of 1.0360 (the June 15 low). From this level, the probability of a price reversal down, into a medium-term decline, will increase by a lot.

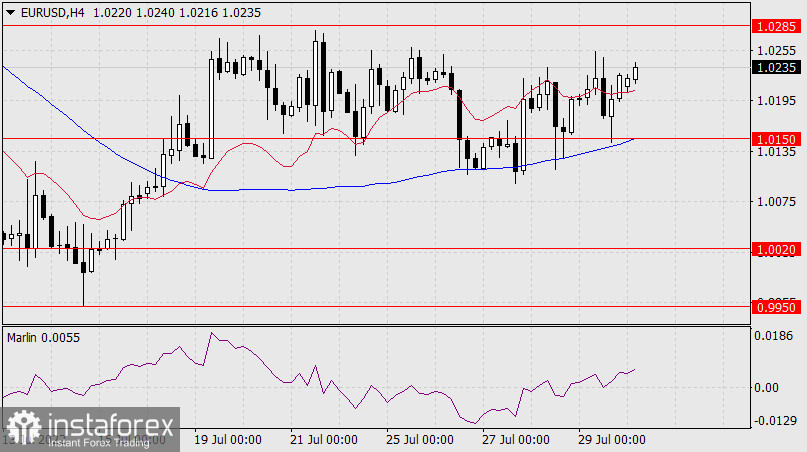
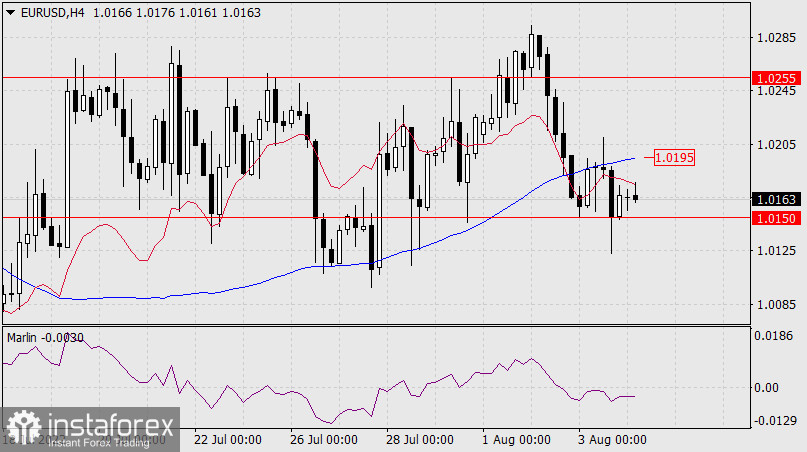
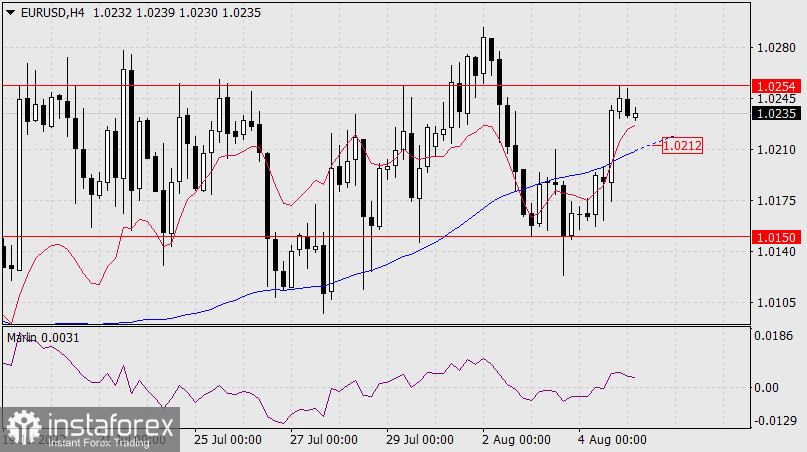
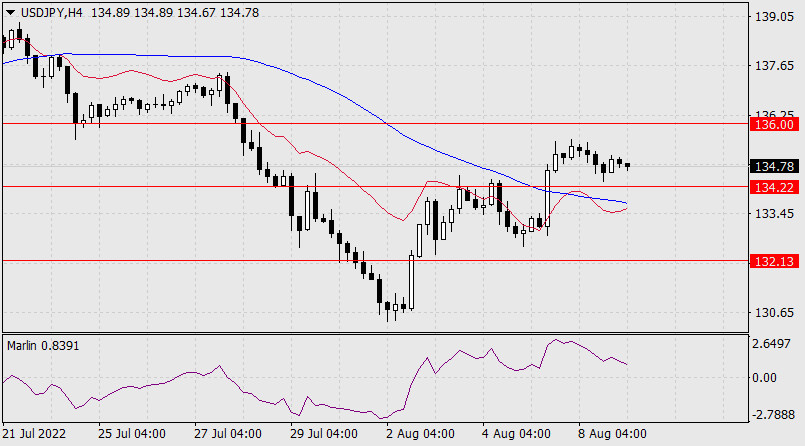
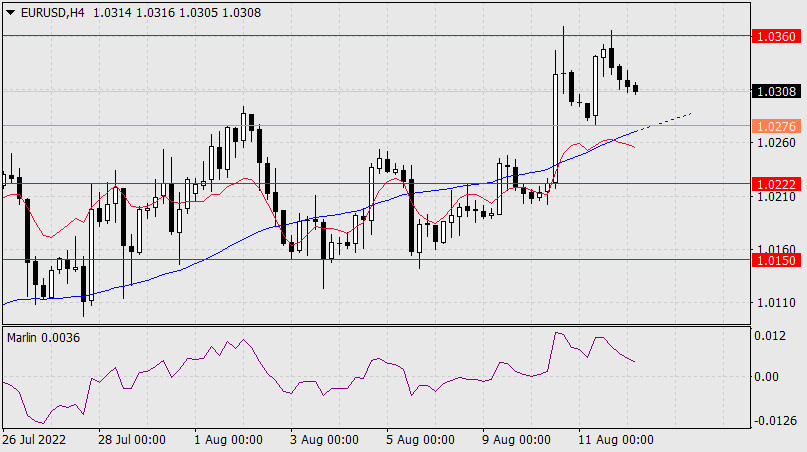
    On the H4 chart, it is noticeable that a four-fold upward price reversal occurred from the MACD indicator line. At the moment, the price is rising above the balance line, the Marlin Oscillator is growing in the upper half - in the territory of an upward trend.

    The final estimates of the eurozone Manufacturing PMI for July will be published today, the forecast for it is unchanged at 49.6, as well as for the US ISM Manufacturing PMI, for which the forecast is already down: 52.0-52.3 against 53.0 a month earlier. We are waiting for the continuation of the euro's corrective growth.


    Analysis are provided by InstaForex.

    Read More
    Best regards, PR Manager
    Learn more about InstaForex Company at http://instaforex.com

  2. #1232
    Senior Member InstaForex Gertrude's Avatar
    Join Date
    Sep 2015
    Posts
    1,885
    Forex Analysis & Reviews: Forecast for GBP/USD on August 2, 2022

    On the second attempt, that is, yesterday, the pound went above the target level of 1.2230 and above the balance indicator line. It continues to rise this morning, there is a difficult path just ahead to the target of 1.2435, and this target level may not be reached, as there is a technically strong 1.2405 ahead of it - the high of June 16 and earlier historical extremes. The Marlin Oscillator is growing, the growth potential has not been exhausted.


    The price has consolidated above the target level of 1.2230 on the four-hour chart, but the Marlin Oscillator does not share the price's optimism, intending to return to the downward trend zone.

    This is already a manifestation of signs of a technically difficult upward movement. If the price settles below 1.2230, Marlin will return to the negative area, this will be the first sign of the completion of the corrective growth.


    *The market analysis posted here is meant to increase your awareness, but not to give instructions to make a trade.

    Analysis are provided by InstaForex.

    Read More
    Best regards, PR Manager
    Learn more about InstaForex Company at http://instaforex.com

  3. #1233
    Senior Member InstaForex Gertrude's Avatar
    Join Date
    Sep 2015
    Posts
    1,885
    Forex Analysis & Reviews: Trading Signal for USD/JPY for August 3 - 4, 2022: buy in case of rebound at 132.63 (5/8 Murray - 21 SMA)


    USD/JPY has risen more than 350 pips in the last 48 hours, recovering strongly from the lowest level in almost two months. The pair bottomed at 130.39 at around 4/8 Murray and is now trading with an upward bias above the 21 SMA and above 5/8 Murray.

    Since July 14, the Japanese yen strengthened, having fallen almost 900 pips from the high of 139.39 to the low of 130.39. The Japanese yen is currently showing signs of being oversold and any pullback is likely to be seen as a buying opportunity. The psychological level of 130.00 has become major support for USD/JPY. It is likely that as long as it trades above this level, it could resume its bullish cycle and could reach 135.00 (200 EMA) and even reach the psychological level of 140.00.

    Risk appetite added pressure to USD/JPY, setting the stage for the yen's recovery that took more than 2 weeks. The strong technical bounce from earlier this week could signal the end of the downtrend. However, July payroll data will be released on Friday and could change the short-term outlook for the Japanese yen.

    A return above the 200 EMA located and 135.08 will mean a resumption of the uptrend and USD/JPY could reach 137.50 (8/8 Murray) again and even reach the 24-year high at 139.38. On the other hand, any technical bounce above the 21 SMA located at 132.63 will still be a clear signal to buy. The pair could continue its rise to 135.00 and 137.50.

    On August 1, the eagle indicator reached the extremely oversold zone of around 5 points which was a clear signal to buy. After reaching a high of 133.89 in the Asian session, it is showing signs of a technical correction. Hence, we can expect the price to rebound off 132.63 to buy again.

    Our trading plan for the next few hours is to wait for a technical bounce at around 132.63 and buy the pair with targets at 6/8 Murray around 134.65 and at the 200 EMA around 135.12. *The market analysis posted here is meant to increase your awareness, but not to give instructions to make a trade.

    Analysis are provided by InstaForex.

    Read More
    Best regards, PR Manager
    Learn more about InstaForex Company at http://instaforex.com

  4. #1234
    Senior Member InstaForex Gertrude's Avatar
    Join Date
    Sep 2015
    Posts
    1,885
    Forex Analysis & Reviews: Forecast for EUR/USD on August 4, 2022)

    The euro traded with a range of 45 points on Wednesday, closing the day at the opening level, above the support of 1.0150. The signal line of the Marlin Oscillator also failed to cross the zero line into the bears' territory. Thus, the price level of 1.0150 appears to be quite strong, the price may develop an acceleration when it is overcome. Downward targets: 1.0020, 0.9950.


    The price settled under both indicator lines on the H4 chart. Yesterday the price went through the shadows of the support at 1.0150 and the resistance of the MACD line. Marlin has a downward direction, we are waiting for the price to settle under 1.0150 and its further fall. This plan will be disrupted after the price settles above the MACD line (1.0195). In this case, the growth will continue to the daily MACD line - 1.0255.


    Analysis are provided by InstaForex.

    Read More
    Best regards, PR Manager
    Learn more about InstaForex Company at http://instaforex.com

  5. #1235
    Senior Member InstaForex Gertrude's Avatar
    Join Date
    Sep 2015
    Posts
    1,885
    Forex Analysis & Reviews: Forecast for EUR/USD on August 5, 2022

    After an unsuccessful attempt to overcome technical support at 1.0150 on Wednesday, and the price jumped 77 points on Thursday in order to turn around from the MACD line, having received an impulse push from resistance, to make a subsequent attempt to a solid level of 1.0150. The Marlin Oscillator also did not have enough strength to overcome the zero line on the first attempt, after which it slightly rose and is now turning to a new attack.


    After the price settles below 1.0150, the movement will continue to the target level of 1.0020. An alternative scenario will open after the price settles above 1.0254, that is, above the daily MACD line. The nearest upside target will be the level of 1.0360 (15 June low), from which we still expect a reversal to the medium-term downside.

    The price is formally in an upward position on the four-hour chart, as there is an increase above both indicator lines and Marlin in the upward trend territory, but based on the logic of the daily timeframe, we are waiting for the price to drop below the MACD line, below 1.0212, which will start the development of an attack on technical support for the daily timeframe. At the time of the price transition below 1.0212, the Marlin Oscillator will move into the downward trend zone. Consolidating above 1.0254 will prolong the euro's corrective growth


    *The market analysis posted here is meant to increase your awareness, but not to give instructions to make a trade.

    Analysis are provided by InstaForex.

    Read More
    Best regards, PR Manager
    Learn more about InstaForex Company at http://instaforex.com

  6. #1236
    Senior Member InstaForex Gertrude's Avatar
    Join Date
    Sep 2015
    Posts
    1,885
    Forex Analysis & Reviews: Forecast for GBP/USD on August 8, 2022

    The pound was falling by 151 points on Friday, having touched the support of the MACD trend line (1.2003) with the lower shadow of the daily candle. The price's departure under the trend indicator line will mean a resumption of a decline in the medium term. The first target on this path is the level of 1.1800.


    The Marlin Oscillator remains in positive territory for now. Apparently, this circumstance did not allow the price to overcome the support on Friday. Now there is such a situation that the price overcoming the MACD line (1.2003) and the transition of the oscillator to a negative position can coincide in time. Such synchronicity can give a strong momentum to the price in moving down. If the price goes back above 1.2100, then the decline will be delayed for a day or two. Overcoming 1.2230 will open the 1.2435 target.


    The price has consolidated under the balance and MACD indicator lines on the four-hour chart, the Marlin Oscillator is developing in negative territory. We are waiting for the price to move down according to the predominant downward scenario.

    *The market analysis posted here is meant to increase your awareness, but not to give instructions to make a trade.

    Analysis are provided by InstaForex.

    Read More
    Best regards, PR Manager
    Learn more about InstaForex Company at http://instaforex.com

  7. #1237
    Senior Member InstaForex Gertrude's Avatar
    Join Date
    Sep 2015
    Posts
    1,885
    Forex Analysis & Reviews: Forecast for USD/JPY on August 9, 2022

    The USD/JPY pair formed a candle with a small body (-6 points) and sweeping shadows on Monday, which creates a sign of a reversal of the growing trend, that is, a sign of the end of the corrective growth from August 2. The reversal will be confirmed by the price dropping below the nearest support of the embedded price channel line at 134.22. The target will open on the underlying embedded line at 132.13.


    The Marlin Oscillator is turning down, being in the downward trend zone. An alternative scenario assumes the price's succeeding growth with the 136.00 target. But a sign of such an alternative will be when the price overcomes yesterday's high at 135.57, which is close enough to the target itself, so in the current situation, the best strategy will be to wait for a sell signal, whether it will happen today or in a few days.

    The price is approaching the support at 134.22 supported by the rapidly declining Marlin Oscillator on the 4-hour chart. The advance of the oscillator in the current situation means that it tends to move into the negative area before the price approaches the MACD line, since the price will already need technical assistance to overcome this support by that time. Ultimately, we are waiting for the price at the nearest target level of 132.13.


    *The market analysis posted here is meant to increase your awareness, but not to give instructions to make a trade.

    Analysis are provided by InstaForex.

    Read More
    Best regards, PR Manager
    Learn more about InstaForex Company at http://instaforex.com

  8. #1238
    Senior Member InstaForex Gertrude's Avatar
    Join Date
    Sep 2015
    Posts
    1,885
    Forex Analysis & Reviews: USDCAD Potential for Bullish Rise | 10th August 2022


    On the H4, with the price going above ichimoku cloud, and DIF is breaking the signal line in MACD, we have a bullish bias that the price may rise from our 1st resistance at 1.29011, which is in line with previous swing high to our 2nd resistance at 1.29831, which is in line with the 78.6% fibonacci projection and 50% fibonacci retracement. Alternatively, the price may drop to the 1st support at 1.28483, which is in line with 61.8% fibonacci retracement and pullback support.

    Trading Recommendation
    Entry:1.29011
    Reason for Entry:Swing high
    Take Profit: 1.29831
    Reason for Take Profit: 78.6% fibonacci projection and 50% fibonacci retracement
    Stop Loss: 1.28483
    Reason for Stop Loss:
    61.8% fibonacci retracement and pullback support

    *The market analysis posted here is meant to increase your awareness, but not to give instructions to make a trade.

    Analysis are provided by InstaForex.

    Read More
    Best regards, PR Manager
    Learn more about InstaForex Company at http://instaforex.com

  9. #1239
    Senior Member InstaForex Gertrude's Avatar
    Join Date
    Sep 2015
    Posts
    1,885
    Forex Analysis & Reviews: USDCHF Potential for Bearish Drop | 11st August 2022


    On the H4, with prices moving below the ichimoku cloud and the MACD indicators are below zero, we have a bearish bias that the price may drop from the 1st support at 0.94002, where the swing low support is to the 2nd support at 0.93272, which is in line with 78.6% fibonacci projection. Alternatively, since the price is rising currently and from H1, the DIF is crossing over the signal line, the price may rise to the 1st resistance at 0.95233, where the swing low support and 50% fibonacci retracement are.

    Trading Recommendation Entry:0.94002
    Reason for Entry: Swing low support
    Take Profit: 0.93272
    Reason for Take Profit: 78.6% fibonacci projection
    Stop Loss: 0.95233
    Reason for Stop Loss:
    Swing low support and 50% fibonacci retracement

    *The market analysis posted here is meant to increase your awareness, but not to give instructions to make a trade.

    Analysis are provided by InstaForex.

    Read More
    Best regards, PR Manager
    Learn more about InstaForex Company at http://instaforex.com

  10. #1240
    Senior Member InstaForex Gertrude's Avatar
    Join Date
    Sep 2015
    Posts
    1,885
    Forex Analysis & Reviews: Forecast for EUR/USD on August 12, 2022

    Yesterday, the euro once again tried to attack the resistance level of 1.0360 (June 15 low), the attempt was unsuccessful, the pullback intensified. The Marlin Oscillator is already turning down in the positive area, and the price needs to overcome the support of the MACD indicator line (1.0222) and then the euro will begin to fall in the medium term. The first target is 1.0150.


    Federal Reserve FOMC members Neil Kashkari and Mary Daly (until recently a dove) announced the US central bank's firm intention to raise rates by 0.75% in September. The yield on 5-year US government bonds rose from 2.92% to 2.99%, breaking Monday's high.

    The Marlin Oscillator is leading the price down on the four-hour chart. The price itself tends to overcome the support of the MACD line (1.0276), which coincides with yesterday's low. It is very possible that the price will move below 1.0276 and the Marlin Oscillator into negative territory at the same time. In this case, the euro will receive a strong downward momentum with further downward development.


    Analysis are provided by InstaForex.

    Read More
    Best regards, PR Manager
    Learn more about InstaForex Company at http://instaforex.com

Page 124 of 164 FirstFirst ... 24 74 114 122 123 124 125 126 134 ... LastLast

Tags for this Thread

Bookmarks

Posting Permissions

  • You may not post new threads
  • You may not post replies
  • You may not post attachments
  • You may not edit your posts
  •