Page 66 of 165 FirstFirst ... 16 56 64 65 66 67 68 76 116 ... LastLast
Results 651 to 660 of 1649

Wave Analysis by InstaForex

This is a discussion on Wave Analysis by InstaForex within the Analytics and News forums, part of the Trading Forum category; Forecast for AUD/USD on April 23, 2020 AUD/USD The Australian dollar did not consolidate below the MACD indicator line on ...


  1. #651
    Senior Member InstaForex Gertrude's Avatar
    Join Date
    Sep 2015
    Posts
    1,885
    Forecast for AUD/USD on April 23, 2020

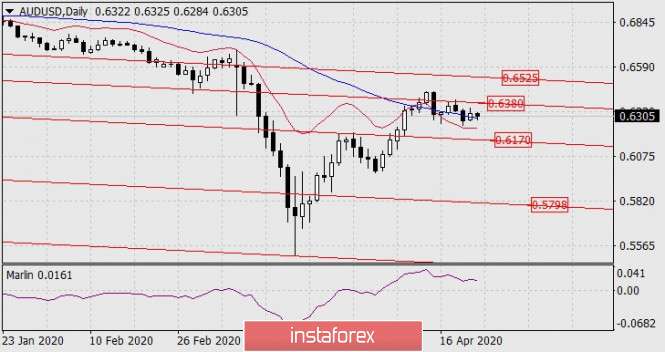
    AUD/USD The Australian dollar did not consolidate below the MACD indicator line on the daily chart on Wednesday, which delayed the start of the medium-term decline by another 1-2 days. The aussie grew by 42 points. Currently, the price lies on the MACD line, accumulating forces to break through, but growth is possible during this time of consolidation, even to the price channel line in the region of 0.6525, since the price is still above both indicator lines and the Marlin oscillator, albeit falling, remains in the growth zone. Formally, the trend is rising.


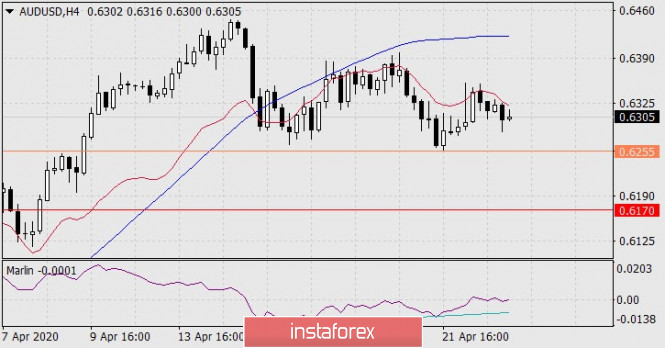
    When the price overcomes the signal level of 0.6255, this will be a reliable condition for the medium-term decline while aiming for 0.5798 and below. The setup is falling on the H4 chart - the price is below the adaptive balance line (red). The Marlin oscillator could reverse from the boundary of the growth territory. A convergence on Marlin that is not that strong can be worked out.


    It is advised to skip the possible price increase, since the reversal can occur from any nearest resistance (0.6380, 0.6446), open sales when the price goes below the signal level of 0.6255.

    *The market analysis posted here is meant to increase your awareness, but not to give instructions to make a trade.

    Analysis are provided byInstaForex.
    Best regards, PR Manager
    Learn more about InstaForex Company at http://instaforex.com

  2. #652
    Senior Member InstaForex Gertrude's Avatar
    Join Date
    Sep 2015
    Posts
    1,885
    Hot forecast and trading signals for GBP/USD pair on April 24

    GBP/USD H1.


    On the hourly chart, the pound/dollar pair is trading downward on April 24. The downward movement of quotes is supported by a strong downward trend line, which has at least 6 pivot points. The last time the pair's quotes rebound from it was yesterday. At the same time, there is a second trend line – an ascending one, which also has 6 pivot points at once and, accordingly, is also quite strong. Thus, the pound is currently fixed in a kind of triangle, leaving which will determine the further short-term trend of the pair. On the other hand, the statistics from the UK this week were generally as disastrous as those in other countries. The only report that could provoke the strengthening of the pound was the applications for unemployment benefits in March, which caused its fall. But all the other reports, including yesterday's business activity, most likely stop the bulls from buying pounds or close short positions on the US dollar. And if this is true, then the bears are activated either today or at the beginning of next week. As for the EUR/USD pair, we recommend that you pay attention to the report on long-term use orders in the States at the American trading session. If traders suddenly stop ignoring important statistics, then the bulls will be able to take advantage of the opportunities provided and continue to buy the pair with renewed strength. In any case, we have an ideal picture of the pound / dollar pair in terms of beauty and accuracy, which we assume two trading ideas for April 24:

    1) Bears need to consolidate below the upward trend line in order to continue the downward movement. This will break the short-term bullish trend and keep the longer-term bearish current. In this case, we recommend selling the pound in order to support the 4-hour timeframe 1.2276. Thus, Take Profit can be around 72 points.

    2) As long as the bulls are located above the upward trend line,the bullish trend persists in terms of intraday. Thus, the GBP/USD pair has even a growth potential to the level of 1.2395. However, no one knows how many more times the pair will push off from the upward trend line, so it is quite dangerous to trade for an increase right now. We believe that it is better to wait for the downward trend line to be broken, which will definitely be a strong signal to buy with the goal of the Senkou span B line of the 4-hour timeframe, which runs approximately at the level of 1.2467. Thus, the possible Take Profit for long positions is 68 points.

    *The market analysis posted here is meant to increase your awareness, but not to give instructions to make a trade.

    Analysis are provided byInstaForex.
    Best regards, PR Manager
    Learn more about InstaForex Company at http://instaforex.com

  3. #653
    Senior Member InstaForex Gertrude's Avatar
    Join Date
    Sep 2015
    Posts
    1,885
    Technical Analysis of ETH/USD for 27/04/2020:


    Crypto Industry News:

    The Dutch crypto savings platform, Bittr, decided to close its operations before the Netherlands introduced EU anti-money laundering regulations, AMLD5. The closing of Bittr is the result of open criticism of AMLD5 in the Netherlands, where according to all information they result in cryptographic companies paying higher fees than companies offering credit cards and traditional trusts. Bittr founder Ruben Waterman announced that the platform will close on April 28.

    Waterman does not agree to being forced to collect confidential data identifying his clients. While Waterman says he was willing to make some of the changes commissioned by AMLD5, he also claims that his company does not have the resources to manage the documentation or the resources to hire a clerk to handle the case. It is worth adding that Bittr is a one-man operation.

    While the AMLD5 was intended to increase regulatory transparency at the regional level, by introducing a unified AML framework, various laws at the national level led to unique interpretations of AMLD5 in different jurisdictions.

    The new guidelines require approximately 50 crypto companies based in the Netherlands to pay central bank supervision fees of approximately $ 1.8 million, and the costs be allocated according to the turnover of each company's virtual currency.

    Technical Market Outlook:

    The ETH/USD bulls has managed to push the price towards the level of $198, which is very close to the key short-term resistance level. The rate is moving inside of a Falling Wedge pattern, so any violation of the level of $193.78 will likely result in a further sell-off towards the level of $188.86 and below. There is a clear bearish divergence between the price and momentum indicator that supports the short-term bearish outlook.

    Weekly Pivot Points:
    WR3 - $243.80
    WR2 - $220.39
    WR1 - $211.16
    Weekly Pivot - $187.55
    WS1 - $172.98
    WS2 - $155.34 WS3 - $144.09

    Trading Recommendations:
    The fear of the coronavirus consequences is very strong among the global investors and it rules on the financial markets. So far the global investors are not so keen to invest in cryptocurrency, because they are being perceived as risky assets. The larger time frame trend on Ethereum remains down and as long as the level of $214.67 is not violated, all rallies will be treated as a counter-trend corrective moves. This is why the short positions are now more preferred.

    Analysis are provided byInstaForex.
    Best regards, PR Manager
    Learn more about InstaForex Company at http://instaforex.com

  4. #654
    Senior Member InstaForex Gertrude's Avatar
    Join Date
    Sep 2015
    Posts
    1,885
    Technical Analysis of ETH/USD for 28/04/2020:


    Crypto Industry News:
    EthereumPrice.org has released a new tool to calculate how much ETH can be earned by stacking coins under the new network consensus model. The Ethereum 2.0 calculator has many configurable settings that simulate different conditions and stacking variables. Users can customize many network (variable) settings that have a big impact on how the reward is calculated.

    For example, a change in the size of ETHs stacked in the network from 1% to 10% means a difference in earnings between 5% or 15% (each year). Another factor that will affect the award on an annual basis is, for example, the lifetime of the node (validator) itself.

    The tool calculates potential profits from 10 years of ETH stacking as well as each year. It will also calculate ROI (return on investment) in a given time. To view the value of their bid, users can choose from many fiat functional currencies, ETH in USD, EUR, GBP, JPY and others.

    The calculator is currently in public beta. The current interface should be treated more as an educational device than a means for practical calculations. However, this gives an idea of how important staking will become part of the 'new Ethereum' ecosystem. Technical Market Outlook:

    The ETH/USD bears has pushed the price out of the Falling Wedge pattern and Ethereum made a new local low at the level of $188.86. There is a clear bearish divergence between the price and momentum indicator that supports the short-term bearish outlook, so the level of $188.86 might not be the target level and the ETH/USD rate can drop even further towards the next target at $178.25. The key short-term technical resistance is still located at the level of $198.72 and only a clear breakout above this level will open the road towards the $209.09 target.

    Weekly Pivot Points:
    WR3 - $243.80
    WR2 - $220.39
    WR1 - $211.16
    Weekly Pivot - $187.55
    WS1 - $172.98
    WS2 - $155.34
    WS3 - $144.09

    Trading Recommendations:
    The fear of the coronavirus consequences is very strong among the global investors and it rules on the financial markets. So far the global investors are not so keen to invest in cryptocurrency, because they are being perceived as risky assets. The larger time frame trend on Ethereum remains down and as long as the level of $214.67 is not violated, all rallies will be treated as a counter-trend corrective moves. This is why the short positions are now more preferred.

    Analysis are provided byInstaForex.
    Best regards, PR Manager
    Learn more about InstaForex Company at http://instaforex.com

  5. #655
    Senior Member InstaForex Gertrude's Avatar
    Join Date
    Sep 2015
    Posts
    1,885
    Technical Analysis of EUR/USD for 29/04/2020:


    Technical Market Outlook:
    The EUR/USD pair has hit the key short-term resistance located at the level of 1.0878. So far the bulls were able to make a new local high at the level of 1.0849 and they are under the bearish pressure again. The price was rejected from the level of 1.0878 and a Bearish Engulfing candlestick pattern was made at the end of the move. The momentum is still strong and positive, but the market conditions are overbought, so the odds for another dynamic wave up are decreasing. The nearest technical support is seen at the level of 1.0809.

    Weekly Pivot Points:
    WR3 - 1.1057
    WR2 - 1.0976
    WR1 - 1.0895
    Weekly Pivot - 1.0809
    WS1 - 1.0731
    WS2 - 1.0641
    WS3 - 1.0563

    Trading Recommendations:
    The fear of the coronavirus consequences is very strong among the global investors and it rules on the financial markets. ON the EUR/USD pair the main trend is down, but the reversal is possible when the coronavirus pandemic will be tamed. The key long-term technical support is seen at the level of 1.0336 and the key long-term technical resistance is seen at the level of 1.1540. Only if one of this levels is clearly violated, the main trend might reverse (1.1540) or accelerate (1.0336).

    Analysis are provided byInstaForex.
    Best regards, PR Manager
    Learn more about InstaForex Company at http://instaforex.com

  6. #656
    Senior Member InstaForex Gertrude's Avatar
    Join Date
    Sep 2015
    Posts
    1,885
    Technical Analysis of ETH/USD for 30/04/2020:


    Crypto Industry News:
    The China Office of the Central Commission for Cyberspace Affairs (OCCAC) has announced blockchain projects that will receive the approval of national regulatory authorities. 224 projects in this technology have been added to the committee register, including large technology companies such as Alibaba, Baidu and China Mobile.

    The list of approved projects includes the ventures of several large corporations, including Walmart China, whose food safety tracking initiative has been marked green, and companies involved in the development of state-supported blockchain networks, such as China Mobile, China Merchants Bank and Alibaba. Some entities have been allowed to implement many DLT projects, and five blockchain projects from China Merchants Bank have already received approval.

    On April 25, China announced the commercial launch of the long-awaited Blockchain Service Network (BSN). The Chinese government announced over 2,000 BSN-based programs in the six months prior to the beta release in October 2019, including applications to support social assistance distribution, goods tracking and digital invoicing. On April 20, the city of Ya'an in Sichuan issued a statement supporting the directing of local hydropower to cryptocurrency mining operations, announcing plans to build the so-called Demonstration zones for hydropower consumption.

    Technical Market Outlook:
    The ETH/USD has been rallying for the last 36h straight as all the technical resistance levels has been violated. The next target for bulls is seen at the level of $235.42, but please notice, that the market conditions are extremely overbought. The nearest technical support is located at the level of $214.67, $212.48 and $209.89. The bulls are in full control of the market.

    Weekly Pivot Points:
    WR3 - $243.80
    WR2 - $220.39
    WR1 - $211.16
    Weekly Pivot - $187.55
    WS1 - $172.98
    WS2 - $155.34
    WS3 - $144.09

    Trading Recommendations:
    The fear of the coronavirus consequences is very strong among the global investors and it rules on the financial markets. So far the global investors are not so keen to invest in cryptocurrency, because they are being perceived as risky assets. The larger time frame trend on Ethereum remains down and as long as the level of $214.67 is not violated, all rallies will be treated as a counter-trend corrective moves. This is why the short positions are now more preferred.

    Analysis are provided byInstaForex.
    Best regards, PR Manager
    Learn more about InstaForex Company at http://instaforex.com

  7. #657
    Senior Member InstaForex Gertrude's Avatar
    Join Date
    Sep 2015
    Posts
    1,885
    Forecast for GBP/USD on May 4, 2020

    GBP/USD
    The British pound lost 100 points on Friday, which strengthened the reversal potential and the convergence power of the Marlin oscillator on the daily chart.


    To completely form conditions for the price to go down, it is necessary to gain a foothold under the MACD line (1.2365), while the Marlin signal line must go into the zone of negative values.


    Marlin is already in the decreasing trend zone on the four-hour chart, the price should overcome the support of the MACD line (1.2405). The support of the MACD line of the daily scope runs a little lower, in the region of 1.2365, therefore, the 1.2365-1.2405 range is transitional, it is possible to consolidate in this range.

    An attempt to move the price under technical support may occur after a preliminary increase to 1.2540 or slightly lower without breaking convergence on a daily basis. The current situation is not defined under any scenario, the price can freely wander in the range of 1.2365-1.2540.

    Analysis are provided byInstaForex.
    Best regards, PR Manager
    Learn more about InstaForex Company at http://instaforex.com

  8. #658
    Senior Member InstaForex Gertrude's Avatar
    Join Date
    Sep 2015
    Posts
    1,885
    Technical Analysis of GBP/USD for 05/05/2020:


    Technical Market Outlook:
    The GBP/USD pair has made a local low at the level of 1.2406, just above the 61% Fibonacci retracement located at 1.2397. Any violation of this level will open the road towards the next target for bears seen at 1.2310. There is a short-term ascending trend line close to this level, so it might get tough for bears to violate it in one go. Please notice, the market is coming off the overbought levels and the momentum indicator is neutral, but when it turn south, then the sell-off might accelerate towards 1.2246 level.

    Weekly Pivot Points:
    WR3 - 1.2909
    WR2 - 1.2757
    WR1 - 1.2605
    Weekly Pivot - 1.2476
    WS1 - 1.2324
    WS2 - 1.2200
    WS3 - 1.2054

    Trading Recommendations:
    The fear of the coronavirus consequences is very strong among the global investors and it rules on the financial markets. On the GBP/USD pair the main trend is down, but the reversal is possible when the corona virus pandemic will be tamed. The key long-term technical support has been recently violated (1.1983) and the new one is seen at the level of 1.1404. The key long-term technical resistance is seen at the level of 1.3518. Only if one of this levels is clearly violated, the main trend might reverse (1.3518) or accelerate (1.1404). The market might have done a Double Top pattern at the level of 1.2645, so the price might move lower in the longer-term.

    Analysis are provided byInstaForex.
    Best regards, PR Manager
    Learn more about InstaForex Company at http://instaforex.com

  9. #659
    Senior Member InstaForex Gertrude's Avatar
    Join Date
    Sep 2015
    Posts
    1,885
    Technical Analysis of EUR/USD for 06/05/2020:


    Technical Market Outlook:
    The EUR/USD bears have manage to push the prices through the short-term support located at the level of 1.0893 and through the trend line support as well. The momentum is now negative, so the odds for another dynamic wave up are decreasing. If the 61% Fibonacci retracement gets clearly violated, then the next technical support is seen at the level of 1.0779 and if broken, the sell-off might accelerate towards 1.0727.

    Weekly Pivot Points:
    WR3 - 1.1279
    WR2 - 1.1141
    WR1 - 1.1073
    Weekly Pivot - 1.0940
    WS1 - 1.0861
    WS2 - 1.0728
    WS3 - 1.0662

    Trading Recommendations:
    The fear of the coronavirus consequences is very strong among the global investors and this fear still rules on the financial markets. On the EUR/USD pair the main long term trend is down, but the reversal is possible when the coronavirus pandemic will be tamed. The key long-term technical support is seen at the level of 1.0336 and the key long-term technical resistance is seen at the level of 1.1540. Only if one of this levels is clearly violated, the main trend might reverse (1.1540) or accelerate (1.0336).

    Analysis are provided byInstaForex.
    Best regards, PR Manager
    Learn more about InstaForex Company at http://instaforex.com

  10. #660
    Senior Member InstaForex Gertrude's Avatar
    Join Date
    Sep 2015
    Posts
    1,885
    Technical Analysis of GBP/USD for 07/05/2020:


    Technical Market Outlook:
    The GBP/USD pair has broken below the short-term trend line support and below the technical support from the level of 1.2406. Please notice, the momentum indicator is now negative, so the sell-off might accelerate towards 1.2246 level. It looks like bulls are not strong enough to push the price above the level of 1.2485 again and the price is consolidating in a narrow zone before the plunge.

    Weekly Pivot Points:
    WR3 - 1.2909
    WR2 - 1.2757
    WR1 - 1.2605
    Weekly Pivot - 1.2476
    WS1 - 1.2324
    WS2 - 1.2200
    WS3 - 1.2054

    Trading Recommendations:
    The fear of the coronavirus consequences is very strong among the global investors and it rules on the financial markets. On the GBP/USD pair the main trend is down, but the reversal is possible when the corona virus pandemic will be tamed. The key long-term technical support has been recently violated (1.1983) and the new one is seen at the level of 1.1404. The key long-term technical resistance is seen at the level of 1.3518. Only if one of this levels is clearly violated, the main trend might reverse (1.3518) or accelerate (1.1404). The market might have done a Double Top pattern at the level of 1.2645, so the price might move lower in the longer-term.

    Analysis are provided byInstaForex.
    Best regards, PR Manager
    Learn more about InstaForex Company at http://instaforex.com

Page 66 of 165 FirstFirst ... 16 56 64 65 66 67 68 76 116 ... LastLast

Tags for this Thread

Bookmarks

Posting Permissions

  • You may not post new threads
  • You may not post replies
  • You may not post attachments
  • You may not edit your posts
  •