Page 39 of 43 FirstFirst ... 29 37 38 39 40 41 ... LastLast
Results 381 to 390 of 430
Like Tree6Likes

Forex Strategies

This is a discussion on Forex Strategies within the Trading Systems forums, part of the Trading Forum category; Talking Points: Volatility is the measurement of price variations over a specified period of time. Traders can approach low-volatility markets ...


  1. #381
    member ForeCastle's Avatar
    Join Date
    Apr 2013
    Posts
    1,077
    Blog Entries
    236

    How to Measure Volatility

    Talking Points:

    • Volatility is the measurement of price variations over a specified period of time.
    • Traders can approach low-volatility markets with two different approaches.
    • We discuss the Average True Range indicator as a measurement of volatility.

    Technical Analysis can bring a significant amount of value to a trader.

    While no indicator or set of indicators will perfectly predict the future, traders can use historical price movements to get an idea for what may happen in the future.

    A key component of this type of probabilistic approach is the ability to see the ‘big picture,’ or the general condition of the market being traded. We discussed market conditions in the article The Guiding Hand of Price Action; and in the piece we enclosed a few tips for traders to qualify the observed condition in an effort to more properly select the strategy and approach for trading that specific condition.

    Volatility is the measurement of price variations: Large price movements/changes are indicative of high volatility while smaller price movements are low volatility.

    As traders, price movements are what allow for profit. Larger price variations mean more potential for profit as there is simply more opportunity available with these bigger movements. But is this necessarily a good thing?

    The Dangers of Volatility

    The allure of high-volatility conditions can be obvious: Just as we said above, higher levels of volatility mean larger price movements; and larger price movements mean more opportunity.

    But traders need to see the other side of this coin: Higher levels of volatility also mean that price movements are even less predictable. Reversals can be more aggressive, and if a trader finds themselves on the wrong side of the move, the potential loss can be even higher in a high-volatility environment as the increased activity can entail larger price movements against the trader as well as in their favor.

    For many traders, especially new ones, higher levels of volatility can present significantly more risk than benefit.
    The reason for this is The Number One Mistake that Forex Traders Make; and the fact that higher levels of volatility expose these traders to these risks even more than low-volatility.

    So before we go into measuring or trading volatility, please know that risk management is a necessity when trading in these higher-volatility environments. Failure to observe the risks of such environments can be a quick way to face a dreaded margin call.

    Average True Range

    The Average True Range indicator stands above most others when it comes to the measurement of volatility. ATR was created by J. Welles Wilder (the same gentlemen that created RSI, Parabolic SAR, and the ADX indicator), and is designed to measure the True Range over a specified period of time.
    True Range is specified as the greater of:

    • High of the current period less the low of the current period
    • The high of the current period less the previous period’s closing value
    • The low of the current period less the previous period’s closing value

    Because we’re just trying to measure volatility, absolute values are used in the above computations to determine the ‘true range.’ So the largest of the above three numbers is the ‘true range,’ regardless of whether the value was negative or not.

    Once these values are computed, they can be averaged over a period of time to smooth out the near-term fluctuations (14 periods is common). The result is Average True Range.
    In the chart below, we’ve added ATR to illustrate how the indicator will register larger values as the range of price movements increases:


    How to Use ATR

    After traders have learned to measure volatility, they can then look to integrate the ATR indicator into their approaches in one of two ways.

    • As a volatility filter to determine which strategy or approach to employ
    • To measure risk (stop distance) when initiating trading positions

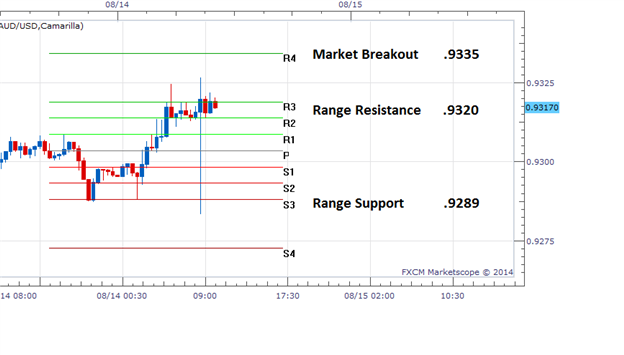
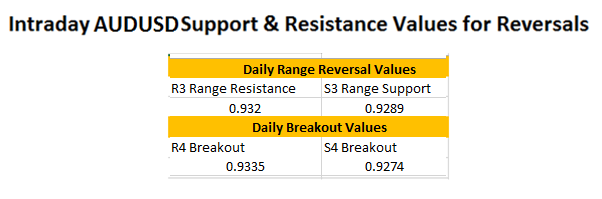
    Using ATR as a Volatility Filter

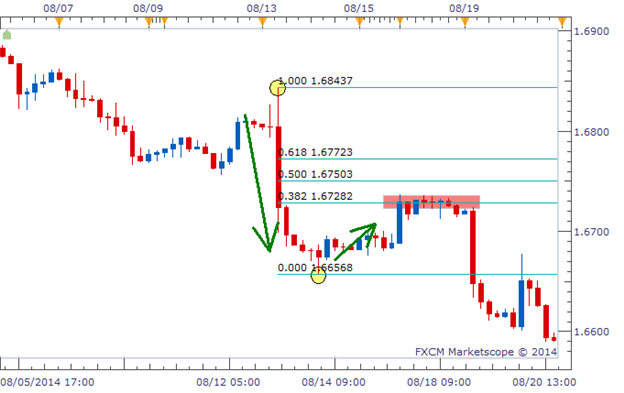
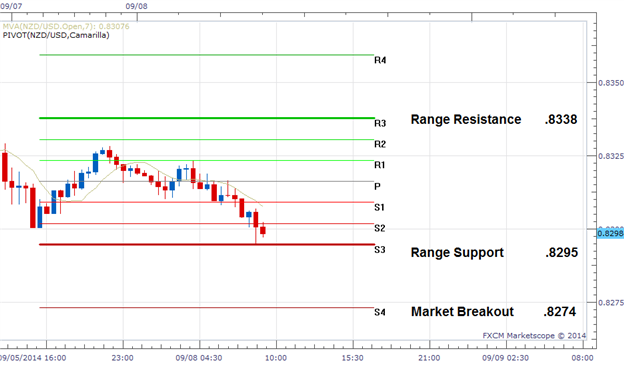
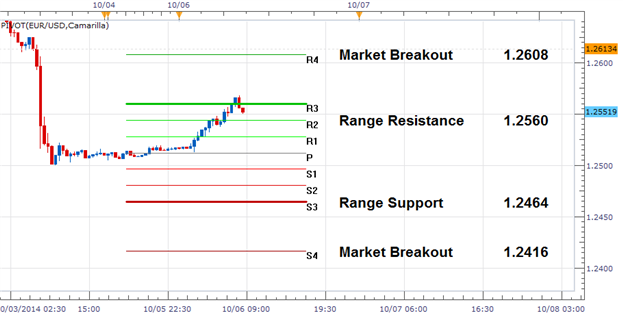
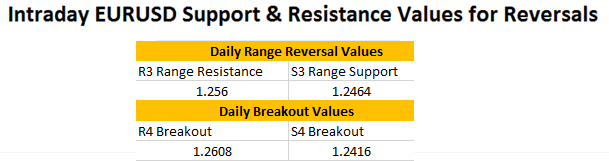
    Just as we had seen in our range-trading article, traders can approach low-volatility environments with two different approaches.

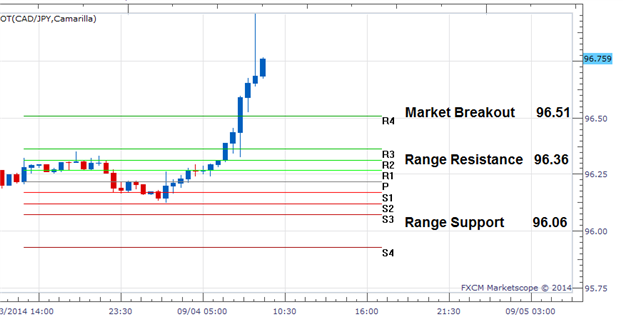
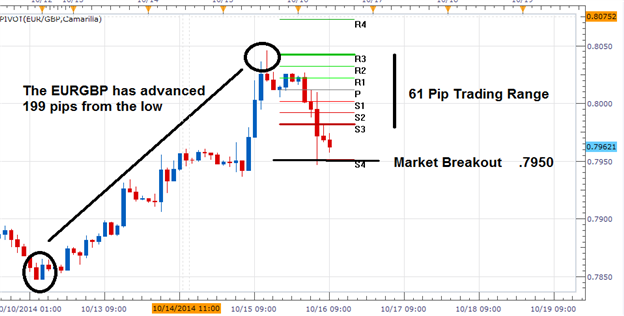
    Simply, traders can look for the low-volatility environment to continue, or they can look for it to change. Meaning, traders can approach low-volatility by trading the range (continuation of low-volatility), or they can look to trade the breakout (increase in volatility).

    The difference between the two conditions is huge; as range-traders are looking to sell resistance and buy support while breakout traders are looking to do the exact opposite.

    Further, range-traders have the luxury of well-defined support and resistance for stop placement; while breakout traders do not. And while breakouts can potentially lead to huge moves, the probability of success is significantly lower. This means that false breakouts can be abundant, and trading the breakout often requires more aggressive risk-reward ratios (to offset the lower probability of success).

    Using ATR for Risk Management

    One of the primary struggles for new traders is learning where to place the protective stop when initiating new positions. ATR can help with this goal.

    Because ATR is based on price movements in the market, the indicator will grow along with volatility. This enables the trader to use wider stops in more volatile markets, or tighter stops in lower-volatility environments.

    --- Written by James Stanley


    More...

  2. #382
    member ForeCastle's Avatar
    Join Date
    Apr 2013
    Posts
    1,077
    Blog Entries
    236

    FX Reversals: AUDUSD Trading Range Update

    Talking Points

    • AUDUSD Stays Range Bound
    • R3 Resistance Sits at .9320
    • Market Breakouts Signaled Over .9335

    AUDUSD 30min Chart


    The AUDUSD has continued to move in a defined trading range overnight, as well as for the first portion of the U.S trading session. Price began moving off of S3 support after a test of the .9289 price level. Price bounced and then quickly moved to R3 range resistance at .9320. At this point, price has again moved back down to support on U.S Initial Jobless Claims and then back to resistance on continued news volatility. After three daily moves between range support and resistance, range reversal traders will look for these values to hold unless market conditions change.

    Traders should always be mindful of the potential for a market breakout. A move above the R4 camarilla pivot would indicate the market is attempting to break to a higher high. Conversely, a break below S4 support would signal a strong move on US Dollar strength taking the AUDUSD pair towards new lows. In either scenario, a breakout would signal an end to ranging conditions and traders should react appropriately.


    ---Written by Walker England, Trading Instructor

    More...

  3. #383
    member ForeCastle's Avatar
    Join Date
    Apr 2013
    Posts
    1,077
    Blog Entries
    236

    The ‘Magic’ Behind Fibonacci

    Talking Points:

    • Fibonacci Retracement tracks the pullback after an extended move
    • Traders eye 38.2%, 50%, and 61.8% retracements as possible reversal levels
    • Fibonacci’s ‘magic’ comes from its self-fulfilling nature

    Where to Draw the Fibonacci Retracement?

    Where exactly is that? For starters, we need to identify an extended move up or down on our chart. In other words, a swing low followed by a defined high or a swing high followed by a defined low. Below, we have an example of a swing high (labeled 1) followed by a swing low (labeled 2).

    Drawing Fibonacci Retracement on a Chart


    The Fibonacci Retracement requires us to mark these two points, left-to-right. So after clicking the Fibonacci Retracement button at the top of our Marketscope charts, we would click point 1 and drag down to point 2 and release. The tool will do the rest of the work for us.

    What Do the Fibonacci Lines Mean?

    After drawing the two data points, we see 3 blue lines appear between the high and the low: 0.382, 0.500, and 0.618. These numbers represent how far price could retrace in percentage terms. So if price rose back to the 0.382 level, that would be a retracement of 38.2% of the original move. If price rose to the 0.500 level, that would be a retracement of 50% of the original move. If price rose to the 0.618 level, that would be a retracement of 61.8% of the original move.

    We can see these levels labeled in the chart below as potential resistance levels. These are price levels that price could bounce off of.

    Fibonacci Retracement Projecting Potential Resistance Levels


    There is no exact science to determine which level price will bounce or if price will bounce off any of the levels at all. But time and time again, we will see price bounce off of one of these three retracement levels created by using Fibonacci.

    Why Does Fibonacci Seem to Work?

    This is probably the most popular question I get regarding Fibonacci. Why does price bounce off these levels? What is the ‘magic’ that causes this? In my opinion, there is no magic involved in it at all. What causes price to sometimes react around these levels is due to the fact that many people are watching these exact same levels.

    If we have a large number of traders all looking at the same levels for a turnaround in price, they could create a cluster of orders that causes price to actually turn around at that level. It won’t always be that cut and dry, but that is the gist of using this type of tool. We are expecting other traders to be looking at these levels and cause price to react at these levels. It is self-fulfilling,

    Price Bouncing Off Fibonacci’s 38.2% Retracement Level


    The chart above shows the outcome of our example. Price retraced up to the 38.2% retracement level and stalled for a while before moving back in the direction of the original move. Traders that traded the potential bounce off of this level had a very successful trade without having to take on a lot of risk if they used a tight stop.


    ---Written by Rob Pasche


    More...

  4. #384
    member ForeCastle's Avatar
    Join Date
    Apr 2013
    Posts
    1,077
    Blog Entries
    236

    A Simple Guide for Using the Popular Moving Averages in Forex

    Talking Points:
    -Why Moving Averages Are Popular
    -Who Uses Moving Averages
    -How You Can Use the Popular Moving Averages

    Make everything as simple as possible, but not simpler.
    -Albert Einstein


    After many years of trading, you’ll be hard pressed to find an indicator as simple or effective as moving averages. Moving averages take a fixed set of data and give you an average price. If the average is moving higher, price is in an uptrend on at least one or possibly multiple time-frames.

    Why Moving Averages Are Popular


    Moving averages are simple to use and can be effective in recognizing trending, ranging, or corrective environments so that you can be better positioned for the next move. Often traders will use more than one moving average because two moving averages can be treated as a trend trigger. In other words, when the shorter moving average crosses above the slower moving average, like in the finger trap strategy, a buy signal is generated until the moving averages reverse or you hit your profit target.

    One word of warning: it’s best to stick to a few specific moving averages. This will prevent you from trying to find the “perfect moving average” and rather keep you objective as to whether the trend is starting, accelerating, or slowing down.
    The moving averages I often use are the 8, 21, 55 for trade triggers and a 100 or 200 for a clean trend filter. These moving averages are often used by investment banks however the 100 & 200 are the most widely used. The shorter moving average will depend on your preference and how many signals you’re looking to trade.

    Who Uses Moving Averages

    Moving Averages are often the first indicator that new traders are introduced to and for good reason. It helps you to define the trend and potential entries in the direction of the trend. However, moving averages are also utilized by fund managers & investment banks in their analysis to see if a market is nearing support or resistance or potentially reversing after a significant period.

    GBPUSD Traded Above the 200 DMA for 261 Days Showing Exhaustion


    Moving averages can be a simple tool to define support and resistance in the FX Market. When a market is in a strong trend, any bounce off a moving average, like the first bounce off the 200-dma in the GBPUSD chart above, can present a significant opportunity to join the trend until price closes below the 200-dma. However, if price continues to move above and below the moving average in a short period of time, you’re likely in a range and those reversals are lest significant from a trading point of view.

    How You Can Use the Popular Moving Averages

    There are many uses for moving averages but a simple system is to look for a moving average cross over. The moving average crossover looks for the short or faster moving average to cross above an already rising longer or slow moving average as a buy signal. When looking to sell a currency pair, you can look for the short or faster moving average to cross below a falling longer or slow moving average as a sell signal.

    AUDUSD Has Shown Clean Moves Around the 21 & 55-dma


    When looking to use moving averages, you’re ability to control downside risk will determine your success. It’s important to know that markets that were once trending, with very clean moving average signals, to a range with more noise than signals. If you can get comfortable with a specific set of moving averages, you can objectively analyze and trade the FX market week in and week out.

    Happy Trading!
    ---Written by Tyler Yell, Trading Instructor


    More...

  5. #385
    member ForeCastle's Avatar
    Join Date
    Apr 2013
    Posts
    1,077
    Blog Entries
    236

    FX Reversals: CADJPY Breakout

    Talking Points

    • CADJPY Breaks Above R4 Pivot
    • R3 Resistance Sits at 96.36
    • Market Reversals Signaled Under 95.91

    CADJPY 30min Chart


    Even with the Euro (EUR) and Pound Sterling (GBP) stealing the spotlight this morning, many Yen (JPY) pairs are also on the move. Currently the Canadian Dollar (CAD) is showing strength against the JPY, with the CADJPY pair breaking to higher highs this morning. This is displayed above, with the CADJPY trading well above its R4 camarilla pivot at 96.51. Knowing this, trend and momentum traders can look to take advantage of this directional move and look to find opportunities to buy the CADJPY on continued momentum.

    In the event that price falls back inside of the pivot range, this would represent a false breakout for the pair. This would invalidate the markets current upward trajectory, and could signal the beginning of a new price reversals. Currently the CADJPY range measures 30 pips, and is found between R3 resistance at 96.36 and S3 support at 96.06.


    ---Written by Walker England, Trading Instructor

    More...

  6. #386
    member ForeCastle's Avatar
    Join Date
    Apr 2013
    Posts
    1,077
    Blog Entries
    236

    FX Reversals: NZDUSD Reaches Support

    Talking Points

    • NZDUSD is Current Range Bound
    • R3 Support Sits at .8295
    • Market Breakouts Signaled Under .8274

    NZDUSD 30min Chart


    The NZDUSD starts the week supported going into the US session open. Currently price resides at range support, near the S3 camarilla pivot found at .8295. In the event price remains supported for the session, traders can look for a potential price bounce back towards range resistance. Currently resistance sits near the R3 pivot point at .8338, completing the days 43 pip trading range.

    A breakout below the S4 pivot would signal a strong reversal back in the direction of the NZDUSD’s current daily trend. It should be noted that price has declined as much as 566 pip over the last two months of trading. Conversely a price break above R4 resistance at .8360, would indicate momentum shifting towards a higher high. In either of the above breakout scenarios, the range should be considered invalidated for the day with traders then positioning themselves with the markets new direction.


    ---Written by Walker England, Trading Instructor


    More...

  7. #387
    member ForeCastle's Avatar
    Join Date
    Apr 2013
    Posts
    1,077
    Blog Entries
    236

    3 Reasons AUDUSD Could Be a Sell (Update)

    Talking Points:

    • AUD/USD short trade from last week triggered
    • Sentiment still giving bearish signals
    • Downtrend could continue towards 0.8700

    AUD/USD Support Broken - Bearish

    The trend line support cited in last week's article has been broken. The chart below shows that over the weekend, the AUD/USD gapped below the trend line and closed for the day. We had said we would act on a trade if the closing price was below support. That was our trigger. After a short term rebound up to 0.9100, AUD/USD then fell and closed for the day below 0.9000.
    AUD/USD Breaking Through Support


    The AUD/USD has moved sideways ever since the break which is normal following an extended move in one direction. Once price breaks out of this consolidation pattern, it then could continue to move lower.

    AUD/USD Sentiment Growing More Positive - Bearish

    Sentiment for AUD/USD last week showed that 66% of traders were long. Currently, SSI is at +2.25, meaning 69% of traders are long. Normally, we want to look to do the opposite of the retail trading crowd, so seeing a positive sentiment would give us a bias towards selling. This is especially true when sentiment is becoming even more positive.
    This could potentially be a sign that the Aussie could continue lower as sentiment increases in the positive direction.

    AUD/USD Speculative Sentiment Index (SSI) - Positive


    Exit Strategy

    As a longer term trade, an appropriate target could be as far as 0.8700 (250 pips below the current market price). This was a previous low hit back in late January that supported price. It could act as support once more. Using a 1:2 risk:reward ratio, this would require a stop loss of 125 pips or less.

    AUD/USD Support at 0.8700


    In Conclusion

    The AUD/USD is definitely a pair that I would consider "in play." There are several reasons to attempt to short but there are no guarantees in trading. Make sure you are using proper money management and perform your own due diligence before placing any trades on your own account.

    Good trading!
    ---Written by Rob Pasche


    More...

  8. #388
    member ForeCastle's Avatar
    Join Date
    Apr 2013
    Posts
    1,077
    Blog Entries
    236

    The Importance (and Calculation) of Transaction Costs

    Summary:
    FXCM is changing the spread and commission structure offered to clients; and this article is designed to walk you through those changes. For more details, please read the sections below this summary.

    The quick takeaway is that rather than including commissions in the spread; FXCM is offering clients ‘raw’ spreads with a commission attached. This is also coupled with an overall reduction in trading costs that can greatly benefit customers.
    To calculate spreads using the new commission model with comparison to the old model:

    The What:

    Trading is much like any other business that one might embark upon. Expenses are incurred in the search of revenues; and hopefully those revenues are greater than expenses incurred so that the remainder can go into the ‘Net Profit’ category. This net profit is money in the pocket… this is income, and this is the reason that people trade or go into business… the goal of making money.

    A key part of this equation is cost. Because it doesn’t matter how much you make in revenues, if your costs are greater than the amount brought in; well, you’re losing money. It’s really that black and white, and it’s really that simple.
    FXCM is embarking on a massive change with the goal of helping customers in that search for profitability. FXCM is initiating a change to reduce transaction costs while also making these costs significantly more apparent. While this may sound altruistic, this is a business move and we explain the ‘why’ later in the article. For now, we want to show off some of the new spreads along with the process to calculate transaction costs.

    The How:

    Previously, FXCM rolled all transaction costs into the spread with the goal of making this easier for clients to manage. This was a standard operating procedure in retail FX, but was quite a bit different than other markets such as stocks, futures, or options.

    Under the new pricing structure – there are two separate costs that are incurred when trading a position and this is very similar to those previously mentioned markets like stocks and options.

    The first is the spread… and the big difference is the size of the spreads. The second is the commission.

    The Spread

    Previously, the spread on FXCM platforms included the commission or markup charged by FXCM. This is changing in the fact that FXCM’s commission is going to be split away from the spread.

    Please note that spreads will still be variable based on market activity. Spreads can widen out ahead of news announcements because, like you, these liquidity providers don’t want to take a loss on a major news announcements. To compensate for the increased risk of trading/taking positions during news, those spreads can widen out. This is going to be true anytime you’re receiving access to legitimate market liquidity. To fix a spread is to make a market; and that’s indicative of a dealing desk that can take the other side of their customer’s trade.

    The reduction in spreads is remarkable. Previously the average spread on EURUSD was 2.5 pips; and once again – this included FXCM’s commission.

    The average spread on EURUSD under the new model is .2 pips. That’s a ‘point-two’ pips; not a full two pips.

    The average spread on AUDUSD under the new model is .4 pips. Cable (GBP/USD) is .6, and USDJPY is .3. You can see the full list of average spreads under the new model at the link below:
    Please click HERE to see FXCM Pricing

    The Commission

    The biggest change is going to be the inclusion of a separated commission that was previously included in the spread.
    There are two different commission structures based on the pair being traded. Very liquid pairs such as EURUSD, GBPUSD, USDJPY, USDCHF, AUDUSD, EURJPY, and GBPJPY will be four cents per 1k, per side.

    All other pairs will be under ‘commission schedule 2,’ which will be six cents per 1k, per side.

    So if a trader places a 1k trade in EURUSD, the commission to enter the position would be four cents. The commission to exit the trade would also be four cents. The ‘round-trip’ cost of the transaction would be an eight cent commission for a 1k lot.

    If the trade size was larger, let’s say 100k – we can simply multiply the four cents per 1k by 100; and the commission would be four dollars to enter, and four dollars to exit. The ‘round-trip’ commission of EURUSD on a 100k trade size would be eight dollars.

    For less liquid pairs, let’s say AUDCHF, the commission is six cents per 1k, per side. So a 1k trade in AUDCHF would cost six cents to enter, six cents to exit for a total commission of twelve cents.

    A larger trade size, such as 100k in AUDCHF would entail a commission of six dollars to enter and six dollars to exit (.06 * 100 = 6.0). So, the ‘round-trip’ commission on a 100k position in AUDCHF would carry a commission of $12.00.

    Putting it all together

    Spreads and commissions are being reduced with the new pricing model from FXCM.
    The average spread in EURUSD was previously 2.5 pips on FXCM platforms. Now the average spread is .2 pips under the new model. The new model also introduces a commission on each trade of four cents per 1k on the most liquid pairs such as EURUSD.

    A 1k trade in EURUSD previously was 25 cents (2.5 pip average spread * 10 cents per pip); and under the new model that cost would be 10 cents ((.2 pip average spread * 10 cents per pip) + (four cents per side per 1k * 2 (to enter and exit)).
    A 100k trade in EURUSD would previously have entailed a cost of $25 (2.5 pip average spread * 10 dollars per pip = $25). Under the new model, the total cost for a 100k EURUSD position would be $10 ((.2 pip average spread * $10 per pip = $2) + (four cents per 1k per side * 100 = $4 * 2 (to enter and exit))).

    The image below walks through the new pricing model using various trade sizes in EURUSD:


    The Why

    Point blank: FXCM wants their traders and customers to win. FXCM was a pioneer with No Dealing Desk Execution; which aligns the interests of the broker with those of their clients. With NDD execution, FXCM passes all orders received directly to the liquidity provider offering that price. This means FXCM never trades against their clients, and only receives income when traders place trades. In this relationship, the interests of the broker and client are aligned. This differs mightily from the dealing desk scenario in which the broker can take the other side of client trades… meaning if the client wins, the dealing desk could lose. This inherent conflict-of-interest was a necessity at the beginning of the retail FX market, as banks had little interest in taking a 100k (standard lot) position, much less a mini (10k) or micro (1k) lot; but today, this model is antiquated and quite frankly, potentially dangerous to clients and brokers.

    The standard for retail forex execution is now No Dealing Desk.

    With NDD execution, the broker does not trade against their own clients… all orders that come from FXCM customers go directly through FXCM’s platform to the liquidity provider offering that price. FXCM acts in the true essence of a broker – as a conduit between buyers and sellers, making a small amount on each transaction for the service provided. This was game-changing at a time when the standard execution model in FX was a dealing desk arrangement; whereby brokers could take the other side of a client’s trade… This is an inherent conflict-of-interest… If a broker takes the other side of a client’s trade, and the client wins – that means that the broker may lose from the simple act of their own client winning. This has led to practices such as re-quotes and/or shading.

    This is precisely why DailyFX/FXCM makes a concerted effort in Education and Analysis; to try to help their clients and traders as much as possible in that quest for profitability. The new pricing model along with reduced commissions is another aim to help those traders even more.

    --- Written by James Stanley


    More...

  9. #389
    member ForeCastle's Avatar
    Join Date
    Apr 2013
    Posts
    1,077
    Blog Entries
    236

    EURUSD Mondays Reversal Range

    Talking Points

    • EURUSD Retraces in a Downtrend
    • Range Resistance Holds at 1.2560
    • Range Reversals Triggered Under 1.2416

    EURUSD 30min Chart


    After dropping as much as 174 pips during Fridays trading, the Euro has quietly retraced to a key point of resistance this morning. Currently price sits under the R3 Camarilla Pivot, depicted above at a price of 1.2560. In the event that resistance holds, trend traders will look for price to move back towards support now found at 1.2464. The distance between these two points is 96 pips, which comprise today's reversal range.

    In the event of an increase in price momentum, traders can begin positioning for a breakout. A drop below the S4 pivot, at a price of 1.2416, would signal the creation of a lower low and a strong continuation signal with the trend. A move above R4 resistance at 1.2608 would create a counter trend reversal, as the EURUSD would be breaking to a higher high at this point. In either breakout scenario, traders should consider concluding any range bound positioning and trade with the markets new found momentum.


    More...

  10. #390
    member ForeCastle's Avatar
    Join Date
    Apr 2013
    Posts
    1,077
    Blog Entries
    236

    EURGBP Intraday Market Reversal

    Talking Points

    • EURGBP Opens in a 61 Pip Range
    • Range Resistance Sits at .8042
    • Range Reversals Triggered Under .7950

    EURGBP 2 Hour Chart


    The EURGBP has advanced as much as 199 pips this week, as measured from its standing high and low. Currently price is trading outside of its daily trading range and attempting to break through todays S4 Camarilla Pivot. A price break below support has the potential to signal a reversal in price action as the EURGBP attempts a move toward lower lows.

    At this point, price also has the potential to rally back inside of its trading range. A move back inside of todays 61 pip trading range could prove todays move a retracement in a broader trend. In the event that price moves back above range support at .7981 traders can begin to look for price to resume its trend by first testing range resistance. Current resistance stands at the R3 Camarilla Pivot, at a price of .8042.


    ---Written by Walker England, Trading Instructor


    More...

Page 39 of 43 FirstFirst ... 29 37 38 39 40 41 ... LastLast

LinkBacks (?)

  1. 10-09-2013, 09:11 PM

Tags for this Thread

Bookmarks

Posting Permissions

  • You may not post new threads
  • You may not post replies
  • You may not post attachments
  • You may not edit your posts
  •