Page 29 of 43 FirstFirst ... 19 27 28 29 30 31 39 ... LastLast
Results 281 to 290 of 430
Like Tree6Likes

Forex Strategies

This is a discussion on Forex Strategies within the Trading Systems forums, part of the Trading Forum category; Talking Points: Traders can look for high-probability setups by matching a strong and a weak currency Strong/Weak Analysis can be ...


  1. #281
    member ForeCastle's Avatar
    Join Date
    Apr 2013
    Posts
    1,077
    Blog Entries
    236

    Trading the Strong and the Weak

    Talking Points:

    • Traders can look for high-probability setups by matching a strong and a weak currency
    • Strong/Weak Analysis can be performed in a variety of ways; in the article we address two
    • We outline approaches for Scalpers, Swing Traders, and Longer-Term Fundamental Traders


    Many traders in the currency market have yet to learn one of the best things about trading Forex… And it’s not that they don’t know, as much as it’s something they don’t yet realize: And what I mean is: You can be wrong, and still win. This is one of the great parts about trading two-sided pairs.

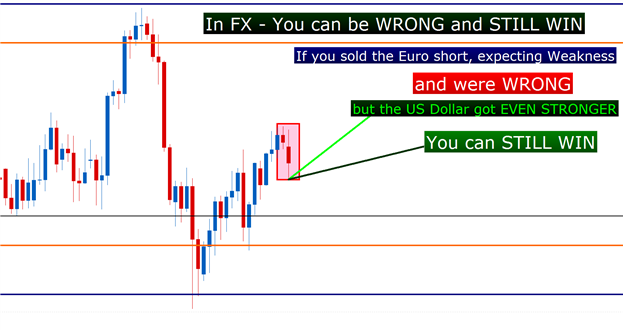
    Let’s say, for instance, that you expect weakness in Euro, for whatever reason. And let’s say that whatever expectation you had didn’t come to fruition; i.e., you were wrong. So, rather than weakness, the Euro saw strength.

    But what if you traded Euro weakness through a short EUR/USD position, and the US Dollar got even stronger than the Euro when your analysis proved incorrect…

    Well, EUR/USD would go down because USD got stronger than Euro, and even though you were wrong – you could still win in the trade.

    The Value of a Two-Sided Pair: You can be wrong and still win in the trade


    Traders have an extra dimension to every one of their positions in the FX market. If you want to trade a stock, you basically have two ways to voice your opinion – you can buy or you can sell. In the Forex market, if you decide you want to sell Euros, you have a plethora of ways to do it. You can sell Euros against US Dollars or Japanese Yen. Or perhaps you wanted something a little more conservative, in which you could choose nearby trading partners using British Pounds or Swiss Franc.

    In the FX market, it behooves the trader to add that additional step to their analysis; after deciding that they want to buy or sell a currency, then moving on to choose which currency they want to use to create the most favorable setup possible.

    The Importance of Strength and Weakness

    The flip side of the above scenario is that we can be right and still lose. Let’s use the same scenario, in which you’re looking for Euro weakness, and let’s say that Euro zone GDP comes out much weaker than expected. So - you were right.

    Sure, the Euro should get weak; but let’s say in this scenario that the weaker-than-expected GDP actually increases investor’s hope for an extension of QE3 and a later-than-expected tapering of QE purchases from the United States. In this case, the Dollar may get much weaker than the Euro; and even though Euros may weaken against Sterling, or Australian Dollars, or Japanese Yen; if you’re trading EUR/USD – you were right and you are still going to lose.

    So, if you’re going to trade a currency for weakness, you want to match it up with a currency with which you expect strength to give yourself the best probabilities of success. This way, if your idea doesn’t work out, you still have a chance of winning the trade if the other currency in the pair performs as expected.
    Strong/Weak Analysis in a Strategy

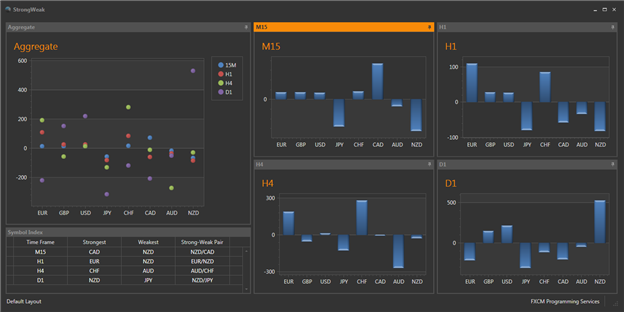
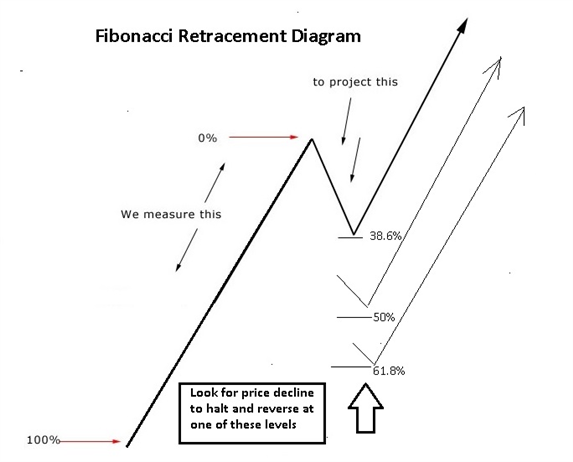
    Trends develop from deviations in strength and weakness… if the Euro is stronger than the US Dollar over a period of time, prices will be trending higher. That’s one of the great parts about technical analysis; it will give us an honest depiction of strength and/or weakness in each pairing over whatever time frame that we want.
    Unfortunately, those deviations don’t always continue; which is why traders need more than just technical analysis to trade in markets, as we outlined in The Complete Trading Approach.


    Strong/Weak Analysis to the Scalper

    This brand of analysis is extremely common for short-term traders (commonly called ‘scalpers’ in the FX market).
    The allure of such a system is logical: If traders are able to find longer-term trends, or ‘bigger-picture’ moves, they can look to scalp inside of those moves in the direction of those trends.

    Scalpers are often best served by identifying trends on the hourly and/or four-hour charts so that they can look for that momentum to take their trade(s) on the shorter-term chart to profitable territory.
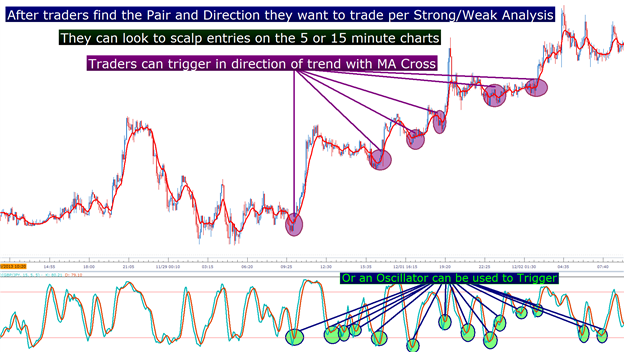
    Scalpers can look for pairs with the greatest strength/weakness deviation on the hourly chart, and then look for a short-term pullback in prices.

    After the retracement has finished, as the pair moves in the direction of the general trend, traders can look to enter in that direction; anticipating that the longer-term trend may win out.
    Traders can look to trigger in a variety of ways. An oscillator on the shorter-term chart can be an excellent entry mechanism, as can a cross of a moving average.

    Scalpers can use strong weak to find the trend; and enter using indicator triggers


    The benefit of waiting on a pullback is the fact that the trader can look to enter relatively cheaply; so that if the trend comes back, the payoff could be large relative to the amount of risk that it took to initiate the position. But if the trend doesn't come back, the loss can be mitigated, and the trader can look for greener pastures elsewhere (or later).

    Strong/Weak Analysis to the Swing Trader

    Swing traders take a slightly different view on markets than the scalper, but the approach is often similar with longer time frames being used.

    We outlined such an approach in The Four-Hour Trader.

    Swing traders can look to the four-hour, and daily chart to grade trends and determine biases that they may want to work with. And like the scalper, they often want to wait for prices to pull back in those trends so that they can look to buy low, and/or sell high.

    In The Four Hour Trader, we teach traders how this can be done with price action; and if you want to become a better price action trader, the article Four Simple Ways to Become a Better Price Action Trader can help. We can use a similar approach by strengthening our trend analysis with Strong/Weak.

    Traders can look for pairs with the greatest strength/weakness deviations, and look to trade those pairs in the direction of the trend after the currency pair retraces.

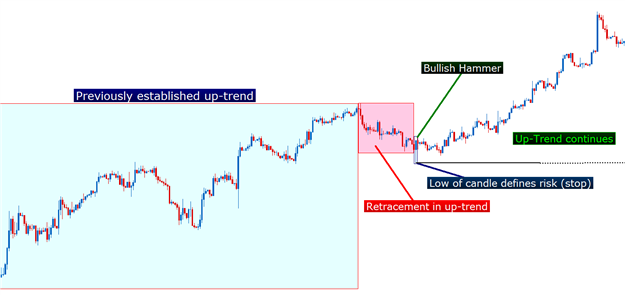
    Traders can look to trade in the direction of the trend, triggering with an Oscillator or moving average entry as seen above; or by using a price action formation such as a Bullish Hammer as outlined in The Four Hour Trader.
    Swing traders can use price action to trigger in the strongest trends


    Strong/Weak Analysis to the Long-Term Fundamental Trader

    If you already have your own bias, then deciding the direction you want to trade a currency is rather simple, because you already know if you want to buy or sell it.

    Traders with a long-term fundamental viewpoint often have this bias based on their own macro-economic analysis. Perhaps they expect weakness in Europe due to structural problems with debt obligations, or maybe they’re looking for weakness in the Yen under the expectation of another round of Abenomics.
    These traders can use Strong/Weak analysis for a couple of different purposes.
    First and foremost, these traders can use Strong/Weak analysis to properly voice their trade opinion in the first place.

    If you want to look for weakness in Yen, marry the currency up with something that you expect to get stronger. Dollars have been popular lately, as has the British Pound. Just as we described above, this could give the trader the best chances of success simply by voicing his trade idea in the cleanest, most proficient manner possible.

    But longer-term fundamental traders can take Strong/Weak a step further with actually timing the trade.
    Let’s say that our trade above decided to buy GBPJPY in the expectation that Japanese weakness would bring another round of QE, while expecting strength British Pounds on the back of an improving UK economy.
    So the trader that wants to go long GBPJPY can trigger into the position with Strong/Weak analysis.
    The longer-term trader wants to perform their analysis at roughly similar times each day; allowing them to make apples-to-apples comparison with market dynamics.

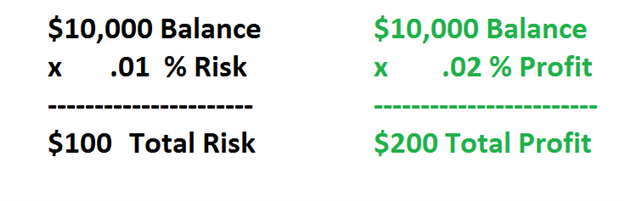
    Even though the longer-term fundamental trader differs in vantage point and outlook from scalpers and swing-traders, it doesn’t mean they ignore risk management; and they too should look to ‘buy low – sell high.’
    Longer-term fundamental traders can wait for the British Pound to show weakness, and/or the Japanese Yen to show strength; amounting to a pullback or retracement in the pair.

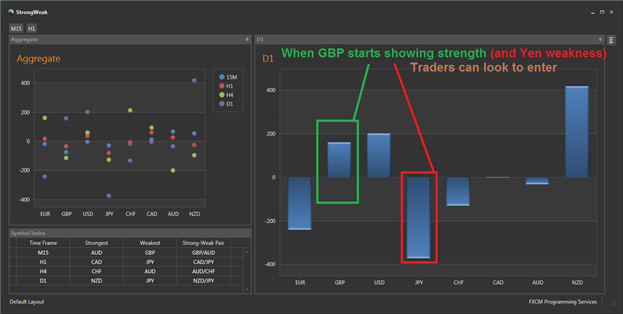
    After at least two days of retracement, the trader beings plotting an entry to get long. On the first day that shows strength in the pair (GBP goes up by more than JPY or JPY goes down more than GBP); the trader triggers the position, risking a percentage of their account on the trade idea as a stop.

    As the original trend comes back, Longer-term fundamental traders enter


    They look at the position each day whilst performing their daily analysis, adjusting the stop as appropriate if the position moves in the traders favor.

    After a trader has a profitable position, they can use those profits to finance additional positions should the trend continue moving higher. This is the way many of the greatest traders have speculated, turning big moves into huge gains, all financed by one initial position.

    -- Written by James Stanley

    More...

  2. #282
    member ForeCastle's Avatar
    Join Date
    Apr 2013
    Posts
    1,077
    Blog Entries
    236

    How to Use Fibonacci to Ride Dollar Yen

    Talking Points
    - Fibonacci retracement zones can be used to determine when a correction in trend is over.
    - Traders use Fibonacci retracement zones to pinpoint low risk well defined trade opportunities
    - Fibonacci lines can be used to place stops and limits.

    Catching a Ride on the Trend

    Many traders struggle to “make the trend their trend” because they lack a consistent entry strategy for rejoining an established trend. It is commonly held that a trend does not move in a straight line. Rather, a trend expands and contracts much like the inhaling or exhaling of breath. This rhythmical pattern can be predicted mathematically by many Forex Traders based on set of Fibonacci ratios. This can help traders find low risk entries for trading with the trend.

    Leonardo Pisano Bigollo, also known Fibonacci was a 12th century Italian mathematician who is credited for introducing the Golden mean to Western civilization. He used a problem that asked how many pairs of rabbits are created by one pair in one year to introduce the Fibonacci series.

    The series goes like this 1,2,3,5,8,13,21,34,55,89,144,233,377. The first and second numbers are added to get the third number then the third and fourth numbers are added to get the fifth number and so on. So you are probably asking how do rabbits and number series give me a place to enter USD/JPY?

    Well, these numbers are related to give us the Fibonacci ratios that traders use. Take the first number 1 and divide it by 2 to get 0.50. Take 21 and divide it by 34 to get 0.618, another retracement level and divide the alternating numbers like 13 and 34 to get 0.382 which is another Fibonacci level.

    Applying these Ratios to a Trend

    Like reproducing rabbits, a trend is a state of growth. So applying these ratios to an established expanding trend often reveal great areas to trade with the trend. These ratios act like signs on a street revealing where the next bus stop is likely to turn up. Notice in the diagram below how after a move higher, price is likely to pull back and rebound from one of these areas.


    Trading Setup

    The current trading setup shows a USD/JPY 4-hour chart uptrend swing that started on November 26th at 101.13 and stoppedat 103.36 on December 2nd. Though some traders may have missed this 225 pip rise, they can still have a second chance at joining this trend using the retracement ratios. In the chart below, we can clearly see that USD/JPY did not stop at the 23.6% Fibonacci level at 102.84. So we look to the next Fibonacci level at 102.51 which is the 38.2%. USDJPY could rebound from that level and we would need to watch this level. But the wide ranging red bearish candle may push right through the 38% Fibonacci straight down to the 50% Fibonacci level at 102.25. USDJPY spent 48 hours consolidating at this level so I am looking for price to rebound from 102.25.

    Learn Forex: USDJPYFibonacci Bounce Trade Setup


    If this level holds, a stop can be placed below the 61.8% Fibonacci level after entering long around 102.25. The first target would be the old December 2nd high of 103.36. A breakout above that area could take USDJPY to the 104.00 area. There two more Fibonacci levels however the deeper the correction the less likely the trend is to continue. Sometimes, price may turn just a few pips away from a Fibonacci level so it is also important to look at Fibonacci as zones of support and resistance rather than concrete levels.
    In sum, traders have a great opportunity to rejoin a very strong USD/JPY uptrend using Fibonacci retracements.

    Grazie Leonardo!

    ---Written by Gregory McLeod Trading Instructor

    More...

  3. #283
    member ForeCastle's Avatar
    Join Date
    Apr 2013
    Posts
    1,077
    Blog Entries
    236

    The GBPUSD Starts Decemeber Trading at SSI Extremes

    Talking Points

    • SSI is a positioning tool gauging market sentiment.
    • SSI can help gauge strong market trends.
    • The GBPUSD has reached an extreme negative reading to start December trading.


    SSI (Speculative Sentiment Index) is a proprietary trading tool to FXCM, offered to its clients through DailyFX PLUS. SSi is used to determine trading positioning, and once you are familiarized with the indicator it can be used to confirm trend on Forex pairs and CFD contracts. Currently the GBPUSD is reading an extreme -4.29. Today we will review exactly what this may mean for the last month of the 2013 trading year.

    Learn Forex – Current SSI Readings


    SSI and the Pound

    As of this morning we can see in the chart above that the SSI reading for the GBPUSD has reached an extreme reading of -4.29. As the number reads negative, this means more positions are over 4 times the amount of short interest on the GBPUSD relative to long positioning.

    The main reason that the SSI reading has reached these extreme levels is primarily due to the currency pair’s strong trend. Below you can see the GBPUSD trending as much as 1692 pips higher from Julys low through this week’s high. As most traders attempt to fade strong trends, SSI has become more negative as the pair continues to trade towards higher highs.

    Learn Forex – GBPUSD Daily Trend


    Trading the GBPUSD

    Below we can see the price of the GBPUSD over time relative to its SSI reading. Putting both aspects together give the trader a clear idea of how they operate in tandem. Knowing this, traders should look to continue to find opportunities to buy the GBPUSD as interest remains extremely negative.

    As with any component in an existing trading plan, SSI should be continually monitored. This can be done through DailyFX PLUS where it is updated twice daily. If position continues to be largely net short, then this can be taken as a confirmation to the continuation of the current downtrend. Conversely, if SSI begins to advance and net short interest declines this could be taken as a signal that the current uptrend in the GBPUSD is at least temporarily coming to a pause.


    ---Written by Walker England, Trading Instructor

    More...

  4. #284
    member ForeCastle's Avatar
    Join Date
    Apr 2013
    Posts
    1,077
    Blog Entries
    236

    Learn Forex: How to Use RSI to Confirm a Forex Dollar Breakout

    Talking Points
    - The RSI Oscillator measures current Forex price strength using previous closing prices
    - The Forex closing price is the most important as it reflects money being transferred from losers to winners
    - Usually traders look for RSI to move below 30 and back above for a buy signal.

    However, an RSI move above 50 is also used to signal a buy as well

    RSI is versatile and popular trading indicator used by Forex traders to identify when a currency pair is oversold or overbought. When a Forex currency pair is overbought, it is like a racecar whose engine is red-lining as it is being pushed to the limit by its driver. Eventually, if the driver does not let up off of the accelerator, the engine blows up and the car slows down to a standstill. Currency pairs can continue to make new highs even though they are in an overbought condition as traders continue to bid a currency pair up. RSI is like the tachometer on a car’s dashboard that monitors this momentum.

    As traders, we want to join strong trends and catch them in their earliest stages for maximum profit and minimum risk. Forex traders can accomplish both tasks by looking for RSI turning points at 30, 50 and 70. Typically, Forex traders will look for RSI to move down below the 30 horizontal reference line indicating selling momentum is at its peak. Next, they will wait for RSI to move back above the 30 reference line indicating that the oversold condition has passed and the last buyers have been flushed out of the market. This is a clear buy signal as each previous closing price is higher than the one preceding it.

    On the other hand, Forex traders looking to short a currency pair will wait for RSI to move above the 70 reference line indicating an overbought condition. As the Forex short-seller is forced out of the market, RSI moves back below the 70 reference line generating a sell signal. Each previous closing price is lower than the one preceding it showing that sellers are taking control.

    There is an alternate way that RSI generates a buy and sell signals. When both RSI crosses above the 50 horizontal reference line and price is rising, a buy signal is generated. Also, when price is falling and RSI is crossing below 50 horizontal reference line, a sell signal is generated.

    Learn Forex: USDCHF Forex Triangle with RSI


    In the example above, USDCHF is trapped in range between 0.9450 and 0.8900. Currently, USDCHF is nearing the bottom of its range and forming a triangle on the daily chart. Though USDCHF has been declining since peaking at the beginning of November in the 0.9250 area, RSI has hugged the bottom of the 50 reference line. A breakout is near and Friday’s US Employment number may be the catalyst that propels USDCHF higher.

    Forex traders can look to the RSI indicator for a buy signal. A buy signal would be generated if RSI moved above the 50 horizontal reference line while price is also moving out of the triangle clearing the last swing high near 0.9120. A 1:2 risk reward target of 0.9448 fits in with the range. This long setup would be invalid if price takes out the October lows near 0.8900.

    Using RSI can help confirm price pattern breakouts and alert traders when a Forex currency pair is ready to make its next move. RSI can help you avoid the bull and bear traps set with false breakouts. May the Momentum Be With You!

    ---Written by Gregory McLeod Trading Instructor

    More...

  5. #285
    member ForeCastle's Avatar
    Join Date
    Apr 2013
    Posts
    1,077
    Blog Entries
    236

    Why the SPX500 Trend Could Continue On For another Few Years

    Talking Points

    • Many Retail Traders Are Short S&P500
    • Historical Rallies Have Far Surpassed The Current Rally
    • SPX500 corrections have been shallow and denote underlying strength


    " If you trade Countertrend, you are gambling, and although you will often win and have fun, the math is against you, and you will slowly but surely go broke. Countertrend setups in strong trends almost always fail and become great With Trend setups..."
    -Al Brooks, Reading Price Charts Bar by Bar

    The current equity rally has been dubbed my many as one of the most hated stock rallies in recent history. The reason for the rally’s despise by the trading public likely has more to do with the media and unprofitable hedge fund managers who argue that the market is wrong and should be vastly lower . However, as we end 2013, the SPX will end a top-10 year despite its critics and looking a history, this rally could continue.

    Retail Traders Are Short SPX as the Trend Looks Strong


    Trader sentiment is a favorite tool of the DailyFX faithful to see when a FX market is being aggressively denied by retail traders. While we hope that traders on the whole were more successful, our Traits of Success Forex Traders report clearly showed that retail traders aggressively fade strong trends or add to their losing trades against the trend. The report covered 12 million live FXCM account holder trades and made the obvious point that when the retail crowd is extremely negative towards a specific trend, that trend can and likely will continue to the disappointment of many traders.

    Looking above, you’ll see a line price chart of the SPX500 with an overlay of retail positioning where a current reading of -6 shows you that there are 6 traders short for every one trader long on the FXCM order book. A -6 reading clearly displays an overwhelming attempt by traders to call a top to the SPX500. Sadly, as you can see above, retail traders have been net short for all of 2013 as the SPX500 has rallied 26.5% YTD for over 400 points.

    Bottom Line: Trading with the retail crowd is a risky strategy as the crowd will aggressively look to call a top months or years before the event comes to pass. The SPX500 is a strong trend that is likely best to either be long or flat but not short.

    Historical Rallies Have Far Surpassed the Current Rally

    There is a massive list of cognitive bias’ that are important to fight off as you look to build up your trading account. The two that I believe must be fought most aggressively is overconfidence which breeds over trading your account and not thinking like a pro and the recency bias. The recency bias states that you most easily recall and expect a repeat occurrence of something that recently played out. In terms of the stock market, many have been looking for a repeat or worse of the 2008 equity market crash.

    With the event of the 2008 market crash and following great recession in mind, many traders feel like the market “is due” for a correction / crash because of how far the equities market has move from the March 9th, 2009 low. However, if you go back past the 2008 global credit crisis and subsequent equity market crash you’ll realize that the SPX500 has had rallies that have far surpassed what is currently in play.

    Long-Term view of SPX500 Shows Prior Rallies


    Corrections on the SPX500 have been relatively shallow as major institutions are putting too much belief into a downside move as seen few if any lower highs and lower lows on the charts. Price in relation to the 55-week moving average is rather telling when you look at historical rallies. The current rally going back to late 2012 has had weekly closes above the 55-week moving average for nearly 80 weeks.

    However, if you put your recency bias aside, you’ll see that the SPX500 closed above the 55-week moving average for 167-weeks going into the 1987 crash and consequently 190-weeks going into the summer 1998 high. Therefore, recency bias may have you thinking that a crash is around the corner but prior bull markets show that this rally could go on for another few years.

    Bottom Line: Judging the SPX500 by historical standards and not the most recent major correction shows that this rally could have much further to run before running out of steam. Therefore, trading against this long term trend could be disappointing and costly.

    SPX500 corrections have been shallow and denote underlying strength


    The strength of an overall trend can often be discovered through corrections. The SPX has had its share of sell-offs since the 2009-low but most have been well contained and only one correction tested the Fibonacci level of last resort, the 76.4% before resumption of the trend. What’s more, the cause of that correction was the government shutdown and debt ceiling crisis in 2011 which caused XAUUSD to spike to $1920 per oz. before the fear market ensued. As you well now know, we had a repeat of that fundamental story in Washington DC this October but the correction was shallow and was followed by all time-highs in the SPX500.
    Bottom Line: Corrections can often tell you how strong the trend is and how much conviction traders have who are going against the trend. The shallow and sideways corrections that the SPX500 has experienced over the last 4 years and specifically this year shows it’s best to stay either be bullish or flat, but fading this trend is a low probability play.
    Happy Trading!
    ---Written by Tyler Yell, Trading Instructor

    More...

  6. #286
    member ForeCastle's Avatar
    Join Date
    Apr 2013
    Posts
    1,077
    Blog Entries
    236

    Strong & Weak: Pound Sterling Continues to Shine

    Talking Points:
    -British Pound has been the best performer over the past 5 weeks
    -GBP to USD pair showing an extreme SSI reading suggesting further gain for Pound
    -Buy British Pound Currency Basket (enroll for demo account at the same link)

    The British Pound has been in a broad based rally for more than 5 weeks now and is located near the top of this week’s strong and weak analysis. We first highlighted the Sterling strength 2 weeks ago as the British Pound Outperforms.

    Forex Strategy: Matching Strong versus Weak

    Currency Up Arrows Down Arrows Change From Last Report
    CHF 7 Higher 1 ranking
    GBP 6 1 Lower 1 ranking
    EUR 4 2 No Change
    NZD 4 2 Higher 3 rankings
    USD 3 4 Lower 2 ranking
    CAD 2 5 Lower 1 rankings
    AUD 1 6 Higher 1 ranking
    JPY 7 Lower 1 ranking


    We will continue to hold the GBP Buy Basket trade open for another 1% gain (without leverage) or until Christmas. The reason for the time stop of December 25 is because December is generally a strong month for Sterling gains and January is one of the worst months. Since we have earned some nice gains so far and we don’t want to give them back. Therefore, if the basket doesn’t capture another 1% gain by Christmas, then we will close out the trade and move to a flat position over the holidays.
    One factor behind the potential for additional gains in the Pound is FXCM’s Speculative Sentiment Index (SSI).

    Forex Education: GBPUSD’s Sentiment Chart


    The amount of sellers in the GBP to USD has steadily increased as the exchange rate increased from the 1.50 low in July. These sellers become a future supply of buyers when they decide to close out their trades. We will use this future supply of buyers as an opportunity to keep the Pound supported.
    Executing the Trade

    Since we anticipate the British Pound may continue its broad based rally we will take a diversified approach and buy the single currency against a basket of currencies. There are several advantages to trading a currency rather than a pair with the largest benefit being diversification.
    You can try trading the GBP Basket BUY position in a Mirror account. You can even try this out in a practice account at the same link above.
    Good luck with your trading!
    ---Written by Jeremy Wagner, Head Trading Instructor, DailyFX Education

    More...

  7. #287
    member ForeCastle's Avatar
    Join Date
    Apr 2013
    Posts
    1,077
    Blog Entries
    236

    3 Tips For Trading a Daily Chart

    Talking Points

    • Identify the trend to form a trading bias using 6 months of price data.
    • Time your entries, and wait patiently for trading opportunities.
    • Managing risk is an important step in trading the Daily Chart, plan accordingly.


    Novice and veteran traders trying to trade the Forex market with daily charts run into a variety of hurdles. Often these longer term graphs can be deceptive and have traders falling for predictable mistakes. To help combat some of these issues, today we will review three helpful tips for daily chart traders.

    1. Find the Trend

    The first tip for trading a daily chart is finding the trend! One of the benefits of trading the daily chart lies in the long drawn out moves of the Forex market. One way to identify the trend is to look at half a year’s worth of price data, or roughly 180 periods, and then identify the swing highs and lows created by price action. While this number of periods can be moved up or down to your liking, having a reference will keep you from looking at too much price data which substantially increases the difficulty of finding the trend.
    Below is an example of a 6 month trend on the EURAUD. Going back and referencing this price data on a daily chart allows us to identify market direction, while creating a trading bias. If the trend is up, daily chart traders will wait patiently and look for opportunities to buy the market. At no point should we consider trading against the trend.

    Learn Forex – EURAUD 1866 Pip Daily Trend


    2. Remain Patient

    Why go through all the pains of finding a trend, and having a market trading plan if you aren’t going to use it? Daily chart traders need to avoid the bug of having to be in the market now. This can be incredibly difficult especially if you are watching markets on a daily basis. Remember that trading with Daily Candles may only yield one or two appropriate positions on a single currency pair for a whole year. This means staying out of the market and keeping your trading capital free until an opportunity emerges.
    The easiest way to remain patient is to keep a trading journal and join a trading community. In my experience this allows you to hold yourself accountable for following your trading strategy. For instance if you are trading with CCI on a daily chart, such as the example below, your trading journal should only show two entries! If your report is showing something different, it is time to reevaluate your trading plan.

    Learn Forex – EURAUD CCI Entries


    3. Use Larger Stops and Less Leverage

    Traders that are trading on a daily chart should be aware of the larger intraday swings of the market. The main focus for this is to avoid being taken out of the market prematurely. One indicator a trader can use for this is ATR (Average True Range). ATR can help you find the average movements for a pair for a given period of time. Once this value is found, you can use a multiple of ATR to go about setting the Risk/Reward level of your choosing.
    Remember, using larger stops doesn’t mean you have to put more capital at risk. One frame of reference is to never risk more than 1% of your account balance on any one trade. Using this rule traders can still trade conservatively even on a daily chart by limiting their leverage. Even if you are trading with a large or small account balance, if you are having problems with this consider using smaller lot sizes.

    More...

  8. #288
    member ForeCastle's Avatar
    Join Date
    Apr 2013
    Posts
    1,077
    Blog Entries
    236

    Trade Forex With The CCI Indicator

    Talking Points

    • Oscillators can be used to trigger trades with the trend.
    • CCI will help traders evaluate overbought / oversold levels.
    • Entries with CCI occur when momentum returns with the trend.


    When traders need an indicator for planning an entry for a trending market trading plan, normally oscillators come to mind. Oscillators are a class of indicators designed to track price by moving (oscillating) either above or below a centerline. Today we will review CCI (Commodity channel index), which is a popular oscillating indicator and discuss how we can use it to trade retracements back in the trend.

    Learn Forex – CCI Overbought / Oversold


    If you are already familiar with other oscillators such as RSI (Relative Strength Index), you may already be familiar with how to read CCI. Both indicators use a mathematical equation to depict overbought and oversold levels for traders. Pictured above we can see these levels marked with CCI moving between them.

    CCI uses a +100 value to indicator overbought levels, while below -100 value represents an oversold value. It is important to notice that 70-80% of the time CCI values actually tend to fall between overbought and oversold levels. This means traders will need to remain patient while waiting for one of these scenarios to occur. As with other overbought/oversold indicators, this means that there is a large probability that the price will correct to more representative levels. Knowing this, trend traders will wait for the indicator to move outside of one of these points before reverting back in the direction of the primary trend. Let’s look at an example using the strong trend on Gold (XAU/USD).

    Learn Forex – Gold & CCI


    Above we can see an example of CCI in action using a daily graph of Gold, (XAU/USD). Due to the recent strength of the Dollar, and knowing that price the price of Gold has been moving generally lower, trend traders should look to initiate new selling positions. The primary way of timing entries with CCI in a downtrend is to wait for the indicator to move above a reading of +100 (overbought), and enter into the trade when CCI moves back below +100. This creates an opportunity to sell the currency as momentum is returning back in the direction of the trend. Traders should only enter after a full candle close on their chart, thus confirming a reading under the overbought value.

    The above chart shows several past entries on Gold using CCI as an entry mechanism. Currently CCI is reading near its center line, so traders will need to wait for an opportunity to trade wait to trade the next retracement of the commodity.
    ---Written by Walker England, Trading Instructor

    More...

  9. #289
    member ForeCastle's Avatar
    Join Date
    Apr 2013
    Posts
    1,077
    Blog Entries
    236

    Manage Risk Like a Professional

    Talking Points

    • Don’t overlook risk management in your trading plan!
    • Always use a positive Risk/Reward ratio.
    • Never risk more that 1% of your account balance on any give trade.


    While most traders identify planning an entry as the most important step in their trading strategy, it is important to add as much if not more emphasis on risk management. Successful traders always consider managing risk and before we ever place a trade we should consider the outcome of our order.
    To help us better prepare for the upcoming trading year, today we will look at risk management with a focus on risk reward ratios and the 1% rule.

    Learn Forex – GBPUSD with Risk/Reward


    Risk Reward Ratios

    When it comes to risk, it is actually just important to consider how much we are risking relative to how much potential profit we stand to make. This is what traders refer to as a Risk/Reward ratio. Understanding these ratios can help traders avoid trading’s number one mistake, which is risking more relative to a trades potential gains.

    So what does this mean for traders? When measuring your stop loss in pips, you should also use this as a reference when setting your profit targets. Looking at the chart above we see a stop placed on a GBPUSD breakout of 150 pips. This means to setup a 1 to 2 Risk/Reward ratio our limit should be at minimum 300 pips away. While these ratios can be changed for personal preferences, using a 1 to 2 Risk/Reward ratio on every trade means that you only need to be correct 1 out of every2 trades (33% accurate) to be break even, if not net profitable on your trading account.

    Learn Forex – Gold & Dollar Correlation


    The 1% Rule

    While no one wants to experience a loss on their account, it is always important to have a plan of action to limit their drawdown. As well as using a stop, traders should also consider the 1% rule. This means that traders should never risk more than 1% of their account balance on any one trading idea. That means using the math above, if you are trading a $10,000 account you should never risk more than $100 on any one positions.
    The 1% rule can also be coupled with a positive risk reward ratio. Using a 1:2 setting, this means if we risk 1% in the event of a loss, at minimum we should look to close our trades out for a 2% profit. This would translate into a $200 profit on a $10,000 account balance.


    ---Written by Walker England, Trading Instructor

    More...

  10. #290
    member ForeCastle's Avatar
    Join Date
    Apr 2013
    Posts
    1,077
    Blog Entries
    236

    Using Fibonacci Confluences to Time Trend Trade Entries

    Talking Points:

    • Looking For Fibonacci Retracement & Expansions to Meet
    • Fibonacci Confluence within Elliott Wave
    • A Fibonacci Confluence Example with USDCHF


    At first glance, trading appears random. When you pull up a chart for the first time, it’s hard to imagine that there’s any order to the price action. However, over time, you begin to learn that some things like Elliott Wave, Fibonacci, or even simple tools like moving averages appear to bring a method to the madness so that you can build a trading plan.

    Looking For Fibonacci Retracement & Expansions to Meet

    Trend trades often take one of two approaches for entry. The easiest approach as claimed by Richard Donchian of the Donchian channels is buying breakouts in the direction of the trend. While a very good approach for low-leverage traders, entering on major breakouts don’t always play out as you’d wish.

    Learn Forex: Breakouts Don’t Always Follow Through


    A more difficult approach that is often favored by experienced traders is to enter on trend corrections. Entering on a trend correction requires a bit of a steady hand along with a few key tools to help you align your entries with technical precision. A tool that traders who utilize Elliott Wave or who are just of fan of Fibonacci will initially learn to use Fibonacci Retracements.

    Learn Forex: Fibonacci Retracements Help You See Where a Correction May End


    On the GBPUSD chart above, you can see multiple levels of retracements. The general rule when looking for entrances off a retracement is that the strong the prior trend, the less the underlying market will retrace the move. The stronger trends like we see in GBPUSD since July will usually only retrace 23.6% or 38.2%. The newer, less defined impulses, will often retrace a good deal more such as the 61.8% or 78.6% retracement.

    The general rule is that when you see price action of the retracement begin to weaken around a Fibonacci Retracement level that can be a sign to enter back in the direction of the prior trend. As an Example, if a currency traveled 100 pips higher in an uptrend and then retraced 38 pips but you saw a lack of thrust beyond the 38 pip retracement, that can be an opportunity to enter in the direction of the original trend at an attractive price.

    The difficulty of this strategy typically develops when traders aren’t sure whether price action is weakening or not. This is when traders will look deeper into the correction by turning to Fibonacci Expansions. The purpose of a Fibonacci Expansion is to use key turning points of a prior move to see when either a correction or impulse may run out of gas as governed by a Fibonacci relationship. Naturally, when the Fibonacci expansion off of a corrective move meets a Fibonacci retracement of a prior impulse, you may be looking at a special set-up.

    Fibonacci Confluence within Elliott Wave

    Learn Forex: Fibonacci Confluence with GBPUSD


    A majority of correcting patterns are made out of 3-waves and impulses are made of 5-waves. The common Fibonacci expansion relationships for the 3-wave or 3-move correction is that the last leg will either be 61.8%, 100% , or 161.8% of the first corrective move. The bread and butter is when the last leg, known as the c-wave, hits 100% of the first leg, which is known as the a-wave. This development recently took place on the GBPUSD but that move already played out so it’s time to look for the next opportunity.

    A Fibonacci Confluence Example with USDCHF

    We know now that Fibonacci confluence is when the retracement of a prior impulse and the expansion of a correction meet near each other. While this doesn’t guarantee a profitable trade, it does try and put the odds of your trading edge in your favor. As the taper nears and US data is beginning to tick up showing that QE has temporarily helped the US Economy, a few USDOLLAR long opportunities begin to emerge.

    2014 Trade for USDCHF Based on Fib Confluence


    USDCHF has a confluence of the 38.2% Fib retracement at 0.8860 which is where are now based on the 8/2011 low and 7/2012 high. The current leg labeled “c” on the chart above is the 100% expansion when you connect the three points from the 7/2012 high, 1/2013 low, and 5/2013 lower high. The first confirmation of the move higher would be on a break of 0.9250. Based on a prior price action, a target for Q1 2014 could be around 1.0000.
    Happy Trading!

    ---Written by Tyler Yell, Trading Instructor

    More...

Page 29 of 43 FirstFirst ... 19 27 28 29 30 31 39 ... LastLast

LinkBacks (?)

  1. 10-09-2013, 09:11 PM

Tags for this Thread

Bookmarks

Posting Permissions

  • You may not post new threads
  • You may not post replies
  • You may not post attachments
  • You may not edit your posts
  •