
 10Likes
 LinkBack URL
 About LinkBacks


Article Summary:The Average Directional Index (ADX) rates how much a currency pair is trending on a scale from 0 – 100. A pair moving sideways shows an ADX level below 30 while a trending pair shows an ADX level of 30 or higher. Keep in mind that the ADX is directionally neutral, meaning it does not indicate a bearish or bullish trend, only if a trend exists or not.
What it the ADX?
The ADX is displayed as a value between 0-100 where the higher the ADX value, the stronger the currency pair is trending.
Learn Forex: The Average Directional Index (ADX)
You can see in the image above that the ADX looks very similar to popular oscillators like the Relative Strength Index or Commodity Channel Index, but understand that the ADX is directionally neutral. So a higher value does not represent a pair as bullish nor does a lower value represent a pair as bearish. A higher value means the pair has been trending (either up OR down) and a lower value means the pair has been moving sideways.
How Do You Read the ADX?
The ADX will be a value between 0 - 100. Typically, traders will look for an ADX above 30 to confirm that the currency pair is trending either up or down. Any value below 30 would mean a pair has been moving sideways and trend based systems should be cautiously used or completely avoided. Let us show you a real life example.
Below is a strategy using a Simple Moving Average crossover of the 50 and 20 period on an Hourly chart of the EUR/USD. The rules of the strategy are easy, buy when the 20 period crosses above the 50 period, and sell when the 20 period crosses below the 50 period.This crossover strategy thrives in trending markets but suffers in ranging markets.
Learn Forex: Simple Moving Average Crossover (No Trend Filter)
You can see that some of the trades were very good, while many of the other trades were not. Ideally, we would like to avoid trades taken during sideways markets and the ADX does exactly that.
Using the same Moving Average Strategy on the next chart, I am going to filter out all trades where the ADX was below 30, and keep all the trades that occurred when the ADX was above 30. This will ensure I am only taking trades when the pair is trending according to the ADX. I've highlighted the ADX +30 areas when a cross occurred to make the image clearer.
Learn Forex: Simple Moving Average Crossover (With Trend Filter)
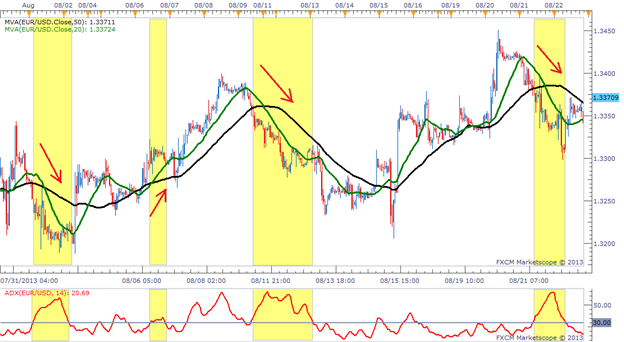
The signals that occurred while the ADX was above 30 were much more reliable. We took out all of the trades where the EURUSD was moving sideways and only opened trades during the long trending moves up or down. You might have also noticed that some of the winning trades were filtered out along with the bad trades, but this is ok. Overall, we cut out more losing trades than winning trades so it was an overall positive filter to this trending strategy.
Filtering Towards Success
It's good to understand your trading strategies' strengths and weaknesses, but it's even better to know how to use this information to filter out bad trades. If you are using a trend trading system, definitely take a look at the incorporating the ADX indicator. The combinations are unlimited.
Good trading!
---Written by Rob Pasche
More...


 Reply With Quote


Bookmarks