Page 21 of 43 FirstFirst ... 11 19 20 21 22 23 31 ... LastLast
Results 201 to 210 of 430
Like Tree6Likes

Forex Strategies

This is a discussion on Forex Strategies within the Trading Systems forums, part of the Trading Forum category; “The monetary policy of the United States has a major impact on global liquidity and capital flows and therefore, the ...


  1. #201
    member ForeCastle's Avatar
    Join Date
    Apr 2013
    Posts
    1,077
    Blog Entries
    236

    Here’s Why A Dovish Fed Drove The USDOLLAR to 3-Month Lows

    “The monetary policy of the United States has a major impact on global liquidity and capital flows and therefore, the liquidity of the U.S. dollar should be kept at a reasonable and stable level.”
    -Hu Jintao, Former President of China

    Monetary Policy and therefore interest rates are the most likely mover of the currency markets. Therefore, it’s important to know what specifically it means when the central bank of a currency is said to be dovish and how that can help you trade the FX market going foreward

    • What is meant by a Dovish Central Bank
    • What is meant by a Hawkish Central Bank
    • How You Can Trade Either Scenario


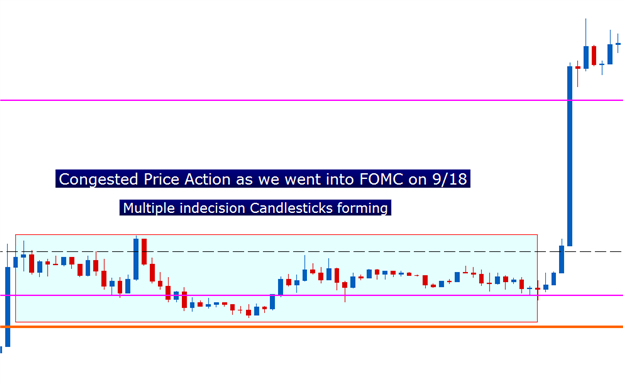
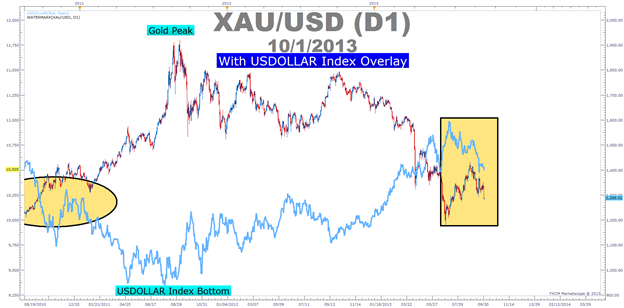
    Around 1400 ET on September 18, 2013 in what could have been Ben Bernanke’s last public appearance as Fed Governor since taking the role in 2006 we were informed that the Fed has taken a more Dovish stance. This sent the USDOLLAR falling against every currency in the world including the uber-weak Japanese Yen.

    This in turn sent interest rates like the 10-year treasury lower as well which can be a proxy for currency strength and the currencies respective borrowing rates.

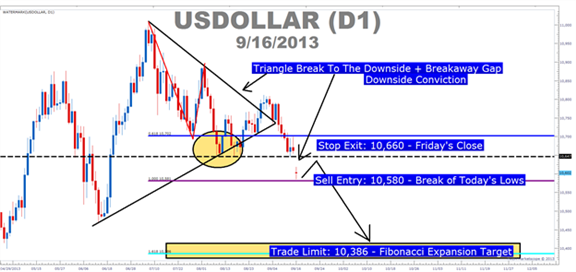
    Taken from the article, The USDollar Bearish Breakaway Gap


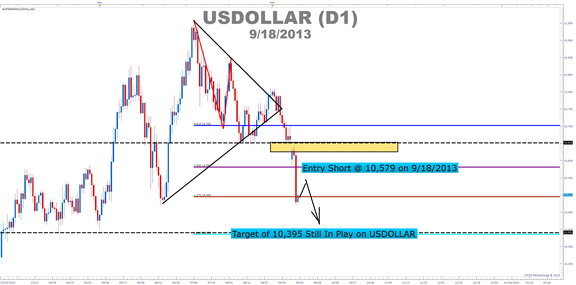
    Learn Forex: Dovish Move By Fed Dropped USDOLLAR Quickly


    What is meant by a Dovish Central Bank

    A dovish central bank, which gets its namesake from a safe and docile bird, has a few main goals that you should always keep in mind that is to revive or jumpstart the economy after a slump. First, by keeping interest rates low they allow money to move freely within the economy, which allows the economy to hopefully pick itself up by its bootstraps. Secondly, a dovish central bank like the US Federal Reserve currently is labeled as takes on different means of stimulating the economy like buying up underwater or underperforming assets on a banks balance sheet that in turn hold the banks back from operating at full speed. This second type of stimulus is known as Quantitative Easing or QE.

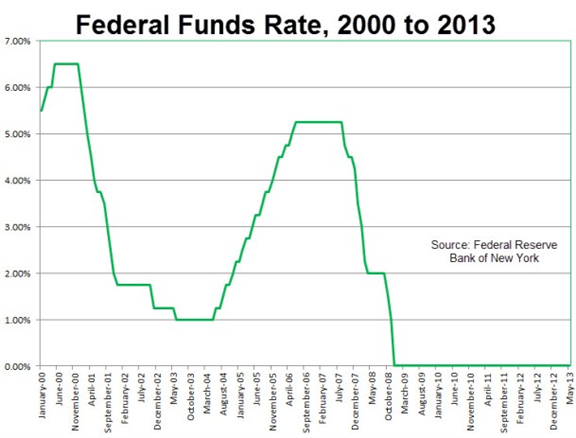
    Learn Forex: Interest Rates of the FED Since Jan 2008


    Source: Federal Reserve Bank of NY

    Today, the Fed said it needs more economic evidence before adjusting the bond buying program or QE. In simple supply and demand terms, this means that USDOLLAR Supply is over flowing which assisted the USDOLLAR weakness seen earlier today as the EURUSD moved higher 200 pips to 1.3539 while USDJPY tests multi-week lows near 97.80.

    The current dovish Fed also said that until the data shows a marked improvement that a reduction in their dovish stance will not falter. This data dependent view further shows that the Fed is looking to a rebound in the job market and consumer sentiment before considering a move to a hawkish standpoint.

    What is meant by a Hawkish Central Bank

    A hawkish central bank, which gets its namesake from the predatory and unsympathetic nature of the hawk bird, has a few main goals that strive to prevent an economy from overheating likely due to their prior dovish stance. A hawkish central bank is likely less concerned with economic growth than with pressure brought about by the high inflation rate that can spin an economy out of control.

    Last week, the Reserve Bank of New Zealand or RBNZ took the most hawkish stance among the developed economies as they provided a timeline for raising the central bank rate to prevent inflation from getting out of hand in their improving economy.
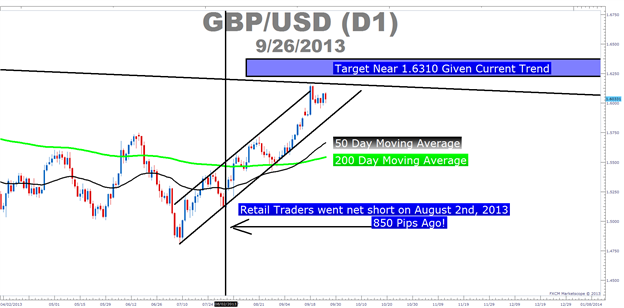
    Other Central Banks that are on the verge of showing a hawkish bias after improved economic data is the Bank of England, which naturally has brought the GBP near the top perform major currencies along with the New Zealand Dollar.

    How To Trade A Hawkish or Dovish Central Bank

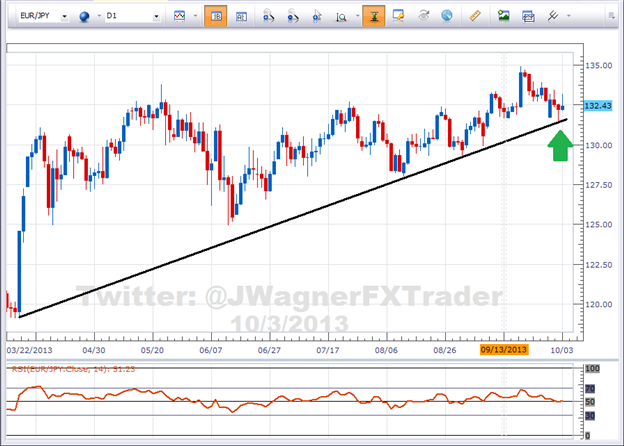
    As a Forex trader, you naturally want to try and identify a relatively hawkish central bank like the Bank of England for the GBP or the Reserve Bank of New Zealand for the New Zealand Dollar. After you’ve done that you can next find a Dovish Central bank like the Federal Reserve for the US Dollar or the Bank of Japan for the Japanese Yen. Naturally, the hawkish currency will generally appreciate on the FX market compared to other dovish currencies that are diluted via inflation.

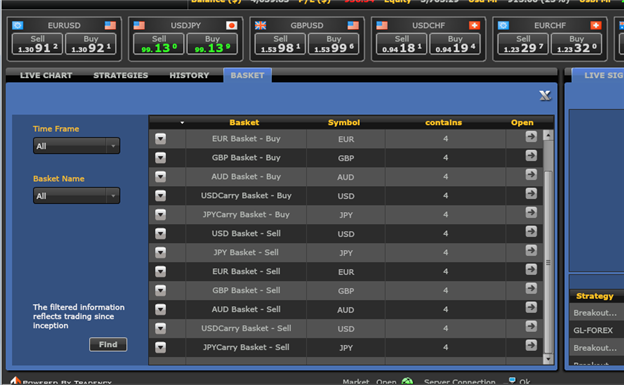
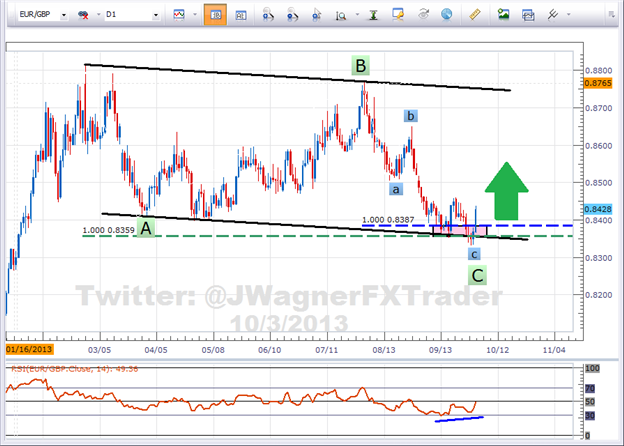
    Learn Forex: Once A Central Bank Intention is Made Know, Look to Baskets


    Another option if you’ve clearly identified a hawkish or dovish central bank is to trade a currency basket. A currency basket allows you to trade a single currency against a host of other currencies so that you can either buy or sell that currency based on the Central Bank’s intentions for that currency. Therefore, a newly hawkish currency with rising interest rates should be sought to buy that currency basket and a dovish currency with low interest rates should be sought out to sell that currency against others, as it is likely to fall like the US Dollar did today.

    Happy Trading!

    ---Written by Tyler Yell, Trading Instructor

    More...

  2. #202
    member ForeCastle's Avatar
    Join Date
    Apr 2013
    Posts
    1,077
    Blog Entries
    236

    The Most Important Price Action Formation is Indecision

    Article Summary:

    • Traders can use price itself to grade trends, find support and resistance, and trigger trades.
    • Traders are best served by utilizing advantageous risk-reward ratios.
    • Price Action formations can be combined with trends or biases to look for situations in which the trader may be able to buy cheap, or sell expensive.


    Has the trend exhausted? Is there any more of the move left for me to get in? Or is this a reversal setup? These are all questions that run through the trader’s mind like locomotive on a tight schedule.

    And there is one, single, solitary factor that makes all of these questions worthless expenditures of energy:
    ‘You will never be able to tell the future.’

    While this may sound defeating, and it may even sound discouraging to some; this is simply the truth. No human being can forecast the future.

    But, our inherent job as a trader is to speculate on those potential outcomes. So, we have to use analysis in an effort to try to forecast future price movements to try to get the probabilities in our favor as much as we possibly can.

    In this article, we’re going to look at how price action can show indecision in a variety of formations; and then we’ll go on to show you how these situations can be traded.

    What is the Most Important Price Action Formation?

    The most important formation that traders can find is an allusion of indecision. There are a lot of different formations that can signal indecision. The easiest and probably most well-known indecision formation is the doji, as we looked at in the article, Candlestick Confessions – The Doji:

    The Doji has a skinny candle body, with wicks on either side


    The logic behind the indecision shown in the market during the formation of a doji may seem simple: While this candle was forming, traders moved prices higher, and they moved prices lower; but in the end – price ended up very close to where it started.

    But what if price didn’t end up so close to where it started?

    Well, that’s indecision too – and that’s a candlestick formation that can be used by the trader.
    The Spinning Top is like a Doji, but with a wider candle body:


    This shows indecision, just like the doji with the exception that prices put in more significant movement during that candle period.

    But also related to indecision candlesticks are various flavors of Dojis:
    The Long-Legged Doji has a skinny body with long wicks on either side of the candlestick body:


    The Gravestone Doji has a skinny candle body at the bottom of a long wick


    The Dragonfly Doji has a skinny candle body at the top of a long wick


    Why are these formations so important?

    The very sign of indecision signals the potential for opportunity to the trader, and this is why these formations are the most important price action inflections you can find.
    But these formations absolutely cannot be traded in a vaccum. Meaning, there isn’t necessarily a trade there just because a long-legged doji just printed. Rather, these indecision candlestick and formations need to be taken with context.

    Traders can utilize price action to find trends, as we looked at in The Introduction to Price Action. And once the trend is found, traders can look at the chart with a bias in that direction.

    Trend Diagnostics as performed with Price Action


    The trend is important because this is the most current bias in the market. That bias may be because of a fundamental catalyst, like a Central Bank Announcement; or it could be a technical event, but whatever the reason, the goal is the same: To take advantage of any prevailing biases that may exist in the market.

    Once the trend is found, it is time to get to work.

    How to Trade Price Action Indecision

    While a doji, or spinning top can be great signals of indecision, they can also be very lousy timing indicators. So, once again, please do not enter a position SOLELY because an indecision candlestick printed on the chart.
    Rather, look for the direction of the trend, and look to trade only in that direction. If the trend is up, and a doji prints, that means that we may be in the initial stages of a retracement. That retracement may last for one hour, one day, or one month – but this will often bring multiple indecision candlesticks on the shorter time frame.

    Multiple Indecision Candlesticks may form during congested periods in the market


    Once the congestion or retracement has been seen, this can offer the trader support and/or resistance points so that the stop can be placed properly, as outlined in How to Identify Positive Risk-Reward Ratios with Price Action.

    From there, the trader can look for advantageous risk-reward ratios so that when the congestion breaks, and if the trend resumes, wins can bring in far more pips than the trader risks when getting into the position.

    -- Written by James Stanley


    More...

  3. #203
    member ForeCastle's Avatar
    Join Date
    Apr 2013
    Posts
    1,077
    Blog Entries
    236

    Strong & Weak: Euro Spurts and Maintains Strength

    Talking Points:

    -Stronger currencies (British Pound [GBP] and Australian Dollar [AUD]) have entered into a multi-year resistance zones
    -US Dollar moves lower after Fed meeting, but retraces most of resulting weakness
    -Euro (EUR) gains on Fed meeting and holds onto those gains to finish the week strong – entering the EUR Basket Buy Trade

    Last week, we highlighted how the British Pound strength has been holding up for several weeks in a row. As you can see below, the GBP is ranked as the 3rd strongest currency and that strength continued into the Fed meeting on Wednesday which helped our GBP buy basket trade.

    However, the GBP has strengthened enough push into 4 year resistance on the GBPUSD chart. As written last week, “I will abandon the bullish bias on the Pound if the GBPUSD exchange rate trades up to 1.6000.” Therefore, be on the lookout for Pound weakness.
    Additionally, the Australian Dollar revisited a former breakout level near .94 to.95. This zone was previously supported by swing lows in October 2011 and June 2012. A common pattern in technical analysis is when former support, when broken, often acts like new resistance.
    Even though the AUD ranks as the 2nd strongest currency below, the recent move back into the resistance zone puts the AUD is at risk of losses for the coming week.

    Forex Strategy: Matching Strong versus Weak

    Currency Up Arrows Down Arrows Change From Last Week
    NZD 7 Higher1 rankings
    AUD 6 1 Lower 1 ranking
    GBP 4 3 Lower 1 rankings
    CHF 4 3 Higher 4 rankings
    EUR 3 4 No Change
    USD 2 5 Lower 1 ranking
    CAD 2 5 Lower 2 rankings
    JPY 7 No Change


    The Federal Open Market Committee decided this past Wednesday not to taper the purchases of treasury securities and mortgage backed securities. As a result, the US Dollar immediately sold off. However, by the end of the week, the USD began to recover a good portion of those losses.

    Additionally, the USDOLLAR briefly spiked below the 200 Day Simple Moving Average, then rebounded higher. The USD price action towards the end of the week has me thinking the bearish spike on news may be the last leg of the recent bear trend. We will let that thought simmer and will revisit the potential for USD strength towards the end of the week.

    The currency trade opportunity for this week rests with the Euro. As the USD was rebounding, the Euro wasn’t backing down. As a result the EURUSD pair finished the week on its highs. Also, when looking at the EURUSD weekly chart, there is a cluster of resistance in the 1.3750-1.3850 range. Therefore, this indicates to me that although the USD may perhaps find support, the EUR still has room to run higher against the USD.

    When wrapping this altogether we have:

    -potential for AUD and GBP weakness
    -the EUR finishing the week on its highs against the USD
    -EURUSD potential exchange rate movement to 1.3750-1.3850

    Therefore, the EUR buy basket trade seems to have a good opportunity. Trading a currency rather than a pair is a good way to spread out and diversify your exposure. This way, we are buying the EUR against a basket of currencies allowing us to isolate the valuation of the EUR.
    Good luck with your trading!

    ---Written by Jeremy Wagner, Head Trading Instructor, DailyFX Education


    More...

  4. #204
    member ForeCastle's Avatar
    Join Date
    Apr 2013
    Posts
    1,077
    Blog Entries
    236

    Using Price Action to Catch Swings in the Forex Market

    Talking Points:

    • Traders can use price action to look for trade-able setups in the Forex market.
    • Price Action can show which setups the trader may be able to utilize to buy up-trends cheaply, or to sell down-trends expensively.
    • Traders can use Multiple Time Frame Analysis to get more granular and exacting with their entries in consideration of longer-term trends.


    Prices in the Forex market are often driven by fundamental catalysts and events. A good example of this was last week’s Federal Reserve Open Market Committee meeting, in which Mr. Ben Bernanke didn’t deliver the tapering of Quantitative Easing that so many in the market had come to expect.

    The difficult part about such fundamental catalysts is that, for the most part, they are unpredictable. And further, even if we could foretell their occurrence, even then – we wouldn’t know exactly how the market would price in that information.

    Quite simply, traders need a better edge in the market than ‘guessing’ that a certain event may take place, and ‘hoping’ for the best.

    This is where Price Action can come in. Price Action or the study of how traders have moved prices in the
    past can bring quite a bit of value to the trader’s approach. Price Action can show which trends are strongest; and from there – traders can use this information to plan and plot trades.
    Use Price Action to Locate the Strongest Trends

    The reason for trading trends may sound very logical, yet many new traders are reticent of doing so. In most new traders, the desire to fade those trends is often much more prevalent than the aim to ride with them. This could not be more wrong; and the reason for that is the central theme of trading:
    ‘You will never be able to predict the future.’

    The goal with trading with the trend is to simply look for any prevailing biases in the market, and looking for them to continue. The picture below will illustrate why this can be so valuable:


    As you can see in the chart, a nice up-trend had set hold in the market. In general, most new traders will look to go short in these situations, looking for a reversal to come into the market. The Speculative Sentiment Index will usually show as such, with increasing number of retail traders getting short as this up-trend continues to get priced into the market.

    But this logic is all wrong.
    This up-trend is taking place for a reason. Perhaps it’s in anticipation of a fundamental event (such as FOMC last week saw USD weakness well in advance of the announcement); or maybe it’s because of some technical event.

    But the ‘whys’ are far less important than the ‘what’ in this situation.
    The way the trader needs to look at this situation is that, at any moment in time, the price in the market is a fair price with which buyers and sellers are meeting to transact business. Future prices may drive higher or lower, and that’s unpredictable; but by simply looking at the recent trajectory of prices, traders may be able to get on the side of the bias in the market by trading in the direction of the trend.
    But, it’s not enough to just buy in an up-trend, or sell in a down-trend. As traders, we want to be more calculated in our approach.

    Traders can use Multiple Time Frame Analysis to Find Entry Opportunities
    The difficult part about trading trends for many traders is that it can appear daunting to buy when prices are higher than they were previously (which is, after all, an uptrend). This is why so many traders embark on counter-trend operations, because it looks more logical to ‘buy the dip’ against a down-trend, or to ‘sell the rip’ against an up-trend.

    But again, there is a reason that trend came into the market place; and whatever that reason may be, the trader wants to look to take advantages of these biases as opposed to getting taken advantage of.
    This is where Multiple Time Frame Analysis comes in.
    The trader can observe the trend on a longer time frame, and then can use a shorter time frame to look for an entry opportunity. For example, if the trader sees a strong up-trend on the daily chart, they can use the 4-hour chart to look to buy that up-trend cheaply.

    Or perhaps the trader wants to take a shorter-term view on the market. They can use the hourly chart to grade trends, and the 5 or 15 minute chart to look for entry opportunities in consideration of those trends. This is similar to the fingertrap trading strategy that I teach in the DailyFX PLUS Live Classroom.
    The trader can use time frames to suit their goals; the table below was given in the article, The Time Frames of Trading, and can show traders which time frames they want to use based on their desired holding-time/trading style:

    Time Frame

    Intervals for Multiple Time Frame Analysis; from The Time Frames of Trading
    On the Shorter Time Frame, Traders Can Use Price Action to Look For Entries
    After the trend has been observed on the longer time frame, the trader then knows if they want to buy or sell in consideration of that trend.
    Traders can look for periods of price action indecision on the shorter time frames to indicate potential entries in the direction of the longer-term trend, as we outlined in the article, The Most Important Price Action Formation is Indecision. A good example of ‘Indecisive Price Action’ is the Doji formation; although there are numerous additional formations that can signal indecision.
    In the picture below, we’ve gotten more granular with the trend we investigated earlier in this article.
    Created with

    In the above graphic, we’ve taken a more detailed look at the trend from the previous image. Once again, the general trend was strong and to the up-side, so traders want to look for opportunities to buy.
    On the chart above, we can see where a retracement in the up-trend took place (highlighted by the red box). Shortly after the retracement sets in, a Spinning Top candlestick formation forms that highlights indecision on the shorter-term chart (this is one of the candlestick formations shown in The Most Important Price Action Formation is Indecision).
    The trader can look to enter upon the formation of the spinning top, under the premise that a short-term low may have been made in the market, and the up-trend witnessed on the longer-term chart may come back.

    The Most Important Thing for Traders to Look to on This (or any) Strategy
    Once again, traders have to assume the future is uncertain. By trading in the direction of the trend, the trader is looking for the bias that’s been witnessed in the market to continue, which may or may not take place.

    So it’s of the upmost importance the traders look to use favorable risk-reward ratios. The reason is because of that uncertain future, and the fact that not all trends will continue.
    This way, even if prices are perfectly efficient at the time of entry (meaning all known information is factored in); and even if traders are getting only a 40% success rate in the markets; they can still look to be profitable on balance.

    We examine this theory in-depth in the article, How to Identify Positive Risk-Reward Ratios with Price Action.
    The Number One Mistake that Forex Traders Make is faulty risk-reward ratios. And this is the same type of thinking that gets new traders to fade the strongest trends in markets; the ‘hoping’ and the ‘guessing’ that brings on so many ill effects to the new traders approach.

    -- Written by James Stanley

    More...

  5. #205
    member ForeCastle's Avatar
    Join Date
    Apr 2013
    Posts
    1,077
    Blog Entries
    236

    Think About Your Trade Size Like A Pro

    “Even unlikely events must come to pass eventually. Therefore, anyone who accepts a small risk of losing everything will lose everything, sooner or later. The ultimate compound return rate is acutely sensitive to fat tails.”
    -William Poundstone, Fortune’s Formula

    “Any good investment, sufficiently leveraged, can lead to ruin.”
    -Edward Thorp, Old Pros Size up the Game, Wall Street Journal

    Talking Points:

    • As a Trader, You should be concerned with Survival over Instant Wealth
    • Manage the unmanageable with your trade size
    • Why the 2% rule has stood the test of time
    • Theory of Runs encourages you to limit exposure


    Before you become a trader, you likely often thought that if you could just figure out a decent entry system then you should be well on your way to hitting your trading goals. However, when your money is in the account and you’re looking for a trade, you’re faced with a large part of the discretionary trader’s dilemma of trying to grow as wealthy as possible as quick as possible or trying to grow your account with a limited amount of risk.

    Learn Forex: Even If You Think Your Trade Is Going to the Moon, Limit Your Trade Size


    You should be concerned with Survival over Instant Wealth
    There is a great quote in seminal book, Market Wizards when Jack Schwager interviews Hedge Fund Manager Larry Hite who simply says, “If you don't bet, you can't win. If you lose all your chips, you can't bet.” (Emphasis mine). This quip should alert you that if you talk to fund managers or long term traders, they’ll likely focus more about their money management program than their signals. Quite simply, this is because they know that the market will definitely move but are smart enough to tell you that they would never bet all their money on which way it is expected to move.


    Instead of focusing only on the best indicator, professional traders and money mangers know that what will allow them to raise the next million or billion to manage is by showing prospective investors that their losses have been kept under control through thick and thin. I recommend that you trade like you hope to one day raise capital to manage and think about the fact that traders want to know two things. Did you make money and if so and they’re still in your presence, were you able to pull off this feat without risking your entire bankroll?

    Manage the unmanageable with your trade size

    Another concept that may be helpful to wrap your mind around is that trade size is the ultimate insurance as a trader. In other words, even you make the worst trade imaginable and buy at the top only to sell at the bottom your trade size will determine the relative amount of pain you will feel from your poor entry. Therefore, even though the market is full of opportunity that appears endless, it is still helpful to control your risk and exposure with your trade size because in the end you don’t know exactly where the market will end tomorrow even though you have an edge via a technical trading strategy or other tool.

    The Theory of Runs & The reason the 2%-5% rule has stood the test of time

    One of our best tools that can keep you humble in your trading is the Speculative Sentiment Index. The SSI shows you how many traders are loaded up on one side of the trade which all too often is against the overall trend. This is quite disappointing but it’s key to understanding that traders have an internal desire to sell high even if the trade continues going higher.

    Learn Forex: Traders Often Push Their Luck against the Overall Trend


    Take a moment and think on this question for a moment. Given your most common trade size in relation to your current account balance, how much would your account be down if you had 5 or maybe even 10 consecutive losses. This question is based on the Theory of negative runs as a mental exercise and if the answer is that your account would be down by greater than 20%, then you may need to be limiting your trade size.

    Please note, limiting your trade size doesn’t mean you’re a bad trader. On the contrary, limiting your trade size means that accept in advance that you don’t know exactly how the trade will turn out and you’re being proactive in making sure that you’re around for the next trade next week, month, or year. To recap the introducing quote to this article, “Any good investment, sufficiently leveraged, can lead to ruin.”

    Lastly, I’ll leave you with this helpful chart that shows you why you should limit not only your trade size but your losses. Large losses leave you with a daunting task ahead of attempting to break even before you can break ahead. The best way to get an edge is to do so in terms of trade size so that you’re not playing the game at a distinct disadvantage of having to recoup major losses.


    ---Written by Tyler Yell, Trading Instructor

    More...

  6. #206
    member ForeCastle's Avatar
    Join Date
    Apr 2013
    Posts
    1,077
    Blog Entries
    236

    Stong & Weak: Australian Dollar Weakness in Focus

    Talking Points:

    -AUDUSD gets rejected at .95 horizontal resistance hinting at future Aussie weakness
    -US Government spending debate and RBA rate decision may provide a catalyst for Aussie weakness
    -Enter the AUD sell currency basket while keeping the Euro (EUR) buy currency basket open

    When comparing a currencies general trend against their 200 Simple Moving Average, this past week has seen the Australian Dollar drop two rankings. This drop represents a tie for the largest in the week (tied with the US Dollar).

    Based on structural weakness seen in the Aussie and a rejection of the AUDUSD pair at the significant .95 price level, we think Australian Dollar weakness will return to the market.

    Forex Strategy: Matching Strong versus Weak

    Currency Up Arrows Down Arrows Change From Last Week
    NZD 6 No Change
    CHF 6 1 Higher 1 ranking
    GBP 4 3 No Change
    EUR 4 3 Higher 1 rankings
    AUD 3 4 Lower 2 rankings
    CAD 2 5 No Change
    JPY 2 5 Higher 1 ranking
    USD 7 Lower 2 rankings


    There are a couple of news events that could spark a large move in the Australian Dollar.
    First of all, US lawmakers are debating spending bills that if left undecided, could lead to a partial government shutdown of services. Then, US lawmakers have to additionally negotiate the debt ceiling on the US spending. This leads to uncertainty because more heat is being placed on the US economy to slow down the spending. This could impact other main world markets in Europe and Asia due to the size of the US economy.

    Australia fits into this equation because they have strong ties with the Chinese economy. China is the biggest export destination of Australian goods. China is the largest importer into Australia. If the US economy reduces their spending, then China has less foreign demand for their products which affects their pull into Australia.

    Secondly, Australia’s central bank, the Reserve Bank of Australia, releases their announcement on target interest rates Tuesday at 04:30 GMT. The RBA has been in a rate cutting mode for nearly 2 years now due in part to China’s slowing economy. Though the recent Fed ‘no taper’ announcement may lift emerging markets like China, the no taper signal indicates weakness still persists and that inflationary pressure may be tamed in US and China. Weak Chinese inflation means downward pressure on Australia inflation and rates.

    Learn Forex: Austalian and Chinese CPI Correlation


    Notice in the chart above how inflation has remained muted in both China and Australia even on the heels of the Fed’s QE3 announcement from September 2012. All of that money printing didn’t improve much of the worldwide spirits and spending. Therefore, look for the positive effects of ‘no taper’ to wear off which could hurt the value of the Australian Dollar.

    Executing the Trade

    Last week, we highlighted Euro strength and purchased Euro’s through a basket of currencies. The position was slightly underwater but never hit the stop loss of 1.5%. We will keep that Euro buy currency basket trade open.

    This week, we’ll add a short AUD currency basket trade. The stop loss will be 1.5% of the account balance and we’ll take profit at 3.0% for a 1:2 risk-to-reward ratio.

    The currency baskets offer several advantages. Trading a currency rather than a pair is a good way to spread out and diversify your exposure. This way, we are selling the AUD against a basket of currencies allowing us to isolate the valuation of the AUD.

    Good luck with your trading!

    More...

  7. #207
    member ForeCastle's Avatar
    Join Date
    Apr 2013
    Posts
    1,077
    Blog Entries
    236

    How to Trade Double Tops and Double Bottoms

    - Forex double top price patterns usually occur after an uptrend and illustrate buyer exhaustion
    - Forex double bottom patterns usually occur after a downtrend and reflect seller exhaustion
    - Profit objectives and stops can be easily place on these patterns

    Forex double tops are very popular among traders as they signify a successful test and price rejection from a recent new high. Found in an uptrend, the forex double top pattern consists of a run up in price to a new high and then followed by a pullback and then a retest of that previous new high. Usually, the following rally stops at or near the exact price of the previous high. In some cases, a slightly lower low is made as buyers run out of strength.

    Learn Forex: Double Top Price Pattern


    Notice in the example above, the uptrend makes a new high and then pulls back to a level of support. Forex traders will recognize the letter “M” shape pattern formed by the forex double top pattern. As bulls take back control of the market and buy the dip in price, they push price back up toward the old high. Unable to push price back above the old high, sellers give up and prices begin to fall back to support.

    Traders should then wait for price to close below the previous level of support to confirm that the pattern is truly a forex double top. Entering short with a stop above the previous high and a profit target equal to two times the stop distance is a solid way of trading this reliable pattern.

    On the other hand, the forex double bottom chart pattern is found at the end of a downtrend and resembles the letter "W". Price falls to a new low and then rallies slightly higher before returning to the new low. Unable to push price to a new lower low to continue the downtrend, sellers give up and price bounces sharply from this area.

    Learn Forex: Double Top Price Pattern


    The retest of the previous low point and the subsequent rebound confirm that this was a very strong level of support. Buyers have confidence in trading the currency pair long because the odds of price reversing is now much less. Aggressive traders may place waiting buy orders at or near the previous low in order to catch an early move higher. While more conservative traders will wait for a close above a trend line to confirm the pattern.

    The double bottom can be a fast moving pattern so traders will want to see price rally after a few bars. After entering long into the market, traders will place a protective stop a few pips below the lowest low of the pattern and a limit equal to twice the size of the stop.

    Very few patterns clearly illustrate the reversals in market direction like the forex double top and forex double bottom patterns. It is important to always use a protective stop when trading and waiting for confirmation of the pattern to filter and reduce the number of pattern failures that can happen.

    ---Written by Gregory McLeod


    More...

  8. #208
    member ForeCastle's Avatar
    Join Date
    Apr 2013
    Posts
    1,077
    Blog Entries
    236

    Intermarket Analysis & Ichimoku both have a dire view for Gold

    “Gold Won't Bottom Until the Faithful Are Washed Out”
    -Jim Rogers, Legendary investor

    Talking Points

    • Gold & The US Dollar Have Recently Joined Forces In Directional Bias
    • Ichimoku Shows that the Gold Correction From July & August May Be Over
    • Price Targets on Ichimoku Gold Trade


    Most often, traders who enjoy analyzing markets begin to venture into Intermarket analysis as a way to beef up their analytical skills. When studying relationships across different asset classes, there is one inverse relationship that most traders learn first. That is the inverse relationship between Gold & The US Dollar.

    Learn Forex: US Dollar & Gold’s Inverse Relationship Has Temporarily Ended


    The relationship between currencies and other markets likes stocks, bonds, & commodities is an indirect albeit very important relationship. In short, the dollar’s influence on commodities like Gold is due in large part to the fact that gold is priced in the US Dollar. Therefore, a falling dollar price pushes commodity prices higher most of the time.

    As you can see on the chart above, we’re started to get a breakaway from the normal relationship as Gold has been moved lower with the dollar since late August. This is negative for gold in that the relationship is still expected to hold that when the US Dollar rises from the expected taper that Gold being priced in Dollars will drop in value. The other relationship that traders expect to hold up is that commodities will lead stocks and commodities of head in the same direction with commodities outlasting a bullish stock market. That relationship has also broken down with Gold.

    Learn Forex: Stocks & Gold Are No Longer Treading In the Same Direction


    As things currently stand, it appears from looking at the divergence of different asset classes that most available money is currently in stocks. This appears to show the Gold is no longer the attractive option in the current market and that you should likely look for Gold to continue moving lower given the currently view of the US Dollar moving lower as well as trend continuation of the SPX500 and other global stock markets.

    Ichimoku Applied To the Current Gold Move

    Ichimokuis a technical tool that can help you make sense of trends in the market. Gold has confused a lot of people as it slumped through the beginning of 2013, corrected a bit higher before slumping again this morning. A break below this morning’s lows on Gold of 1282 will have me looking at a re-entry to sell Gold as per Ichimoku’s lagging line breaking below the cloud which currently act as Gold’s last line of support.

    Ichimoku Trade of the Week: A Break below 1282 Will Trigger an Ichimoku Sell Signal


    Ichimoku Trade: Sell XAUUSD Based on Lagging Line Breaking Below Cloud
    Stop: 1,375 (Price Action High post-FOMC Dollar Sell-Off)
    Limit: 1,180 (June 2013 Low)

    If this is your first reading of the Ichimoku report, here is a recap of the traditional rules for a sell trade:
    -Price is below the Kumo Cloud
    -The trigger line (black) is below the base line (light blue) or is crossing below
    -Lagging line is below price action from 26 periods ago (bright green line)
    -Kumo ahead of price is bearish and falling (red cloud = bearish Kumo)
    -Entry price is not more than 300 pips away from base line as it will likely whip back to the line if we enter on an extended move.

    Ichimoku is best used to spot good entries in the direction of a strong trend. On the chart above, XAUUSD’s trend has shifted from a potential buy trade on a potential reversal back into a trend resumption trade to the downside that we hope to catch with this trade. Because of the technical set-up and recent price action showing XAU weakness, we’re happy to consider this trade with the stop above the FOMC High of 1,373.

    Happy Trading!

    --Written by Tyler Yell, Trading Instructor

    More...

  9. #209
    member ForeCastle's Avatar
    Join Date
    Apr 2013
    Posts
    1,077
    Blog Entries
    236

    How to Trade the Forex Doji Breakout

    - A Doji is a small bodied Japanese candlestick pattern whose opening and closing are at the same or nearly the same price.
    - A Doji is usually part of common Japanese candlestick reversal patterns like the bullish Morning Star and bearish Evening star patterns
    - Because Dojis are found in a large number of reversal patterns, traders automatically think that the single doji is a reversal candlestick. But in fact, the doji by itself represents indecision in the marketplace.
    - A Doji breakout setup provides an excellent risk to reward opportunity for forex traders.

    Learn Forex: Family of Dojis


    The lowly doji is very unassuming in appearance. Typically, it looks like a plus sign but can appear as a capital “T” in the Dragonfly doji pattern or the shape of a nail in the Gravestone Doji. We are going to be discussing the first two types of dojis found in the “cheat sheet” above. These small candles can lead to large breakouts that either continue trends or reverses them. We are going to look at the way to trade these power packed price patterns with limited risk for maximum potential gain

    Learn Forex: How to Read a Japanese Candlestick


    Typical candlesticks consist of a body that may be one of two colors; blue or red. A candle is blue if buyers were able to push prices above the opening price and were able to hold it until the close of the candle. A candle is red or bearish is sellers were able to push prices below the opening price and hold it there until the close.

    Learn Forex: How to Read a Doji Candlestick

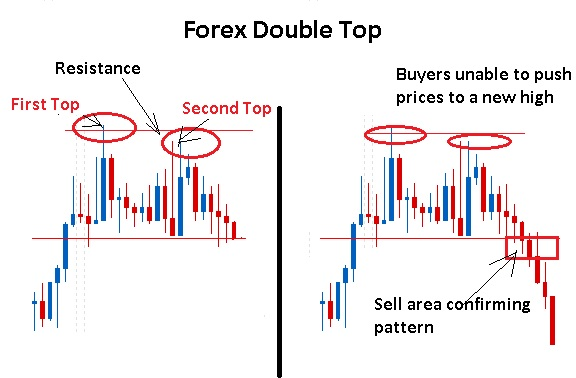
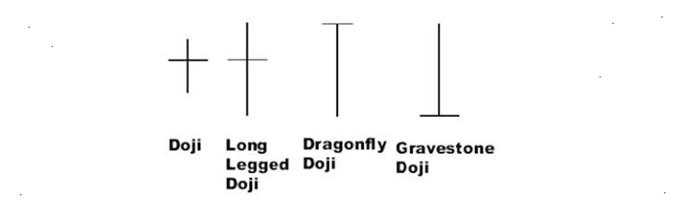
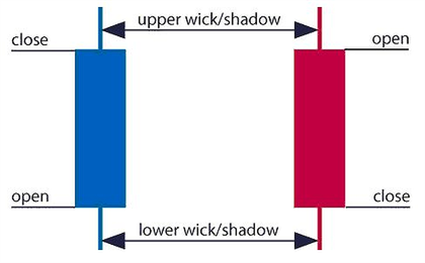
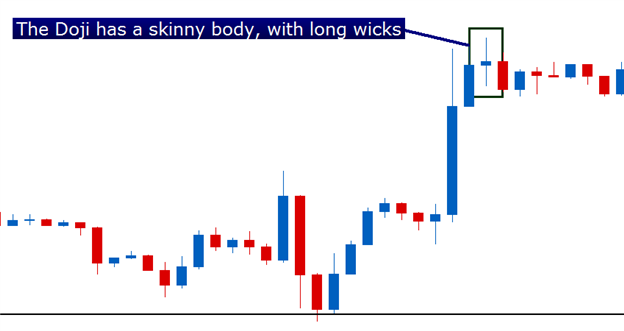
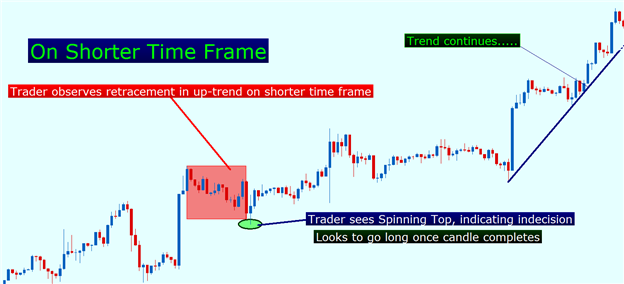
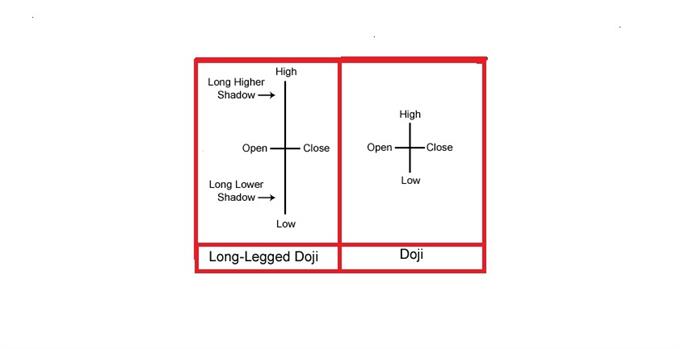
    On the other hand, the doji candles have no color. The doji and long-legged doji illustrate the battle between buyers and sellers that ended in a tie. The opening price and closing price are in the same place as bulls were unable to close prices higher and bears were unable to close prices lower.

    How to Trade the Doji Breakout

    Ideally, you want to find a doji that has formed near a level of support like a trend line. You want to identify the doji high and the doji low as this will determine the support and resistance levels of a potential breakout.

    Learn Forex: GBP/JPY Doji Range Breakout Trade


    Next, you want to wait for a full-bodied candle to close either above the doji high or below the doji low. Since bulls and bears have been at a standstill, a high volatility breakout should happen releasing this pent up pressure. If you get a breakout below the doji low, place a protective stop about 4 pips above the doji high and enter short on the close of the breakout candle. Calculate the doji range and multiply that times two to get the limit. Since your stop is the range itself, you want to target double your initial risk.

    Learn Forex: Managing Risk with the Doji


    On the other hand, if a full-bodied candle closes above the doji high, enter long at the close of the candle and place a stop 4 pips below the low of the doji. That is your trigger to get long. In the example above, the doji range was 20 pips and twice the range gave me a target of 40 pips. Notice how significant the high of the doji was as it acted as support. It is important to note that some dojis during periods of low volatility, like those found in the Asia session, give many false signals.
    So next time you see the doji on your forex charts, give the little fella some respect as it can tell you a lot about setting stops and limits for the next big breakout trade!

    --- Written by Gregory McLeod, Trading Instructor

    More...

  10. #210
    member ForeCastle's Avatar
    Join Date
    Apr 2013
    Posts
    1,077
    Blog Entries
    236

    Strong & Weak: 3 Reasons to Buy Euro Currency Basket

    Talking Points:
    -Extreme SSI reading suggests further gains for EURUSD
    -EURGBP carves bullish patterns suggesting Euro outpaces Sterling
    -EURJPY sits on a 6 month support trend line suggesting trend is still higher

    This week saw major fundamental news releases such as three central bank interest rate announcements plus a United States government shutdown. Despite the heavy week of fundamental releases, currencies saw little follow through in pricing and minimal change in their relative strength against one another.

    Forex Strategy: Matching Strong versus Weak

    Currency Up Arrows Down Arrows Change From Last Week
    NZD 6 No Change
    CHF 6 Higher 1 ranking
    GBP 4 3 No Change
    AUD 4 3 Higher 1 ranking
    EUR 3 4 Down 1 ranking
    JPY 2 5 Up 1 ranking
    CAD 2 5 Down 1 ranking
    USD 7 No Change


    Using forex analysis, we find three reasons for continued Euro strength. Therefore, we feel the best way to trade Euro strength is through a currency basket where you are trading a currency rather than a pair.

    1) EURUSD Speculative Sentiment Index (SSI) Near a 2 Month Extreme
    The EURUSD SSI reading currently sits around -3.5. This means there are three times as many sellers than buyers of the pair. SSI is a contrarian type of indicator which suggests further gains in the exchange rate are likely.
    Two months ago, in August, the EURUSD SSI reading was almost -4.0. At that time, the EURUSD exchange rate was 1.34 so you can see how the majority of traders continue to be incorrect in trying to pick a top for the pair.
    Additionally, the US Dollar continues to occupy the weakest spot in the chart above. If SSI proves correct, then the EURUSD should experience higher prices next week.

    2) EURGBP Carves Bullish Patterns
    The EURGBP appears to have put into place an important bottom. The pair appears to have established two different equal wave patterns that suggest a confluence of support in the .8350-.8400 zone. This strong support zone has briefly been penetrated a couple of times, but those losses would not hold.

    Forex Education: 2 Equal Wave Patterns Converge Making a Bullish Opportunity


    Additionally, the Relative Strength Index (RSI) is showing a sign of divergence which simply means the momentum to the downside is running out of fuel. When the RSI divergence is combined with equal wave patterns, the signals are powerful. It is possible the whole pattern equal wave pattern is likely to be retraced toward .88 at some point in time in the future.

    Gains in the pair suggest the Euro would outpace the British Pound (GBP).

    3) EURJPY Sits on Top of 6 Month Support Trend Line
    Though the Japanese Yen has been gaining some strength, it has not been able to break significant support levels against the Euro.

    Forex Education: EURJPY at Trend Line Support


    As you can see above, the EURJPY has been supported for the past six months by a trend line. Currently, prices rest near this trend line. We never know if support and resistance levels hold, but if the past 6 months offers any evidence about the future, we can expect to see this support level near 131.50 hold until it is broken.

    Executing the Trade

    Two weeks ago, we highlighted buying Euro strength through a basket of currencies. Unfortunately, the timing of the buy signal was off as the trade stopped out, yet the Euro has still gained strength in general. That is a good reminder for why it is important to trade in conservative amounts.

    Therefore, so long as prices are firmly held above the EURJPY support line and so long as the EURGBP holds above .8330, then we can look for continued strength in the Euro. The opportunity can be traded by placing a EUR currency basket buy trade where we buy the Euro against a basket of currencies.

    Last week, we focused on selling an Australian Dollar sell basket. We will keep that trade open in case the US government shut down and debt ceiling debacle deteriorate into an anxious market.
    Good luck with your trading!

    ---Written by Jeremy Wagner, Head Trading Instructor, DailyFX Education

    More...

Page 21 of 43 FirstFirst ... 11 19 20 21 22 23 31 ... LastLast

LinkBacks (?)

  1. 10-09-2013, 09:11 PM

Tags for this Thread

Bookmarks

Posting Permissions

  • You may not post new threads
  • You may not post replies
  • You may not post attachments
  • You may not edit your posts
  •