Page 22 of 43 FirstFirst ... 12 20 21 22 23 24 32 ... LastLast
Results 211 to 220 of 430
Like Tree6Likes

Forex Strategies

This is a discussion on Forex Strategies within the Trading Systems forums, part of the Trading Forum category; Article Summary: Price Action is a form of technical analysis that focuses solely on past prices that have traded in ...


  1. #211
    member ForeCastle's Avatar
    Join Date
    Apr 2013
    Posts
    1,077
    Blog Entries
    236

    Four Simple Ways to Become a Better Price Action Trader

    Article Summary:

    • Price Action is a form of technical analysis that focuses solely on past prices that have traded in the market
    • This article contains a simple, and complex method for new traders to begin learning price action
    • This study can be furthered in the live sessions on DailyFX and DailyFX PLUS in which Analysts and Instructors explain price action in real market conditions


    ‘Price Action is my favorite indicator, because it’s the only one that will never tell me a lie.’

    And this is true; albeit maybe a little ‘opaque’ for new traders, or even experienced traders that haven’t yet found the study of price action. The study of price action entails reading past prices, to build an approach or plan for the future.

    Surely, most traders that end up ‘making it’ as a trader will find this specific study of technical analysis eventually; but it’s usually only after multiple disappointments and failed attempts at building indicator-based strategies that zig when the market actually ‘zags.’ So, please allow me to elaborate on my earlier statement.
    Price action will never lie to us, as traders, because it never purports to tell us what WILL happen; but rather it only tells us what HAS happened.

    There is a chasm of disconnect between these two premises.

    As a trader, you will NEVER truly know what will happen in the future. Any indicator or indication of what MAY happen in the future is just a possibility. And even then, it could be a remote possibility at best because that indicator you’re using - well, it’s really just a fancy way of looking at previous price action.

    So, regardless of the strategy - those same boring concepts of risk, trade, and money management are of the upmost importance to the trader.

    But after that - traders can focus on getting the probabilities on their side as much as possible through analysis, and this is where price action can really shine.

    Because, once again - this is a ‘clean’ way of looking at past prices, without the obfuscation of a mathematical formula that may be obscuring what’s happened in the recent past.

    Below are four simple ways that traders can become better at reading, reacting, and analyzing price action.

    Method 1 - The Price Action Primer

    If you’ve been to DailyFX over the past couple of years, you may have encountered a previous article on price action. We talk about this A LOT because of all the aforementioned reasons, and quite simply - it works. Not that it works in telling us the future, but it works in allowing us to see the past as efficiently and honestly as possible.
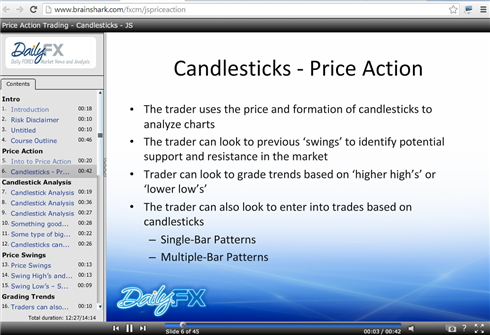
    So, we’ve produced numerous materials in an attempt to teach traders price action. The easiest way to break into this field of study is through a presentation that we put together through a medium called ‘Brainshark.’ It approximately 15-20 minutes long, and available to anyone that is interested, free-of-charge.

    The Price Action Primer via Brainshark


    We’ve had massive success in helping our traders through various brainsharks, and you’ve likely seen allusions to this medium in previous articles. We’re hoping to replicate that success in helping our clients with the Brainshark presentation built specifically on price action.

    To view the Price Actin Primer via brainshark, please click the link below.
    Price Action Primer via Brainshark
    You will be asked to input a few pieces of information into the guestbook (information that WILL NOT be shared or given to any 3rd parties), and you will then be met with a 20 minute course on the topic of price action.

    Method 2: Grade Trends by Focusing on Swings

    One of the first pillars of technical analysis centers on that age-old saying of ‘the trend is your friend.’
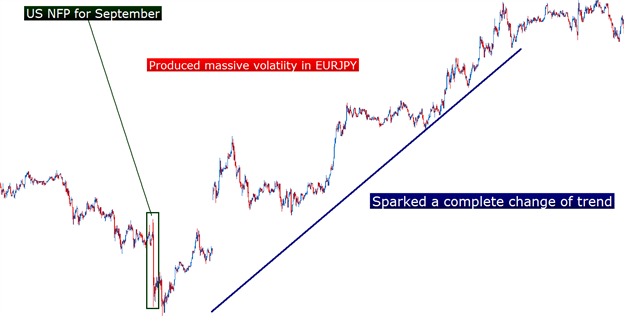
    And the reason for this goes right back to one of those very first things we touched on at the beginning of this article: The future really is unpredictable.

    But trends take place for reasons, right? Maybe it was a QE announcement, or a Debt Crisis - whatever the reason, trends exist much like the tide of the ocean exists.

    And just like swimmers in the ocean, traders are often best served by going with the flow.
    Because, if we look at trading as pessimistically as we can, and we assume that any individual trade is akin to flipping a coin, then we have a 50/50 chance of price moving up or down, right?

    Well, if that bias continues, and further - if we are trading in the direction of that bias, it stands to reason that we can begin moving our chances or probabilities of success slightly better than a 50/50 split.
    Perhaps it’s small, perhaps as small as 51/49 in our favor, or 52/48 - but the logic is the same.
    If what has happened continues happening, I may stand a better-than-fair chance at success.

    If we add in strong money management, well - now we have an entire strategy!

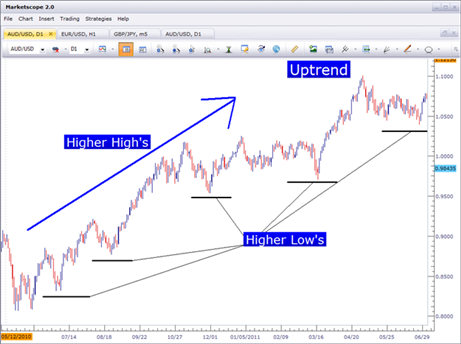
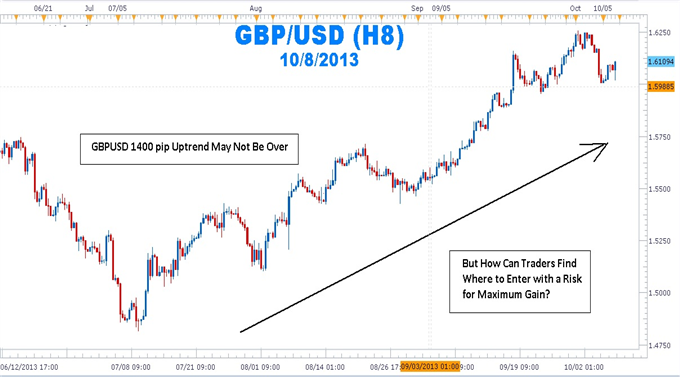
    Traders can read and gauge trends using solely price action. We expand on this topic in our Introduction to Price Action; but we can simply look to the chart to point out the trend.

    Up-trends will often be highlighted with higher-highs, and lower-lows


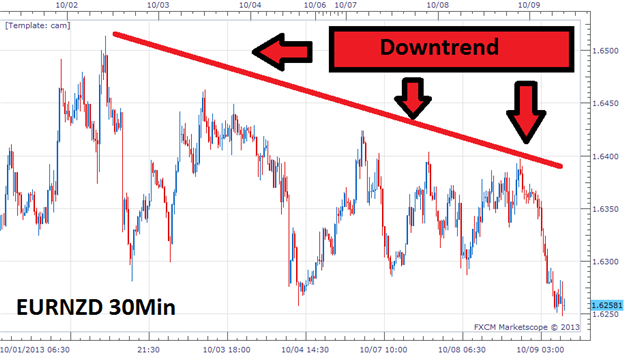
    Meanwhile, down-trends will see lower-lows, and lower-highs


    And this, in-and-of-itself, is very powerful... but the big question you need to ask yourself is whether it is enough to just simply ‘buy’ when prices have been moving higher, or to ‘sell’ when prices have been moving lower?
    The answer is a definitive ‘no.’ And the reason is because, once again, we want to try to get the best possible chances of success in the market given the information available to us, and for that we can move on to the next method.

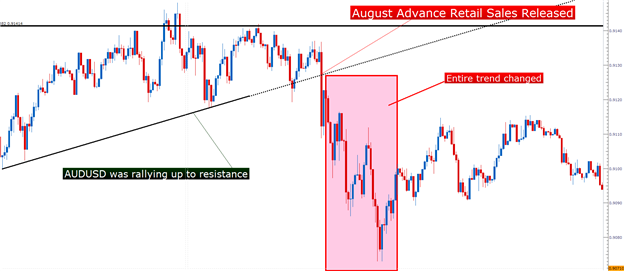
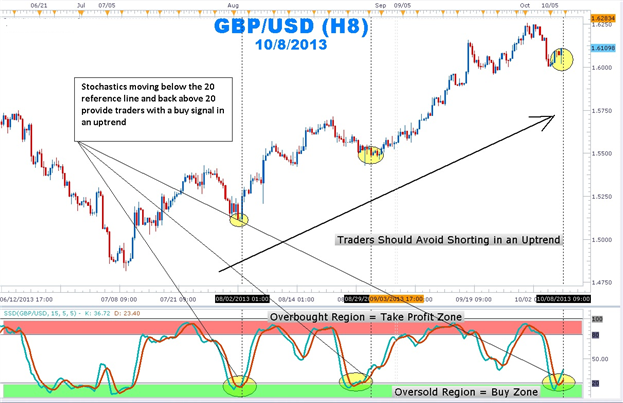
    Method 3: Use Price Action to Highlight Valuable Support and Resistance

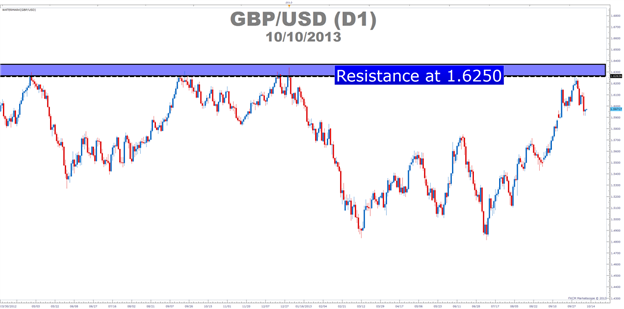
    The second primary aspect of technical analysis is Support and Resistance, and this is another message that the study of prices can bring to us.

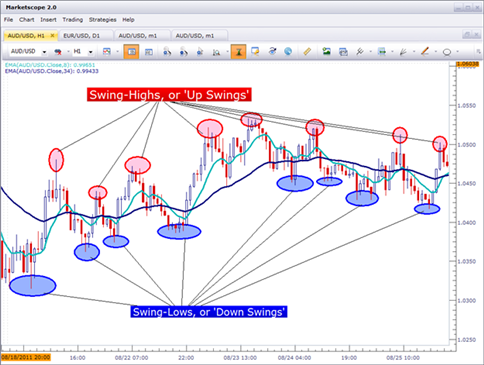
    Price Swings can identify support and resistance in the market


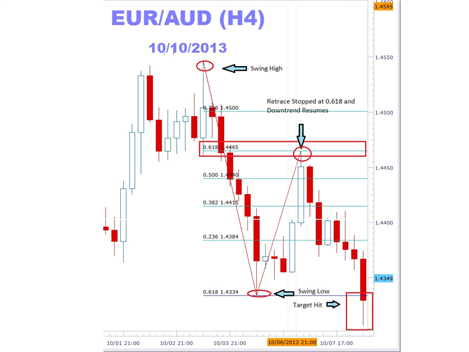
    Reading ‘swings’ in the market is an easy way to begin doing this. A swing can, quite simply, be classified as an inflection point in the market. We discussed this topic in the article Price Action Swings, and have added an illustration below to highlight this point.

    The swing in the market is the point at which demand outstripped supply (in the case of a swing low setting support), or supply ran over demand (creating a swing high of resistance before prices moved lower).
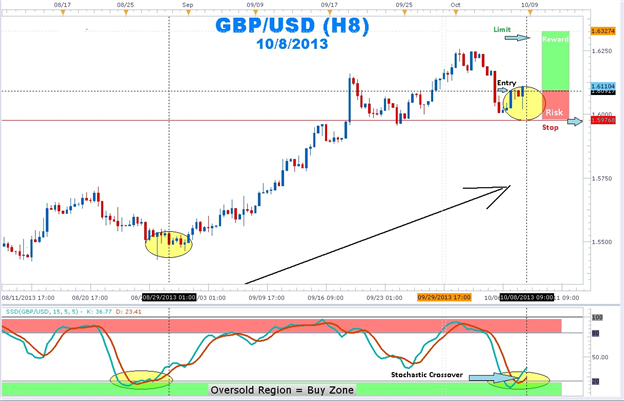
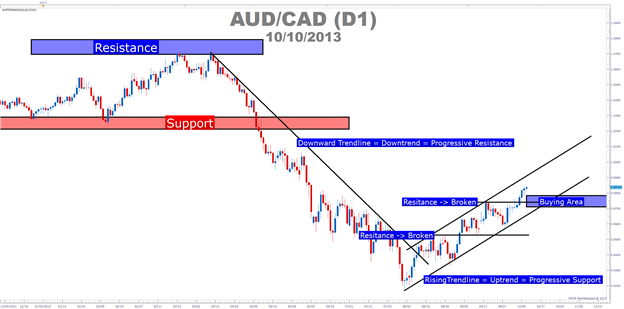
    Traders can use these progressively higher swing-highs, and higher swing-lows to define an up-trend. Each of these swing-highs offering a point of support with which traders may be able to look to buy into the up-trend ‘cheaply.’

    Higher swing-lows define support in an up-trend


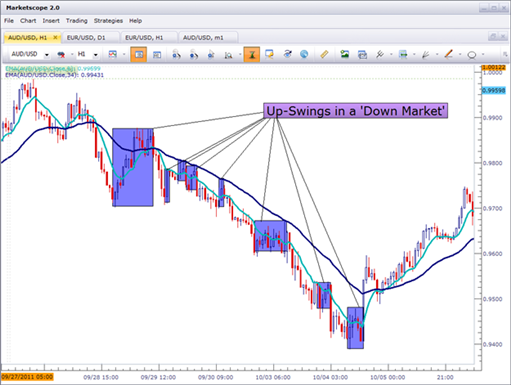
    They can also use progressively lower-lows, and lower-highs to denominate a down-trend. And, of course, each of these lower ‘swing-highs’ become levels of resistance that traders can use.

    Lower swing-highs define resistance in a down-trend


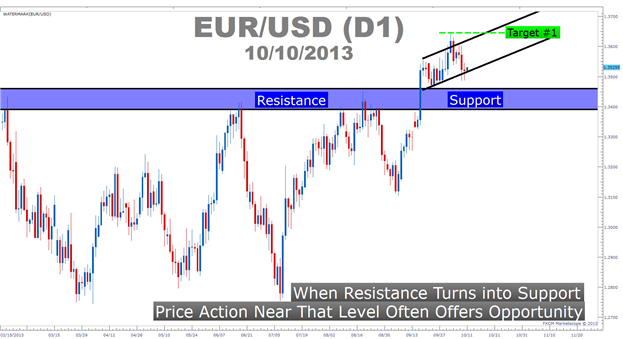
    We can even rope in some additional Support and Resistance studies in an attempt to find really important levels. Psychological levels, for instance, can be a great way of pointing out swings that might have a little more importance in the market place. Fibonacci can be another fantastic addition to Price Action to point out levels that other traders may be watching for.

    After traders can identify swings with support and resistance inflections, traders can then begin looking to buy up-trends cheaply, at or near support; while traders can look to sell expensively when prices are at or near resistance. Which brings us to the exact entry of the trade…

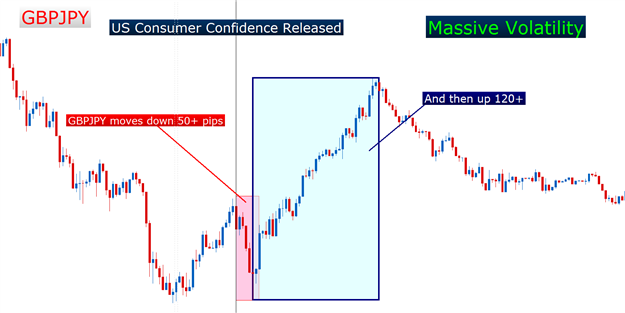
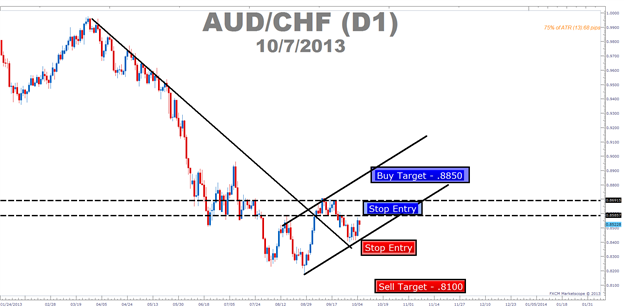
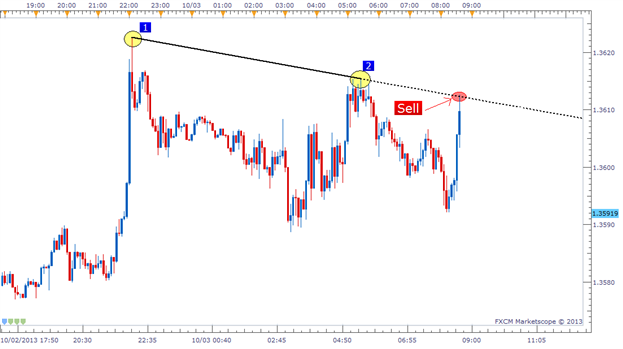
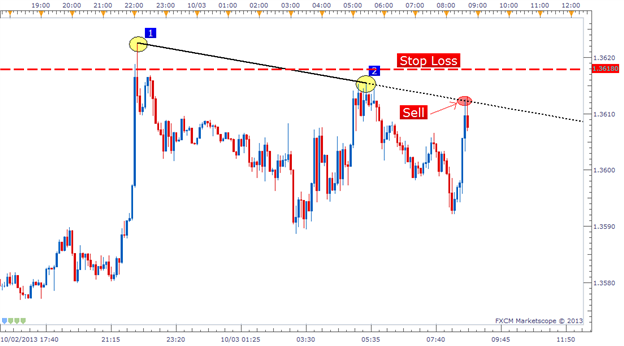
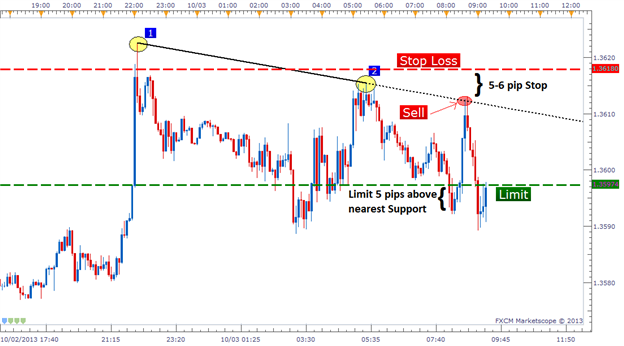
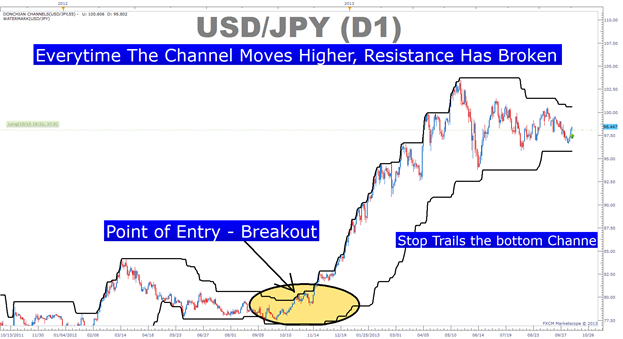
    Method 4: Use Price Action Formations to Trigger into Positions

    After the trend has been identified, and after traders have found support and resistance via swings displayed in the marketplace, traders can begin looking for formations to decide when, and how to enter into positions.
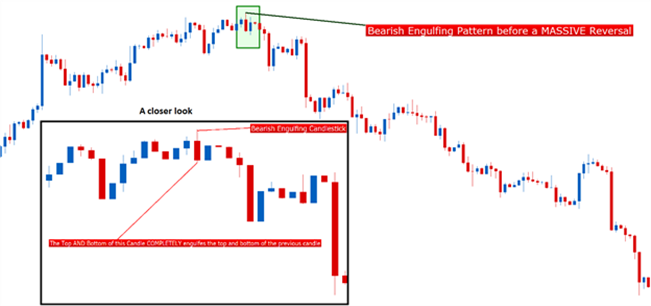
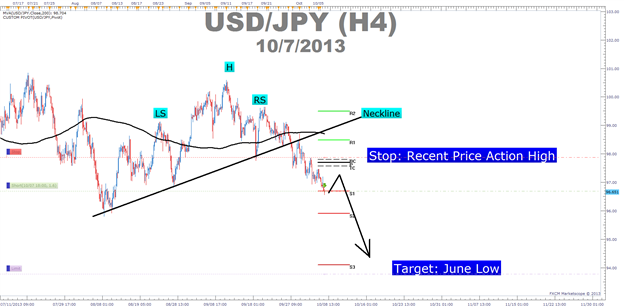
    There are quite a few of these out there, and we’ve talked about numerous such formations over the past few years. Most recently, we highlighted five of the most common bearish reversal patterns in the article, Trading Bearish Reversals.

    A Bearish Engulfing Pattern before a massive move lower


    We also published this piece specifically on the hammer and inverted hammer formations.


    And, a favorite of price action traders, the pin bar can offer some excellent entry opportunities.


    -- Written by James Stanley

    More...

  2. #212
    member ForeCastle's Avatar
    Join Date
    Apr 2013
    Posts
    1,077
    Blog Entries
    236

    The Lifeblood of the US Economy: The Consumer

    Article Summary:


    • The Consumer plays a vital role in an economy
    • Globalization has become so important that consumer activity in one economy can have massive bearings for others
    • Economic data prints of US Consumer activity can bring massive volatility to markets


    One of the best aspects of the Forex market is that is so accurately reflects how globalization has changed the world. If you view economics solely from the position of an equity trader, you’re bound to view the world through rose-colored glasses; focusing on just one of the many economies that make up the world financial system.

    But in the forex market, a data print in one continent can send a currency across the world flying to the moon, or dropping through the floor. Price action can tell us where prices have moved in the past, but fundamental analysis is what molds future price movements.

    The reason for this is rational. In the Forex market, everything is traded in pairs, unless a system like a currency basket is being used. But, more to that point is the fact that what benefits one economy may benefit another.

    Nowhere are these impacts more evident than during the release of Non-Farm Payrolls each month. This is simply the number of jobs added to American payrolls in the previous month. There is a litany of criticisms of the statistic, but this is often the first glimpse the marketplace receives of employment data for the month prior. NFP is usually issued on the first Friday of every month, and the data pertains to the most recent month.

    But volatility can be seen all over the place, not just in USD-related pairings. Take, for example, the EURJPY during the release of the August 2013 NFP report.

    Data Releases from the United States can have far-ranging consequences


    So, the number of new jobs added in the United States can be used as somewhat of a barometer for global economic health. After all, if employment is improving in the United States that means more people will have money to buy goods and services. Many of those goods and services are being imported from foreign countries, and the proceeds of those sales can go into the pockets of the workers in those foreign countries to spend on other goods and services.

    You can probably tell from this relationship, that there is another important factor in the function of economics: The consumer.

    While employment can be a great gauge of economic health and a fantastic pre-cursor of future economic growth - consumer activity plays an equally vital role in the global economy. Consumer spending makes up over 2/3rds of all US economic activity!

    And this is a good thing, because consumers spending money means that business make more profits; profits which can be re-invested in the business by hiring more workers, expanding operations, and increasing investments; all of which serve to create a synergistic effect of more consumer activity, more spending, and more growth.

    Much like the number of jobs added in the largest national economy in the world can be used to gauge global economic health, consumer activity in the United States can tell economists quite a bit about what might be expected in quarters to come.

    More active consumers and increasing consumer activity mean more of that economic synergy leading to even more growth throughout the economy. And more growth in the US economy means more growth for the rest of the world.

    So the importance of consumer activity, particularly that in the United States cannot be understated in Fundamental analysis. There are a few common gauges of consumer health and activity in the United States, and we go over the three most common below.

    Advance Retail Sales

    This is the report probably closest to Non-Farm Payrolls regarding amount of volatility that it may produce, and impact that it may have.

    Like NFP, Advance Retail Sales is an early look at the most recent month passed, and this is both a blessing and a curse for the indicator. On the upside, the timeliness of this information is what makes it so important, and so widely awaited for by traders. However, because it is so timely, that leads to the one downside: volatility. This number is often met with numerous revisions in future months (also like NFP), and those revisions could potentially be massive. In some cases, revisions can cause a firmly positive number to become a negative number.

    Advance Retail Sales is usually reported on the 13th of each month, for data pertaining to the month prior. The release of Advance Retail Sales can see massive volatility enter the Forex market; case in point, the AUDUSD during the release of August Advance Retail Sales:

    Advance Retail Sales can be powerful enough to reverse trends


    US Consumer Confidence

    This is a figure that is produced by the independent economic research organization, The Conference Board. The data is produced through mail-in surveys of 5,000 respondents, and asks for opinions on current business conditions, as well as expectations for future economic outlook.

    The survey asks respondents to rate ‘positive,’ ‘neutral,’ or ‘negative,’ regarding their outlooks on 5 topics. And like Advance Retail Sales, releases of the Consumer Confidence Index can see massive volatility enter markets. For example, during the release of last month’s Consumer Confidence number, the GBPJPY saw movement of 50 pips right after the release, only to see a 120 pip retracement shortly in its wake.

    Consumer Confidence can produce massive volatility


    The prevailing thought is that the Consumer Confidence Index could be used to help project GDP growth. However, Consumer Confidence has seen some criticisms from economists as being too volatile, and for having perhaps a weak connection to overall household expenditures. This has led many economists and traders to focus more intently on the next data release...

    University of Michigan Consumer Sentiment

    This figure takes in fewer opinions into the data than Consumer Confidence, but has much more depth in the questions being asked. The University of Michigan Consumer Sentiment Survey will ask fifty questions of at least 500 respondents each month via telephone surveys, and this has helped to make this statistic very valuable to traders and economists attempting to gauge US Consumer Activity.
    Because this number is so widely awaited for, the volatility ensuing after its release can be massive, just as the two previous releases that we investigated.

    A little bit more about this news release: The preliminary report is usually the more volatile release, and is issued on or around the 10th of each month. This includes 60% of answers from respondents. You’ll see this noted in the economic calendar of DailyFX as below:


    The final release is usually issued towards the last business day of the month, and can also move markets albeit not usually as much as the preliminary report due to the fact that multiple weeks have passed, and many other indicators of consumer activity for the observed period have made their way into the market.

    The final release will show in the economic calendar such as this:


    To join James Stanley’s distribution list, please click here.

    More...

  3. #213
    member ForeCastle's Avatar
    Join Date
    Apr 2013
    Posts
    1,077
    Blog Entries
    236

    Trading Rules That Have Stood the Test of Time

    If I have seen further it is by standing on the shoulders of giants.
    -Isaac Newton, Letter to Robert Hooke, February 5, 1675

    Talking Points

    • When Profitable Traders Share Their Lessons, It Often Pays To Listen
    • A few key trading rules
    • FX Application To Those Trading Rules


    When a new trader approaches any market they understandably look for those who have over time proven themselves successful. This often comes by building a library and reading through the trading greats. However, like most things in life, the true value of the lesson often lacks the ability to be put into practice until the pain of avoiding that lesson comes front and center so that you take notice of the lesson’s value.

    While this is not an exhaustive list of the wise sayings from traders over the years it does give you a gathering of collective wisdom that has benefited my trading. Naturally, when approaching a new book or line of thought in regards to trading I’m really only interested in seeing if it will heighten my ability to manage the risk inherent of every trade or to better approach trading as a whole to make me sharper. Sadly, as mentioned earlier, the rules or guidelines often don’t carry the weight they deserve until a loss is taken which illuminates the wisdom that laid under the rock of wisdom.


    Trading Rules That Have Guided Me

    “If you are going to place a stop, put it at a logical, not convenient place.” – Martin Pring, Investor Psychology Explained

    Learn Forex: Determine Stop Location & Then Trade Size


    Many traders are rightly concerned with the risk to reward about their trade. However, it can be a mistake to have a fixed position size in mind and then force a stop based on what is convenient so you don’t lose too much. As you can imagine, the market will likely remain bound by prior price action as opposed to your stops so it is best to think about your trade size like a pro and set your stop level first and then adjust your trade size.

    "Every day I assume every position I have is wrong" & "At the end of the day, the most important thing is how good you are at risk control." – Paul Tudor Jones

    Many traders look to Paul Tudor Jones as a hero of trading and money managers. Paul Tudor Jones busted onto the scene by shorting stock indices through the Black Monday of 1987 to reportedly net north of $100 Million as the US30 dropped 22% However, his attention to keeping risk under control is what has kept him atop the game is his ability to limit downside. As my years in the business increase, I become much more attuned to how pros have approached the psychology of risk management then to which indicator they’ve fallen for because risk management will lead itself to longevity.

    “Never average losses.” & “Markets are never wrong – opinions often are.” – Jesse Livermore

    Jesse Livermore is a headline trader who roughly called and more importantly profited through the 1907 & 1929 stock market crash and was rumored to have made the modern day equivalent of $1.2 billion in today’s dollar. The main lesson from the prior two quotes is that it’s best not to try and outsmart the market. Traders often try and outsmart the market by trading against a trend or adding to a losing position when the market and their account equity is proving them wrong. I prefer to wait for price action to show early signals that are confirming my idea
    before I risk my own capital.


    Learn Forex: Wait for Price Action to Confirm Your Opinion


    “Don’t try to buy at the bottom or sell at the top. This can’t be done – except by liars” – Bernard Baruch, Baruch: My Own Story

    This valuable piece of advice has kept me level headed when I see a top forming in the market. By all account, it may very well be a top forming but I’d rather wait until a lower low and lower high are in place before looking to sell the move. Another way this piece of advice has been put is that the first 1/8 of a move is often the most expensive part because everyone wants in on the ground floor however by the time the move has been confirmed many traders have depleted their capital.

    “Equal distribution of risk. Trade in 2 or 3 different commodities, if possible. Avoid tying up all your capital in any one [trade].” – W.D. Gann

    Limiting your trade ideas to one trade can easily amplify your risk. We often recommend that if you have a strong argument for one currency’s strength or weakness that you consider a currency basket. The benefit of a currency basket is that if you want to sell the US Dollar, you can do so by limiting the purchase of one specific counter currency and spread out your risk by buying other currencies in a smaller lot size against the US dollar.

    Closing Thoughts

    The value in the prior statements has come from years of trading and recognizing how markets work to give you an edge. As discussed in one of my DailyFX Plus webinars, your success lies less and less in the indicator you use and more and more in your ability to control risk and consistently exploit an edge that you’ve identified. I hope these sayings help you as they’ve helped me over the years and please feel free to share wise words that have helped you in your trading.

    Happy Trading!

    ---Written by Tyler Yell, Trading Instructor

    More...

  4. #214
    member ForeCastle's Avatar
    Join Date
    Apr 2013
    Posts
    1,077
    Blog Entries
    236

    Pinpointing Forex Trend Trade Entries with Stochastics

    - An uptrend is made up of higher highs and higher lows. Traders can use Stochastics to find excellent risk to reward entries at those low support points in the trend.
    - A downtrend is made up of lower highs and lower lows. Forex traders can use Stochastics to find excellent risk to reward entries at these resistance high points
    - Stochastics can be used to alert a forex trader to either tighten stops, reduce the position size, or take profit once in a trend trade.

    By far, traders who trade in the direction of the predominant daily trend have a higher percentage of success than those who trade the counter trend. One of the biggest attractions of the Forex market it is characterized by long trends that afford traders the potential to make hundreds of pips if they have timed their entries with precision and used protective stops to limit risk.

    Learn Forex: GBP/USD Uptrend


    But How Can Traders Find Where to Enter with a Risk for Maximum Gain?

    The mantra, “the trend is your friend until it ends,” can be found in many trading books, but it seems that many forex traders have not made the trend their friend and in some cases, the trend has become the enemy. Rather than being on the receiving end of those pips afforded to traders who have correctly entered the trend, many traders have been on the “giving” end of the trade losing pips while fighting the trend.

    As people have turned to online dating services to meet their ideal match, forex traders can turn to stochastics as a way of making the trend the their friend again.

    Learn Forex: Stochastics Showing Entries in GBPUSD Uptrend


    In an uptrend on a daily chart, stochastics %K and %D lines moving below the horizontal ‘20’ reference line and coming back above the 20 line indicates that the profit-taking correction is coming to an end. The stochastic crossing up also tells us that buyers are beginning to enter the market again. In addition, this shows that there is good support.
    How to Trade the Trend Using Stochastics

    Patience is the name of the game when attempting to trade with the trend. Getting into the trend too early can expose traders to large drawdowns. Getting in too late reduces the amount of profit before the swing is completed.

    Use the stochastics indicator to find that “Goldilocks” entry of not too early and not too late. Once a strong uptrend is found, wait for stochastics with the settings of 15, 5, 5 to move into the oversold region below the 20 horizontal reference line. Next, wait for the %K and %D lines to move back above the 20 line. Enter long with a stop placed a few pips below the last low. Set a limit for at least twice the size of the stop.

    Learn Forex: GBPUSD Risk to Reward Setup


    Once in an uptrend position, traders will attempt to squeeze as much profit as possible. Traders usually take profits on their open position or trail stops once stochastics moves into the overbought region. It is important to note that a forex currency pair can continue to make new highs even though stochastics is in the overbought region.

    So next time you see a trend and you do not know how to make it your “friend”, let the stochastics indicator introduce you! Once these swings are highlighted by stochastics, stop placement becomes easier as well. stochastics crossovers in an uptrend can help you pinpoint your entries to join the major trend.

    --- Written by Gregory McLeod, Trading Instructor

    More...

  5. #215
    member ForeCastle's Avatar
    Join Date
    Apr 2013
    Posts
    1,077
    Blog Entries
    236

    How to Exit While Trading with Trendlines

    Talking Points:

    • Traders should focus on their exit plan just as much as their trade entries.
    • Trendline traders could set their stop losses beyond the nearest support or resistance level and set their limits within the nearest support or resistance level.
    • Setting exit prices according to support and resistance levels could tip the odds in your favor.


    How Important Is Your Exit Strategy?

    Many traders have a strong set of rules that they follow to enter trades, but have difficulty in selecting their exits. This is troubling because how we exit a trade should be just as important, if not more important than how a trade is entered. After all, our exits ultimately determine if our trades are profitable for us or not. So we need to make sure our exit strategy is just as logical as our entry strategy.

    When we place our trades based on trendlines, we are placing them based on support and resistance levels. We are thinking the price will bounce off a trendline like it did in the past. I propose we use the same logic when setting our stops and limits.

    Learn Forex: Trendline Trade Example


    In the example above, it’s easy to see the sell entry that was given to us based on the bearish trendline. We entered right at the trendline looking for a bounce back down, but where do we want to exit? When do we call it quits if the trade goes against us? Where do we place our profit target? Let’s take a look.

    Setting Stops Beyond Support/Resistance

    We need to look at placing our stop somewhere above this trendline. If the resistance is broken through, we were wrong on the trade and should accept the loss quickly. It’s possible that price could return back to profitable territory after breaking this resistance, but we cannot rely on being lucky. We can only trade based on what we see.

    Learn Forex: Setting Stop Loss Above Resistance


    I like to set my stop 5-25 pips from the closest support/resistance level depending on the time frame I am trading. The smaller the time frame of the chart, the tighter I will place my stops. On this trade, I set my stop 5-6 pips away from my entry since that was beyond the resistance line as well as the previous swing high (Bounce #2).

    Remember that when we set our Stop loss, this is also setting our monetary risk on the trade. So we also need to consider our trade side in respect to our Stop loss distance.

    Setting Limits Within Support/Resistance

    Now that our stop is set, we need to focus on our profit target. For our limit placement, we have two objectives:


    • Our limit’s distance needs to be further than our stop’s distance.
    • Our limit needs to be placed within the closest support/resistance (by at least 5 pips).


    The reason we want our limit further than our stop is because we always want to try to make more money than what we are risking on each individual trade. This is something we discuss heavily at DailyFX so I will say it again here. We want a positive risk/reward ratio.

    And the reason we want our limit to be placed within the closest support/resistance level (by at least 5 pips) is for the exact same rationale we used to open this trade to begin with. We know prices have a tendency to bounce off price levels they have bounced off of before, so we want to make sure that no support/resistance is in between our entry and our limit level. In the example below you can see I placed my limit 5 pips above the swing low (potential support). This gives price a clear path to a profitable trade.

    Learn Forex: Setting Limit Within Nearest Support


    Trendline Strategy Complete

    This trendline strategy is one that can be used universally across all currency pairs and time frames so it is definitely a worthwhile style of trading to learn. The logic behind the entry and exit rules is also something that can be tailored to other types of strategies as well. Good trading!

    ---Written by Rob Pasche

    More...

  6. #216
    member ForeCastle's Avatar
    Join Date
    Apr 2013
    Posts
    1,077
    Blog Entries
    236

    Scalping With Pivot Points

    Talking Points:


    • Forex scalpers benefit from finding support and resistance levels.
    • Learn to enter Forex retracements with Camarilla pivots.
    • Trade price action breakouts using S4 and R4 Camarilla pivots.


    Forex traders have a variety of options when it comes to trading. However, those traders who are looking to peruse Scalping opportunities will most directly benefits from identifying important inter day price action including levels of support and resistance.

    Below we can see an existing downtrend in the EURNZD. Today we will look at Camarilla Pivots and how they can help Forex scalpers interpret today’s price action.

    So let’s get started!

    Learn Forex –EURNZD 30 Minute Trend


    Camarilla pivots can help clear up which technical levels will be important to a day trader. Camarilla pivots are different from normal Traditional Pivots. Due to their calculations, Camarilla pivots set levels of support and resistance much closer to each other, leading them to more relevant when day trading. When added to the chart, they will display 4 key levels of resistance (R1-4) and 4 key levels of price support (S1-4)
    Below you will find several opportunities traders can look for when using Camarilla pivots in their trading. The most prevalent methods of trading a downtrend include, retracement swings at R3 or a breakout of the established S4 level.

    Learn Forex – EURNZD with Camarilla Pivots


    The first methodology of trading pivots is to look for a retracement. Above we can see the first opportunity to trade the EURNZD at the R3 level or resistance. When price approaches either a R3 or S3 level, traders generally feel there is a chance of an impending reversal! Here price moved up to resistance overnight, prior to dropping down to fresh daily lows. With R3 acting as a ceiling for price allowed day traders an opportunity to sell the market back in the direction of the prevailing trend. This price can be reversed in an uptrend, with traders looking to buy the S3 level of support.

    Trading a Breakout

    The second methodology of trading Camarilla Pivots is by looking for a breakout. Above we can see a breakout opportunity on the EURNZD after price broke the S4 support pivot. S4 represents the last line of daily support for a currency. In a downtrend, traders will look to sell below this value as price traverses towards lower lows. This process can be inverted for an uptrend, looking to sell a breakout above the R4 resistance pivot.
    These are just two of the most popular ways to approach scalping Forex pairs with pivot points. We will continue this discussion next week, as we review determining Risk/Reward ratios using Camarilla Pivots.

    ---Written by Walker England, Trading Instructor

    More...

  7. #217
    member ForeCastle's Avatar
    Join Date
    Apr 2013
    Posts
    1,077
    Blog Entries
    236

    Learn How to Crack the Fibonacci Code in 3 Simple Steps

    Talking Points

    - Use Fibonacci tool by connecting the last swing low and last swing high to display 5 possible areas of support
    - Look for price to turn at one of these 5 main levels before entering a trade for the best possible risk to reward
    - Place a protective stop below next Fibonacci level and a limit at the 0.618 or 1.000 extensions

    Have you ever seen a strong trending move in the market and wanted to be part of it but did not have the confidence to enter the trade?

    Have you ever seen price just stop at a certain part of the chart and then turn around?
    If you answered “Yes” to either one of these questions, then Fibonacci levels may be right for you.

    Learn Forex: USD/CAD Fibonacci Retracement


    Very simply, Fibonacci are mathematical ratios that price pulls back to before resuming the trend. The four major Fibonacci retracement levels are: 0.236, 0.500, 0.618, and 0.786. After price pulls back and bounces from one of these levels, price usually moves up to one of four major Fibonacci extension levels; 0.618, 1.000, 1.27, and 1.618. To keep things simple, I will not go into how these are mathematically derived.

    In the above example, notice how USD/CAD made a strong move up and then began to pull back. By using the Fibonacci tools to connect the swing low with the swing high, hidden levels of potential support and potential price targets were revealed.

    USD/CAD bounced sharply from 1.0280 at the 0.236 Fibonacci level. This is where Fibonacci traders would enter into the market long with a stop just below the 0.382% Fibonacci support level. USDCAD went on to hit the first target was hit at 1.0350 which coincided with the 0.618 extension and then hit the 1.00 target of 1.0397.

    Learn Forex: EURAUD Short Entry Using Fibonacci


    Using the same method, Fibonacci levels can identify, ahead of time, potential levels of resistance. These levels can be used to enter a trade in a downtrend with more confidence that price has turned from an area watched by hundreds of traders. In the example above, EUR/AUD is clearly in a downtrend.

    But as with all downtrends, price retraces upward. Rather than chasing the market, the savvy Fibonacci traders can have these levels of potential resistance drawn days ahead on their charts and wait patiently for price to come to them.

    Patience is rewarded as the EUR/AUD advance was stopped at the 0.618 Fibonacci resistance level. Forex Fibonacci traders would place a stop just above the 0.786 Fibonacci level with a target at the 0.618 extension.
    By following these simple steps, traders can now find high probability reversal areas using Fibonacci retracements to enter into trends with confidence.

    --- Written by Gregory McLeod, Trading Instructor


    More...

  8. #218
    member ForeCastle's Avatar
    Join Date
    Apr 2013
    Posts
    1,077
    Blog Entries
    236

    How to Spot the Polarity Point on Charts to Effectively Trade Trends

    Talking Points:

    • Clearly Defining Trend Progression
    • Understand The Role Of Support & Resistance In A Trend
    • Identify Trend Progression
    • Entering Near New-Found Support


    In the simplest form, a trend is defined as a direction in price. When price has declared a clear direction higher shown by higher highs and higher lows then you can simply look to buy at a favorable price and if the price continues higher, you will see a profit. If the trend losses its direction and moves sideways, the market is said to be “trendless” or moving in a range.

    The way to identify whether a trend is progressing is if price is moving through prior highs also known as resistance. If a trend is moving down, known as a downtrend, then price is consistently moving through the price floors known as support. Resistance is the opposite of support and in an uptrend when price moves near support but does not break that support, then you’re likely near a good place to buy.

    Learn Forex: Support & Resistance in an Uptrend


    In the chart above, you may notice that AUDCAD spent time within support and resistance at the beginning of the year with resistance near 1.0700 and support near 1.0300 for a 400 pip range. In mid-April, AUDCAD fell through support all the way down to 0.9170 for a 1100 pip move in total. What you will notice that as the trend progressed downward, price would hit a low which would act as current support and then back off that low for small amount before breaking that level of support showing the trend was progressing with each break of support.

    Another way to use resistance or support in a strong trend is through a trend line. In a downtrend, you can simply connect the lower highs to create a trendline that will act as resistance and when that trendline is broken then you will notice that the trend has likely lost its steam and may be on its way to a reversal.
    Understand the Role of Support & Resistance in a Trend

    Sadly, trends never move in a straight line. Instead, they oscillate or move up and down in a definitive direction and each new high is called a peak or resistance and a low is called a tough or support. As they move up and down, if the trend is strong enough, the peaks will get consecutively higher and price will continue to move higher than it had previously and thus, you have an uptrend.

    Learn Forex: GBPUSD Buyers Get Much Less Confident Above 1.6250


    To understand the psychology behind a support level and see why it may carry into the future, it is helpful to look at your own experience. If you have every entered a trade, only to watch it decline in price and yearn to sell out at the price of your entry so as to not incur a loss then you have succumbed to the human emotions that show up on the chart to create support and resistance.

    There are many things that can create support and resistance but here are a few major reasons. First, prior highs or prior lows are often the first play that traders are hesitant to reenter a trade for fear that the rest of the market participants will not join them. Another irony of trading is that round numbers often scare off traders from pushing through. However, of equal importance is that when traders are no longer scared of the resistance points, trends often show a great deal of follow through and therefore opportunity.

    Identify & Trading Trend Progression

    In my years of trading, I have yet to find a methodology of trading that I like more than trading breakouts. If you think of support and resistance as a battleground, it is often best to wait until the battle is over and one of the lines has been broken to see who won. A broken line of support or resistance is known as a breakout and can show you directional bias to help you see what side of the trade you likely want to be on. If the breakout is to the upside, then the buyers are driving prices higher and the sellers are running out of steam.

    Learn Forex: Donchian Channels Can Help You Spot Trend Progression


    One way to identify trend progression is through an older yet very effective tool known as the Donchian Cannel. The Donchian Channel indicator is used to identify price breakouts above or below recent price history. The indicator plots recent high and low price boundaries and was made famous by the Turtle Traders during the 1980’s. Any time the current price breaks above or below that boundary a trading opportunity may exist because the Donchian Channel strategy has identified a breaking of resistance in an uptrend and therefore trend progression.

    Entering Near New-Found Support

    As mentioned earlier, price never travels a perfectly straight line as those on the right side of the trade often take profits and those on the wrong side of the trade may add on to their trade. When this happens, a retracement takes place which if you’re not in the trade can offer you a great deal of opportunity. The important thing to note is that as a trend progresses, there are likely new players that treat support as holy ground which lead to the concept of a polarity point. This new level will often been honored and when prices trades near new support, you can see this as a low risk opportunity to enter with the trend.

    Learn Forex: Polarity Points Can Offer You Opportunity


    Happy Trading!

    ---Written by Tyler Yell, Trading Instructor

    More...

  9. #219
    member ForeCastle's Avatar
    Join Date
    Apr 2013
    Posts
    1,077
    Blog Entries
    236

    Trading Trends with Renko Charts

    Talking Points
    - Renko harts filter out the noise of wicks and are based solely on price without time.
    - Renko charts clearly indicate support and resistance.
    - Can be used to confirm trends or can be traded on their own.

    Have you ever been stopped out of trade only to have it move in the direction you originally thought?
    Do you have trouble recognizing trend direction?
    If you answered “Yes” to either one of these questions, then you may want to give Renko charts a try.

    Learn Forex: GBPUSD Renko Chart Bank of England


    Renko means brick in Japanese. Every brick is the same size and a new brick is drawn one brick size below or above the brick before it. Bricks that are adjacent never overlap. Every brick starts where the previous brick ends. Traders can specify the size of bricks in pips. In the example above, the distance from the high and low of the brick is three pips. So a ten brick move is equal to 30 pips (10 bricks times 3-pip height brick).

    Price can move above and below the previous brick until the minimum number of brick is met. This may be a surprise for most traders who are used to a new candle being formed at a specific time. We can see 13 bricks in a row heading up going into the Bank of England rate decision. Once the decision is released the bricks changed in color from blue to red and there was a lower high leading to a 13 brick decline.

    A double bottom that happened when the US Initial Jobless Claims was released ended the selling and the uptrend resumed on the weaker US data. The negative sentiment for GBPUSD following the Bank of England interest rate announcement could be easily seen with streak of red bricks.

    How to Trade Using Renko

    A simple system could be used in which if we have 2 bricks of the same color establishes a trend that we could use as a trigger to either get long or short. On the other hand, a 1 brick of the opposite color ends the trend and we would exit the trade.

    Learn Forex: EURAUD Renko Chart Long and Short Trade


    Buy filtering out time and whipsaws, Renko charts were able to map out market sentiment within small time frames like the 5-minute chart which usually have a lot of noise. However, Renko has its drawbacks. When a line of bricks goes into a range changing color after 2 or 3 bricks, traders can get whipsawed by price action.
    It is easier to stand aside and wait for Renko bricks to move from the congestion channel and begin trending again. This can be clearly seen at the end of the EUR/AUD chart as the line of bricks breaks out to a new low clearing past the previous congestion area.

    In sum, it is easy to see that Renko charts can provide forex traders with a new and fresh way to approach price action. Being based on price action rather than time, traders can stay with trends longer and exit with confidence with clear signals.

    I encourage you to try trading with forex Renko charts in your FXCM demo account. Email me and tell me how they are working for you. The new update of the FXCM Trade Station II Desktop has Renko!
    --- Written by Gregory McLeod, Trading Instructor

    More...

  10. #220
    member ForeCastle's Avatar
    Join Date
    Apr 2013
    Posts
    1,077
    Blog Entries
    236

    Strong & Weak: US Debt Ceiling Paints USDOLLAR in Corner

    Talking Points:
    -Extreme SSI reading suggests further losses for USDOLLAR
    -USDOLLAR carves bullish equal wave pattern
    -Use breakout to determine which force wins and thus which direction to trade the Greenback

    This week saw major emotions and anxiety increase as the United States government shutdown begins its second full week. There are technical indicators suggesting the USDOLLAR may continue its recent sell off. On the other hand, there is a bullish pattern suggesting the USDOLLAR could rally on a debt ceiling agreement.
    This piece will guide you on some key levels to watch to see which pattern is playing out.

    Forex Strategy: Matching Strong versus Weak

    Currency Up Arrows Down Arrows Change From Last Week
    NZD 7 No Change
    AUD 6 1 Higher 1 ranking
    CHF 4 2 Down 1 ranking
    EUR 4 2 Higher 1 ranking
    GBP 2 4 Down 2 rankings
    JPY 2 4 No Change
    USD 1 6 Higher 1 ranking
    CAD 7 Down 1 ranking

    Using forex analysis, we find see in the chart above how the USD has been relatively weak against its other main counterparts. In fact, the USD has occupied one of the bottom 3 spots since September 22 Strong & Week report.

    The biggest technical indicator suggesting the dollar sell off may continue is FXCM’s Speculative Sentiment Index (SSI).


    The SSI shows the majority of traders are currently long the USDOLLAR. SSI is a contrarian indicator which suggests the Dollar is likely to sustain additional losses. Since the majority of traders have already bought the Dollar, then they become a future pool of potential sellers when they decide to close out their trade. This emotion is likely accelerated if they are in a losing position.

    Forex Education: USDOLLAR Equal Wave Pattern?


    On the other hand, there is a bullish pattern displayed on the Dow Jones FXCM Dollar Index. In the chart above, wave c equals the length of wave at near the 10,453 price. With prices trading sideways for the past 3 weeks, perhaps the Dollar is trying to put in a bottom.

    Additionally, the Relative Strength Index (RSI) is showing a sign of divergence which simply means the momentum to the downside is running out of fuel. Combined with the RSI divergence, we can time reversals using the equal wave pattern. This has the potential to be a powerful pattern if it develops. It is possible the whole pattern equal wave pattern is likely to be retraced toward 11,000 at some point in time in the future.

    How do we know which way to trade the Dollar?

    At this point, there are logically technical reasons to suggest both sides. Therefore, let price action dictate to you when prices are reason to commit to one direction. The easiest way to determine is wait for price to break above resistance or below support.

    Most market participants are expecting a resolution to the US debt ceiling debate. However, there is the potential for collateral damage done in the markets through reduced confidence in politician’s ability to quickly resolve difficult situations.

    For example, if the resolution is a 6 week extension, how does that really solve anything? After all, the October 17 time line has been in place for several months. My point is that a 6 week extension may erode the confidence of market participants and they begin to hedge for a safety play.

    We won’t know until the news is released how traders will react. Therefore, we feel the best way to trade the Dollar is through a currency basket where you are trading a currency rather than a pair.
    So here’s the plan, wait for the 10,455 - 10,580 range to break. If price breaks above 10,580, then buy the USD Basket. If price breaks below 10,455, then sell the USD basket. The opportunity can be traded by placing a USD currency basket trade through FXCM’s Mirror Trader platform.

    Good luck with your trading!

    ---Written by Jeremy Wagner, Head Trading Instructor, DailyFX Education

    More...

Page 22 of 43 FirstFirst ... 12 20 21 22 23 24 32 ... LastLast

LinkBacks (?)

  1. 10-09-2013, 09:11 PM

Tags for this Thread

Bookmarks

Posting Permissions

  • You may not post new threads
  • You may not post replies
  • You may not post attachments
  • You may not edit your posts
  •