Page 32 of 43 FirstFirst ... 22 30 31 32 33 34 42 ... LastLast
Results 311 to 320 of 430
Like Tree6Likes

Forex Strategies

This is a discussion on Forex Strategies within the Trading Systems forums, part of the Trading Forum category; Talking Points: The Relative Strength Index can be an extremely versatile indicator Like any other indicator, it will never be ...


  1. #311
    member ForeCastle's Avatar
    Join Date
    Apr 2013
    Posts
    1,077
    Blog Entries
    236

    Three Methods for Trading RSI

    Talking Points:

    • The Relative Strength Index can be an extremely versatile indicator
    • Like any other indicator, it will never be perfectly predictive
    • Three ways of trading with RSI, using various approaches


    Indicators can be dangerous.

    The reason for this is simple: Indicators have no better chance of predicting the future with 100% accuracy than any of us as human beings do.

    With technical analysis, that’s all we’re really doing: Looking at the past to get an idea as to how to best trade future price movements. Technical Analysis can help traders associate the probabilities of success; and indicators can help traders more easily identify high-probability setups.

    One of the more universally accepted indicators is RSI, or the Relative Strength Index. This is often one of the first indicators that a trader learns; and after seeing that it doesn’t always work, RSI often becomes one of the first indicators that traders learn to ignore or forget about.

    But RSI can offer traders quite a bit more than just what it can do by default. In this article, we’re going to look at three methods for trading RSI.

    The Default Use of RSI

    The Default manner to trade RSI is to wait for the indicator value to move into ‘Overbought (above 70)’ or ‘Oversold (below 30)’ territory as shown below.

    Relative Strength Identification


    Once RSI begins moving out of that area, traders can look to trigger a trade in the opposite direction (selling when price leaves overbought territory and buying when RSI leaves oversold territory).

    This, in and of itself can be effective; particularly when looked at on longer-term charts and coupled with effective money management.

    Method #1: Daily Chart with 1-to-2 Risk-to-Reward Ratio

    The simplest way to trade with RSI can also be one of the more effective.
    As an example, EURUSD had five RSI crosses on the daily chart in 2013, all of which were sell entries as RSI moved down and through 70. Each of these are identified and numbered on the chart below:

    RSI Crossovers can precede enormous movements


    Notice that out of the 5 instances of RSI crossover on the above chart, three took place immediately before 500+ pip reversals.

    More interesting: the pair trended higher on the year; opening the year at 1.3183, and closing at 1.3776. And yet, we only saw 5 signals, all of which were counter-trend; and 3 of which could have worked out beautifully.
    So, even though EURUSD worked higher during the year, three of the five sell signals per RSI could have equated to profitable trades.

    Traders can take this a step further by adjusting their risk-reward ratio; because, after all, RSI crossovers are counter-trend entries looking for near-term retracements. If those retracements catch to turn into a full on reversal (such as signal #1 in the above chart), the potential return could be large and outsized.

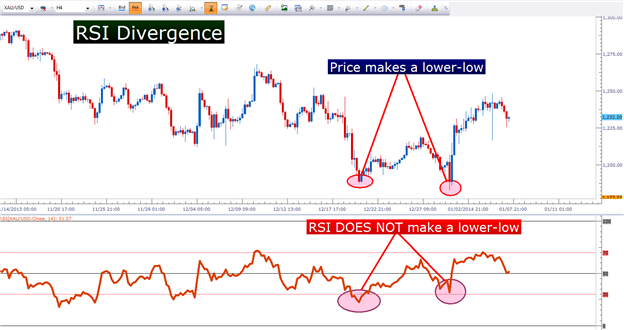
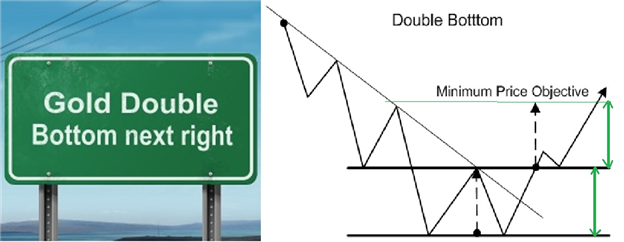
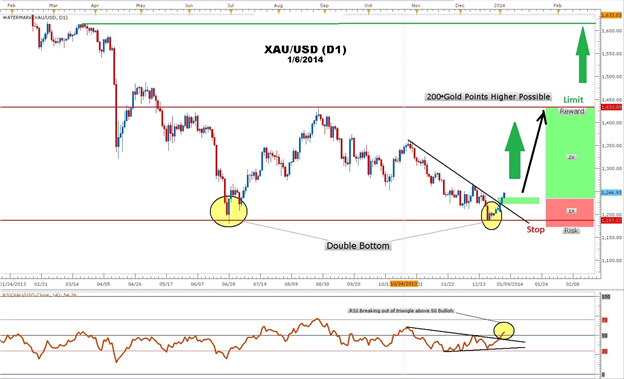
    Method #2: Catching Reversals with RSI Divergence

    RSI Divergence can be an extremely interesting way to trade with Relative Strength.

    RSI Divergence


    Key importance with RSI divergence is risk management; because if the trend does not reverse, the trade can be extremely costly as the trader sits in a counter-trend position.

    RSI divergence may be rarer than standard RSI entries, but traders still need to look at these potential setups with context: Using risk-reward ratios of 1-to-2 or greater when looking for reversals.

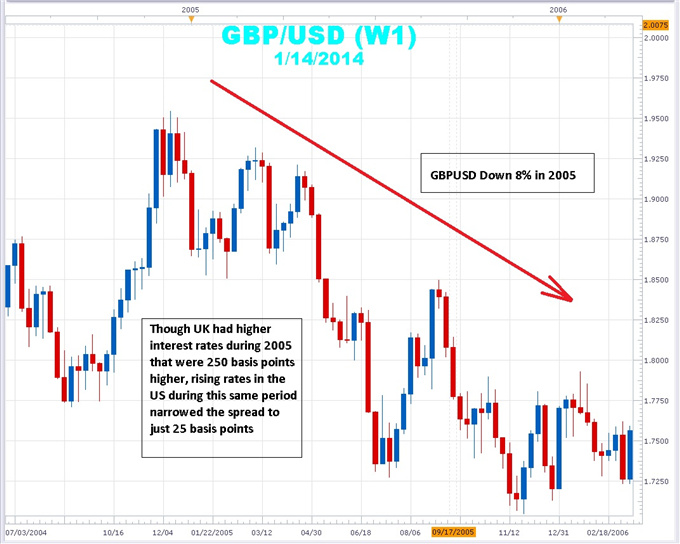
    Method #3: As a Trigger with a Longer-Term Trend Filter

    Multiple Time Frame Analysis can bring considerable value to the technical trader; key of which is allowing the trader to assimilate price action from varying points of view.

    Traders can look to the longer-term chart to get an idea for the general trend direction; and then look to enter on the shorter-term chart in consideration of the longer-term trend. The longer-term chart brings the luxury of allowing the trader to see the ‘bigger picture,’ while the shorter time frame allows the trader to get more granular with their entry and stop placement.

    A primary example of this form of analysis would be the combination of the Daily and the 4-hour chart. Traders can observe the trend on the daily chart, and then after grading the trend can look to place entries on the 4-hour chart.

    Multiple Time Frame Analysis can help traders use RSI more effectively


    -- Written by James Stanley

    More...

  2. #312
    member ForeCastle's Avatar
    Join Date
    Apr 2013
    Posts
    1,077
    Blog Entries
    236

    Chart Signs: How to Trade the Double Bottom on Gold

    Talking Points:

    • The Forex Double Bottom pattern is a bullish reversal pattern consisting a second test of a previous low followed by a rebound higher.
    • Forex traders can determine a profit objective by measuring the distance from the bottom of the pattern to the middle peak
    • The Daily time frame gold chart clearly illustrates the Double Bottom chart pattern


    The Forex double bottom pattern is widely popular among traders because it is easy to recognize, provides clear locations to place stops, and forecasts clear profit targets. Typically, the double bottom will take a familiar letter “W” pattern. This pattern is common on time frames as large as yearly and monthly charts and on smaller time frames like hourly, 5-minute, and even tick charts. We are going to discuss the method for trading this pattern and then look at a real-time example unfolding in gold.


    Double bottom price patterns are usually found at the end of downtrends. The previous downtrend consisting of lower swing highs and lower swing lows begins to accelerate as sellers take full control. Next, price makes an extreme low as more and more sellers pile into the trade, however the extreme move is met with a combination of bargain hunters and sellers taking profits. The following rally creates the peak of the ‘W’ pattern that makes up the double bottom. The rally to the peak is what sellers, who missed the initial decline, were waiting for.

    With price trading against the downtrend line, sellers come in and push prices lower one last time hoping for another long run down that mirrors the previous drop. However, when price fails to make a new low and stalls, sellers begin to abandon the trade and close out their positions. This time, buyers are more confident and are emboldened to buy the bounce because sellers were unable to make a lower low.

    While traditionally, traders usually wait to get long with a close above the double bottom peak, more aggressive traders will buy the close above the broken downtrend line with a stop placed below the last swing low. A first limit would then be set at the peak high of the double bottom with a second target set at two times the height of the pattern. This reduces the amount of risk taken when trading this pattern as the stop will be at a smaller distance from the trend line break than from the top of the pattern breakout.

    Learn Forex: Gold Double Bottom


    The Trade Setup

    After falling nearly $300/oz. on 6/28, Gold (XAUUSD) has just completed a retest of 6-month lows in the 1188 area on 12/20. On the chart above, you can clearly see the double pattern unfolding. Gold’s slow and steady rebound has led to three days above the previous downtrend line. RSI is a technical indicator that traders use to determine momentum.

    RSI generates a buy signal when it moves below 30 and rise to above 30. RSI also generates a buy signal when it moves above 50. RSI stands at 54 which is bullish for gold. Measuring the height of the pattern we get about 245 gold pips. Adding this to the top of the pattern and we get a profit target just above $1600/oz. Remember to place no more than 2% of your account at risk on any one trade as pattern failure and whipsaws are possible that could trigger stops. The double bottom pattern can be a ‘golden’ ticket for traders because its ease of use.

    --- Written by Gregory McLeod, Trading Instructor

    More...

  3. #313
    member ForeCastle's Avatar
    Join Date
    Apr 2013
    Posts
    1,077
    Blog Entries
    236

    Focusing on Protective Stops over Profits Could Help Your FX Trading

    Talking Points

    • Why Many Traders Only Pay Lip-Service to Stops
    • What Pros Focus On – Good Enough is Good Enough
    • The Trick To Money Management


    “Participating in the markets without a plan is like ordering from a menu that has no prices, then letting the waiter fill out and sign your charge card receipt. It’s like playing roulette without knowing in advance how much you had bet, and only after the wheel stopped, letting the croupier tell you how much you had lost or won.”
    Jim Paul,What I Learned Losing $1 Million

    Have you ever lost a lot of money on one trade or maybe a series of very bad trades? What’s worse when you look back on those trades is that as the loss deepened, the analysis often lost scope which is what you’ve likely focused so much of your trading system development upon. If you’re analysis only matters when you enter a trade but not on your exit, then it’s likely best to step away from your analysis and focus on your exits.

    The opening quote reminds me of something I saw in New York a few years back. While eating breakfast at Norma’s, I saw a $1,000 Frittata which prompted the internal question, “what if someone ordered this without knowing that this was a $1,000 breakfast?” As a trader, I couldn’t help but think that many traders fall into that same trap of approaching a trade without having a clue as to how expensive it may be to their p/l and career.


    The key focus of this article is that without stops, you’re potentially stepping into a financial and emotional trap that you’re likely unable to handle. When the market moves deeply against your trade and you see your losses stacking up, it’s often easier to hope things turn around as your account equity drops. The rest of this article will unpack that statement for you and help you see why stops are more critical than any other part of trading and play perfectly in hand to the truth of trading.

    Why Many Traders Only Pay Lip-Service to Stops

    Many traders could possibly have a larger total profit if they were paid for every time they heard, “cut your losses short, and let your profits run” instead of just banking the profitable trades they’ve closed. In the heat of the moment, this statement is about as effective for traders as “eat less and workout more,” is for dieters. It makes sense but as emotional beings we need more to hang onto for the wisdom to stick.

    Unfortunately, many traders often think they have accepted the risk on the trade when they place a stop, but as soon as they move the stop against their trade, allowing them to lose more, they’ve revealed that they’re dictated by emotions more than a plan. A trading plan with a stop would keep you from staying in a trade that is draining your account equity and should be a focal point of your trading.

    When asked what mistake many novice traders make all too often, Hedge Funder, Bruce Kovner said that, “they trade three to five times too big. They are taking 5 to 10 percent risks on a trade when they should be taking 1 to 2 percent risks… My experience with novice traders is that the emotional burden of trading is substantial; on any given day, I could lose millions of dollars. If you personalize these losses, you can’t trade.” (Emphasis mine). This quote has many nuggets of wisdom but the takeaway should be that if you can’t walk away or cut a bad trade with a stop, you’ll personalize losses and will continue to suffer in your trading. Therefore, when you personalize your losses, you’re likely only paying lip service to stops.

    What Pros Focus On When Choosing Entries & Exits

    There are many effective ways to place stops but just like you shouldn’t worry about where the perfect entry is, you also shouldn’t worry about the perfect stop placement. A common joke in the world of trading is that the perfect stop is one pip away from the corrective high or low against your trade. Of course, if that happens, you’re more likely luckier than good but, nonetheless you should understand what a stop is for and what trader’s with a good track record focus on.

    Learn Forex: A Stop Should Protect Your Capital & Trigger When Price Nullifies Your Trade Idea


    Professional traders will likely focus on the technical points where there trade idea is nullified. This means that if you’re trading based on a 20-day moving average or something a little more complex like Ichimoku, you should exit when the indicator that issues a buy trade now issues a sell trade. Beyond the technical trigger to exit your trade, you should make sure that your trade size is calculated in such a way that when your stop is triggered, you’ve only lost a forgettable amount of your account balance so that you can easily move on to the next trade.

    Without a doubt, pros look for an edge when placing a trade but they’re not overly concerned with the “perfect entry” like many traders who are new to the market do. Instead, many fund managers or large banks will look for a decent edge when the fundamentals and charts combine and then they follow up that trade with a firm protective stop so that they can let the market tell them they’re wrong as opposed to deciding for themselves when they’re wrong.

    The Trick to Money Management

    The trick to money management is doing it. The sad truth of trading is that traders will pay $1,000s for a new trading system guaranteed to pin-point entries but will not pay $15 for a book on placing stops and how to define when they’re stop is no longer correct as per their analysis so that they should be out of the trade and wait for the picture to be clear. One trader did a great service to me in my earlier years by telling me that every trading desk on Wall Street has a risk management department but none has a Profit Forecasting Department. In other words, if you take care of the losses, the profits will take care of themselves and that is why stops are so important.

    Happy Trading!
    ---Written by Tyler Yell, Trading Instructor

    More...

  4. #314
    member ForeCastle's Avatar
    Join Date
    Apr 2013
    Posts
    1,077
    Blog Entries
    236

    A Beginner’s Guide to Understanding the Swiss National Bank

    Talking Points

    • Understanding Any Central Bank
    • Key Economic Mandates of the SNB
    • Future Challenges
    • 2014 Meetings


    As a Forex trader it’s a good idea to get comfortable with major Central Banks and familiarize yourself with their Monetary Policy which can help you develop trade ideas. If you’re new to Forex, but are familiar with the Stock Markets, you can think of a Central Bank Meeting as the Forex equivalent of the Earnings Announcement. When a company announces their earnings, they’ll also get investors excited about upcoming opportunities that the company is looking to capitalize from. Conversely, if you remember 2008-2013, it’s also an ideal time to let investors know that they shouldn’t plan their retirement just yet as the company is facing a few headwinds that will have to be addressed before they can hit their targets as a company. When a Central bank has a monetary policy announcement, they’ll likely discuss what opportunities lie ahead like, how the economy as a whole is looking to capitalize on. For example, such as improving the employment picture or a healthy showing of inflation, or when there are challenges ahead like inflation getting out of hand, that the Central Bank is hoping to keep it contained.

    Understanding a Central Bank

    To get a good grasp of any central bank, it’s helpful to know three things. First, you need to know what economic measure they find important and worth managing as a central bank, also referred to as key mandates. Second, it’s important to know when they are meeting next so that you can manage your trades accordingly. Third, it’s important to know what major undertakings the central bank is involved in which has dramatically affected their currencies value and at some point they may soon unwind which will also have extreme importance to the future value of the currency you’re looking to trade.

    These three elements will be discussed in relation to the Swiss National Bank or SNB, so that you have a clear understanding on how your CHF based trades could be affected by the SNB in your trading future.
    Key Economic Mandates of the SNB

    The SNB has committed to focusing on three economic mandates that will guide their monetary policy decision making going forward. The key mandates are:

    1. Price Stability

    Since 2009, Price Stability of the Swiss Franc or CHF has the key focus of the three mandates to be discussed. The focus was thrust upon them because the CHF has historically be recognized as a financial Safe Haven, so in 2009 when the Euro Crisis began to hemorrhage, billions of dollars, euros, and other currencies flew into Switzerland seeking safety. This caused demand for CHF bonds to fetch higher and higher payment which boosted the value of the CHF to unsustainable levels for the SNB and forced their hand. As an economy that depends on exports, an expensive home currency made CHF-based goods less attractive to foreign buyers which help explains the SNB’s aggressive action of the EURCHF peg. Even in 2014, SNB President Jordan reaffirmed the necessity of the peg for the “foreseeable future”.

    Learn Forex: Price Action That Led to 1.2000 EURCHF Peg


    2. Medium-Term Inflation

    Inflation is a key focus of any central bank and the SNB is no different. When borrowing is low and the economy is struggling, then a central bank will often look to the lower interest rates to boost incentives to borrow, which is often the quickest way to grow the economy. The SNB has recently tracked home prices to gauge domestic inflation majors. When inflation gets out of hand, the SNB will look to raise interest rates to limit inflation from getting out of control. The current inflation target is near 2.0%, however the current readings have been at 0.10% so they’re a good way from the target.

    3. Steering the Interest Rate in the CHF Money Market, using the 3-Month LIBOR

    Steering the interest rate is the key method of controlling inflation to meet the SNB targets. When SNB meets, they often discuss how inflation is progressing and if their hand is pushed due to out of desired range inflation, they may adjust their reference rate. As of early 2014, the reference rate has been near 0.0%

    Future Challenges for SNB

    In recent interviews, SNB President Jordan, has mentioned that the Franc cap, where EURCHF is tied to 1.2000, is a necessary tool for the Swiss economy to thrive going forward. Real estate inflation is beginning to creep up which would normally cause a central bank to raise interest rates, however the periphery economies that trade heavily with Switzerland are still in recovery mode which means that in many ways, the Swiss economy is still in recovery.

    Future, Monetary Policy meetings will likely continue to discuss this dynamic of rising real estate inflation alongside the need for the EURCHF floor staying in place. Lastly, a report in early 2014 came out stating the SNB lost $9.9 Billion due to their massive XAUUSD holdings which dropped 28% in 2013. Any further decline in XAUUSD for 2014 could put further pressure on the SNB’s ability to continue buying foreign currencies in order to keep the EURCHF floor at 1.2000. However, it should be noted that in 2013 the SNB stated that they haven’t had to purchase currencies in order to enforce the EURCHF CAP.

    2014 Swiss National Bank - Monetary Policy Assessment Meetings


    Happy Trading!

    ---Written by Tyler Yell, Trading Instructor

    More...

  5. #315
    member ForeCastle's Avatar
    Join Date
    Apr 2013
    Posts
    1,077
    Blog Entries
    236

    How to Use PPI in Forex Trading

    Talking Points

    • PPI stands for the Producer Price Index.
    • PPI comes out the second week of each month.
    • Forex traders can use PPI as a leading indicator to forecast consumer inflation measured by the Consumer Price Index (CPI)


    In the 1950’s gasoline was $0.27, apartment rent was $42/month and a movie ticket was $0.48. In addition, the US dollar was worth 9 times what is worth now. Inflation reduces domestic buying power and that is why central banks fight so hard to beat back inflation by raising the interest rate. Forex traders are well aware that interest rates are the main driver of currency movement. Investors seek higher yields and will migrate capital from low yielding assets and currencies to high yielding assets and currencies. This is why traders pay special attention to the Producer Price Index because it alerts them to the rise and fall of inflation which could, in turn, lead to a rise and fall of currency rates.


    What is PPI?

    Released monthly in the second week of each month, the Producer Price Index (PPI) is an indicator used to measure the average change in selling price, over time, received for finished goods.Retailers that have to pay more for finished goods may have to pass on higher costs to consumers. This measurement of price change from the view of the seller can be a leading indicator for consumer inflation that is measured by the Consumer Price Index (CPI). PPI examines three production areas; commodity-based, industrial-based, and stage-of-processing-based companies. Released by the Bureau of Labor Statistics, PPI is created using data collected from a mailed survey of retailers selected randomly.

    Traders can see changes in PPI expressed in a percentage change from the previous year or month to month.


    Why Look at PPI?

    Forex traders use the Producer Price Index to find the direction of prices and a measurement of inflation. Rising prices in the form of inflation lowers the purchasing power of a country’s currency because consumers can buy less goods and services for each unit of currency. This decrease in consumer buying power usually triggers a central bank response to raise interest rates. A rising PPI could indicate that consumer prices could rise leading to higher interest rates. The increase in interest rates stimulates the demand for that currency as investors chase yield. This inflow of capital results in a higher exchange rate. On the other hand, a stable or falling PPI insures that interest rates will remain low. This results in a lower relative currency exchange rate. As you can see, using the information found in PPI can give traders an advantage when seeking out strong and weak currencies.

    ---Written by Gregory McLeod Trading Instructor

    More...

  6. #316
    member ForeCastle's Avatar
    Join Date
    Apr 2013
    Posts
    1,077
    Blog Entries
    236

    Using Ichimoku to Help You Catch the Runaway USDCAD Train

    Talking Points
    -Support Is Relative
    -Ichimoku Cloud Provides real-time Trend Support
    -Ichimoku Trade Example with USDCAD’s Bullish Breakout

    USDCAD has the potential to be one of the hottest trades in 2014. When you look at the charts, you can see the opening range of 2014, USDCAD broke out to the upside quite aggressively. While you don’t want to chase price for fear of buying the top, Ichimoku can help you find opportunities to enter the trade in the direction of the overall trade with a favorable risk: reward ratio.

    Support Is Relative

    The market is always moving which makes trading akin to shooting at a moving target. From a trading point of view, it’s important to see when an uptrend could be taking on a small-term correction so that when the overall move appears to be looking to push higher, you can identify an attractive entry. While there are a handful of tools available, the Ichimoku Cloud can be a very helpful tool because the cloud combines mid points of two critical moving averages as well as a 50% point over the last 52 trading periods acting similar to a dynamic Fibonacci level updating on your chart.

    Learn Forex: USDCAD feels like a Runaway Train to 1.10+


    The chart above helps you see some of the potential for USDCAD upside. Of course, the potential trend could run into some difficulties if the taper in the US gets off course due to poor U.S. data but it’s becoming clear that Canada is going the way of Australia in seeking a weaker currency to improve global competitiveness. Fundamentals aside, we can look to Ichimoku and price action to help us see where might be an attractive re-entry point on the trend should the market cooperate which SSI shows that it may do so.

    Learn Forex: SSI Is Showing USDCAD Shorts Continuing To Build Which Argues Trend Resumption


    Ichimoku Cloud Can Provide Real-Time Trend Support

    Ichimoku is a valuable technical tool on any time-frame. Due to my preference for swing trading, 4-hour and Daily are my bread and butter while 1-hour can also bring value for day trading or trades I intend to only hold for a few days out of the trading week. If you look back over the trend that has emerged in USDCAD since October (or roughly 500+ pips ago), you can see the cloud has been helpful in seeing trend impulses and corrections which are helpful to enter back into the trend.

    Learn Forex: USDCAD Potential Re-Entries Based on 4-HR Ichimoku


    Please note that as a technical level of support, Ichimoku cloud will often act as support or show you when a trend is reversing. To see when a trend may be reversing you should see the technical function of the cloud reverse as well. You will be able to tell this when the cloud transforms as price support and into price resistance.

    Learn Forex: Cloud Role Reversal Is a Technically Significant Development - EURAUD


    Ichimoku Trade Example with USDCAD’s Bullish Breakout


    Entry to Buy: 1.0720-1.0803 (Cloud Confluence with 38.2-61.8% Fib Zone)
    Stop: 1.0570 (Beginning Price of Current Impulse)
    Limit: 1.1225 (50% Fib of 2009 – 2011 Range)

    If this is your first reading of the Ichimoku report, here is a definitive guide on the versatile indicator:
    -Full Candle Bodies above the Kumo Cloud
    -The trigger line (black) is above the base line (light blue) or is crossing below
    -Lagging line is above price action from 26 periods ago (Bright green line)
    -Kumo ahead of price is bullish and rising (blue cloud = bullish Kumo)

    USDCAD has the beginning signs of two geographically connected economies with central banks that are showing a clear divergence in Monetary Policy as the Fed committed to begin tapering their QE in December. Recently, the Bank of Canada has begun to sing a different tune. Earlier this week, the BoC Business Outlook Survey voiced consistent worries about the upcoming 12-months for the Canadian economy as domestic demand is weak and 2/3rds of firms surveyed expect CPI inflation to be near 1% which shows a weaker economy which could cause BoC to act in one or more ways to stimulate the economy which could weaken the loonie.

    Just as a refresher, the most recent similarity to monetary policy divergence between two countries with very similar economic drivers has been AUDNZD. If the USDCAD takes on a similar trajectory, you can see how this would be a trend that you’d want to participate in at appropriate levels.

    Learn Forex: Could USDCAD be the New AUDNZD?


    Happy Trading!
    ---Written by Tyler Yell, Trading Instructor

    More...

  7. #317
    member ForeCastle's Avatar
    Join Date
    Apr 2013
    Posts
    1,077
    Blog Entries
    236

    Interest Rate Expectations: The Driver of Forex Rates

    Talking Points

    • Future interest rate expectations take precedence over the headline rate
    • If a country has a high interest rate, but no further increases are expected, the currency can still fall.
    • If a country has a low interest rate but is expected to raise interest rates over time, its currency can still rise


    While it is easy for Forex traders to understand the logic of why investors move money from lower yielding currencies and assets to higher yielding assets and currencies. They may also believe that the simple mechanism of supply and demand is responsible for currency movement. However, this is only part of the story. The expectation of future interest rate increases or rate cuts is even more important than just the actual rates themselves.

    Learn Forex: Rate Expectations Sinking GBPUSD


    For example, the United Kingdom had interest rates that hovered between 4.5 and 4.75% which was much higher than the 3.25% in the United States. Conventional wisdom would dictate that GBPUSD should have went up during this time period. However, as seen in the chart above, this was clearly not the case as GBPUSD headed lower. The reason for this was the expectations that the US Federal Reserve would begin a rate tightening cycle. The 250 basis point premium enjoyed in the UK at the beginning of 2005 narrowed to just 25 basis point difference. The Fed raised the interest rate from 3.25% in December 2004 to 6.00% by May of 2006.

    If a central bank decides to one day, hike rates and then say that they are through raising rates for the foreseeable future, then a currency can still sell off though the interest rate was raised.

    On the other hand, if a central bank begins to aggressively raise interest rates to curb inflation and inflation remains stubbornly high, investors around the world realize that there is nowhere for rates to go but up. The currency of that nation may continue to rise as expectations for more rate hikes become widely anticipated.

    Learn Forex: NZD/USD Uptrend with Interest Rate Increases


    In the example above, NZDUSD rose 57% as the Reserve Bank of New Zealand continued to raise rates. From 2002 to 2005 the RBNZ raise interest rates from 4.75% to 7.25% while the Fed increased rates from 1.73% to 4.16% over the same period. Investors in search of higher yields trade the low yielding dollar for the higher yielding NZD. The result was NZDUSD rallying 57%.

    If the chances that interest rates can be raised in the future is near zero, investors will want to look elsewhere for a country whose rates are rising. The market is a discounting mechanism which means favorable news, like interest rate hikes are already built into the price. To continue to offer value, there must be an indication that rates will continue to rise to justify the inflated price in the currency. Without any expectations of a rate rise, there is little incentive for new investors to enter or for past investors to remain.


    On the other hand, extreme levels of interest rates can shift and move interest rate expectations in the opposite direction because investors believe that interest rates may revert back to the mean. Much like a rubber band stretching to extremes and snaps back, interest rates behave in a similar manner. The extreme interest rates of the 1980’s in the U.S. that topped out at 20% saw a snap back toward 3% in the 1990’s. The extreme low interest rates around the world following the Global Financial Crisis of 2008 may revert back to the mean which is much higher than current 3%. The bottom line is that Forex traders have to not only watch the headline currency rate, but they also have to monitor interest rate expectations in order to keep themselves on the right side of the trade.

    ---Written by Gregory McLeod Trading Instructor

    More...

  8. #318
    member ForeCastle's Avatar
    Join Date
    Apr 2013
    Posts
    1,077
    Blog Entries
    236

    Strong & Weak: 2 Reasons to Buy Yen

    Talking Points:
    -Japanese Yen (JPY) moves from the weakest to the middle of the pack in possibly a trend change move
    -USD to Yen price pattern suggests lower lows in the weeks ahead
    -Buy Japanese Yen Currency Basket (enroll for demo account at the same link)

    When analyzing the pricing of several currency pairs in relation to their 200 period simple moving average on a 4 hour chart, many of the prices are in the neutral zone. The neutral zone means the prices are close to this trend defining moving average level. Therefore, some of the trends of calendar year 2013 are at risk of reversing.
    Using the strong weak analysis below, it appears the Japanese Yen has strengthened considerably in the past couple of weeks and patterns suggest Yen strength may be around for the weeks ahead. These are our two reasons for wanting to buy the single Yen currency.

    As a result, we will look to buy the Japanese Yen against a basket of currencies using the Mirror trader platform.

    Forex Strategy: Matching Strong versus Weak

    Currency Up Arrows Down Arrows Change From Last Report
    NZD 7 Higher 3 rankings
    GBP 5 1 Lower 1 ranking
    EUR 2 1 Lower 1 ranking
    USD 2 2 Lower 1 ranking
    AUD 2 2 Higher 3 rankings
    JPY 2 2 Higher 4 rankings
    CHF 1 6 Lower 2 rankings
    CAD 7 Lower 2 rankings


    According to our Strong/Weak analysis and resulting chart above, the Yen has increased four positions higher from the weakest currency to the middle of the pack in the past two weeks. This large move could be indicative of at least a temporary trend change for the Japanese Yen suggesting the Yen may further strengthen.

    In fact, we previously wrote about two patterns in the USD/JPY pair that suggest deeper retracements lower may be on the horizon for the pair. The pair has currently stayed below 106 resistance leaving the two patterns in place as a possible explanation for the move.

    Executing the Trade

    Since we anticipate the JPY may experience a broad based rally, we will take a diversified approach and buy the single currency against a basket of currencies. There are several advantages to trading a currency rather than a pair with the largest benefit being diversification.

    We will initiate a JPY Buy Basket trade through the Mirror platform. You can even try this out in a practice account at the same link above.

    We will look to risk 2.0% on the trade for a minimum profit objective of 4%.

    Good luck with your trading!
    ---Written by Jeremy Wagner, Head Trading Instructor, DailyFX Education

    More...

  9. #319
    member ForeCastle's Avatar
    Join Date
    Apr 2013
    Posts
    1,077
    Blog Entries
    236

    The Definitive Guide to Scalping, Part2: Currency Pairs

    Talking Points

    • Forex Scalpers should always identify market conditions before trading
    • Factor in the spread to reduce transaction costs
    • Consider liquidity when trading to maximize trading


    Scalpers are continuously faced with choices and tough decisions when trading Forex. On a day to day basis however, none is as important as deciding which currency pair to trade. Choosing a currency not only will affect the strategy we choose but ultimately our profitability as well. So today we will review two key factors that need to be evaluated prior to implementing your favorite scalping strategy.


    Spreads and Cost

    Spreads and costs should be on every trader’s minds, but they are particularly important to scalpers. Since scalpers tend to favor high frequency strategies, this means they will incur the spread more often than their average positions trader. So throughout the trading year, to keep costs down scalpers should gravitate to pairs with lower spreads. Let’s look at an example.
    Above we can see the effects of trading a currency with a lower spread by comparing two yen pairs. First we have the USDJPY with a 1.1 pip spread compared to the NOKJPY with a 5.5 pip spread. Being Yen pairs at some point a trader may have to decide between the two pairs above. However when looking at spreads it should make this decision considerably easier. It costs more to trade the NOKJPY! Traders save approximately $44 in spread costs per 100k transaction trading the USDJPY!
    For a complete list of spreads at FXCM, click the link embedded HERE.

    Liquidity

    Next when choosing a currency pair it is also important to consider liquidity. Liquidity in Forex is easily defined as the amount of currency quoted at any specific price point. Scalpers should value liquidity because it will ultimately coincide with the ease we enter and exit the market.

    From a traders perspective, illiquid markets are known to be volatile and are more prone to market gaps based off of fewer buyers and sellers present in the market place. This happens since every buyer must transact with a seller, and the further they are off in regards to price the more a pair is prone to jump while exposing scalpers to slippage. This is compared to a deep market where there is a breath of market volume at multiple pricing points. With more liquidity available we increase the ease that we can enter and exit the market because more buyers and sellers are readily available to cross a scalper’s transaction.


    Currency Pairs

    Now that you know what to look for it’s time to narrow the field of potential pairs for scalping. Out of 56 different pairs offered at FXCM, traders should consider scalping pairs comprised of the G8 currencies shown above or one of the Forex Majors pictured below. These pairs are comprised of the most frequently traded currencies in the world which helps when it comes to factoring in both spreads and liquidity.

    Now that you are a little more familiar with the best currency pairs for scalping, we can now begin to look at the technical aspect of trading. Join me next week as we begin to evaluate charts and price action for Forex scalpers.


    ---Written by Walker England, Trading Instructor

    More...

  10. #320
    member ForeCastle's Avatar
    Join Date
    Apr 2013
    Posts
    1,077
    Blog Entries
    236

    The Key Levels of EURUSD That Every Trader Should Know

    Talking Points
    -EURUSD Uptrend since June 2012 Looks Tired
    -Elliott Wave is shows a potential Rising Correction near Exhaustion
    -The Key Technical indicators That Point to 1.3550 As Critical Support

    Even if the Forex market is full of interesting set-ups in USDCAD or other less discussed pairs, no trader wants to be without a grasp of EURUSD. After all, EURUSD houses the currencies of the two largest global economies and the capital flow alone between these two is like no other FX Pair out there. Recent price action has left many traders feeling like this pair will never drop below 1.3500 again but a few technical developments could begin to shift the overall bias firmly to the downside.
    EURUSD Uptrend Since June 2012 Looks Tired

    Learn Forex: EURUSD Move Hire Is Corrective Under 2008 Trendline


    The EURUSD chart above should show you a few things. First, since 2008 when EURUSD topped off at 1.60369 only to drop by 3,700 pips in 15 wild weeks in 2008-2009 down to 1.2389, the pair hasn’t made must progress in either direction. Second, if you’re comfortable with the Elliott Wave Principle, you can see that this lack of progress with labels attached describing the last 5-years of price action as corrective in nature or put another way, trend ready. Third, the trendline drawn from the highs of 2008 & 2011 show price is pushing into resistance whereas a break to the topside would be very bullish and bring EURUSD to the mid-to-upper 1.4000s or if the chart trendline is honored then the next big figure to crack will be 1.3000 on the downside rather than 1.4000 on the topside.

    Elliott Wave Is Showing a Potential Rising Correction About To Turn Lower

    If you’re new to Elliott Wave, the first misconception that should be cleared up is that Elliott Wave brings about absolute certainty in any future market move. In fact, Elliott Wave is a great way to the probabilities of different price action possibilities. However, to prevent you from jumping in front of a move, it’s often helpful to have price triggers to see that your analysis may in fact be unfolding as you presumed it would. Of course, as discussed in The Truth Of Trading, what’s more important is that you have identified key points where you analysis is deemed incorrect so as to get you out of a trade so that you’re not riding a trade on hope alone.

    EURUSD Elliott Wave Shows Probability for Lower Price Action


    Within Elliott Wave, the market is either moving in two directions, impulsive or corrective. As the name implies, an impulsive move is one that will usually occupy the headlines of DailyFX as it signifies a stronger trend relative to past price action on the pair. The antithesis of an impulse is a corrective move. A corrective move, is sluggish in character and will often unfold in 3-waves against the trend within a Fibonacci relationship. As you can see above, the current top, although only time will tell us if it is ‘the top’ for now, is 0.618% of 2011-2012 range in EURUSD.

    Learn Forex: Fibonacci Expansion Targets Show EURUSD Has the Potential to Move Much Lower


    Beyond understanding corrective price action, Elliott Wave is useful in helping us gauge potential price targets through Fibonacci Expansions. The more common expansions that are sought to define price targets are the 61.8% expansion (where the second impulse travels 61.8% of the first impulse), 76.4%, 100%, 127.2% & 161.8%. As a trader who prefers to look for confluence, when a Fibonacci retracement aligns with a Fibonacci expansion, then you have a higher degree probability profit target. On this long-term chart with Monthly Oscillators displayed, you will recognize 3 different Fibonacci level confluences.

    The Key Technical Indicators That Point To 1.3550 as Critical Support

    Now that you’ve seen what’s possible as according to Elliott Wave and Fibonacci targets, let’s discuss some technical levels that will need to give before this view of a major leg lower takes form. As a Trader of any market, it’s helpful to see a building up of your trading idea through breaks of support in an impulsive downtrend or resistance in an uptrend. With respect to EURUSD, the initial level that will need to give to begin the bearish / selling argument is 1.3530.

    Learn Forex: The Many Indicators Pointing to the Importance of 1.3550/30 as Support


    Once again, the breaking of the 1.3550 level only contributes to the arguments that the price touched on Dec. 27th of 1.3895 may in fact be a top but does not guarantee it. Therefore, the next key question to ask would be, “If this level gives way, where should I place a stop to protect me from upside risk?” To answer that question, it is best to look at the most recent pivot in price which took place near the 21-day moving average which is currently at 1.3675.

    Closing Thoughts

    EURUSD has the potential to be another big mover off the back of the potential US DOLLAR comeback. As EURUSD makes its way out of the 2014 opening range, a break below 1.3550 as discussed in this article could bring an opportunity for lower prices but to keep our risk under control, you should look to keep a stop around the nearest lower high in price around 1.3675.
    Happy Trading!
    ---Written by Tyler Yell, Trading Instructor

    More...

Page 32 of 43 FirstFirst ... 22 30 31 32 33 34 42 ... LastLast

LinkBacks (?)

  1. 10-09-2013, 09:11 PM

Tags for this Thread

Bookmarks

Posting Permissions

  • You may not post new threads
  • You may not post replies
  • You may not post attachments
  • You may not edit your posts
  •