Page 42 of 43 FirstFirst ... 32 40 41 42 43 LastLast
Results 411 to 420 of 430
Like Tree6Likes

Forex Strategies

This is a discussion on Forex Strategies within the Trading Systems forums, part of the Trading Forum category; What is a spread in forex trading? Every market has a spread and so does forex. A spread is simply ...


  1. #411
    member ForeCastle's Avatar
    Join Date
    Apr 2013
    Posts
    1,077
    Blog Entries
    236

    What Does a Forex Spread Tell Traders?

    What is a spread in forex trading?

    Every market has a spread and so does forex. A spread is simply defined as the price difference between where a trader may purchase or sell an underlying asset. Traders that are familiar with equities will synonymously call this the Bid: Ask spread.

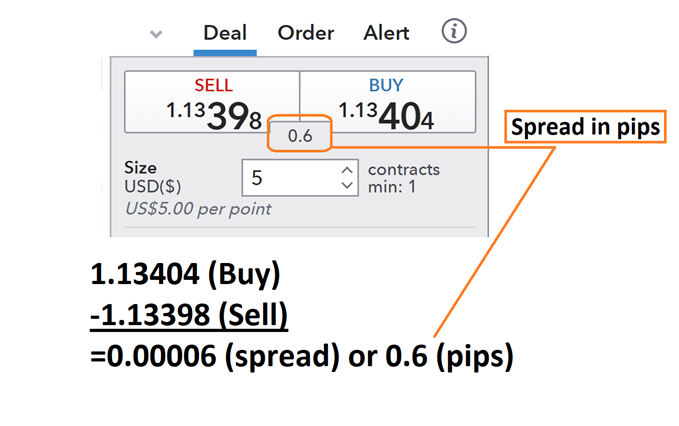
    Below we can see an example of the forex spread being calculated for the EUR/USD. First, we will find the buy price at 1.13398 and then subtract the sell price of 1.3404. What we are left with after this process is a reading of .00006. Traders should remember that the pip value is then identified on the EUR/USD as the 4th digit after the decimal, making the final spread calculated as 0.6 pips.


    How to calculate the forex spread and costs

    Before we calculate the cost of a spread, remember that the spread is just the ask price less (minus) the bid price of a currency pair. So, in our example above, 1.13404-1.13398 = 0.00006 or 0.6 pips.

    Using the quotes above, we know we can currently buy the EUR/USD at 1.13404 and close the transaction at a sell price of 1.13398. That means as soon as our trade is open, a trader would incur 0.6 pips of spread.

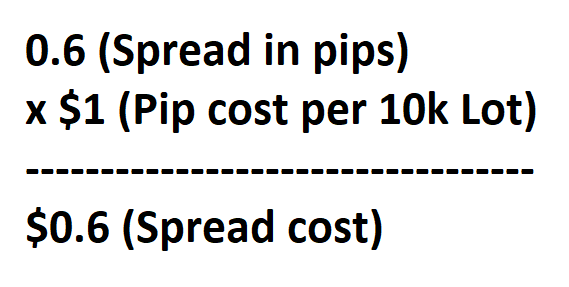
    To find the total spread cost, we will now need to multiply this value by pip cost while considering the total amount of lots traded. When trading a 10k EUR/USD lot, you would incur a total cost of 0.00006 (0.6pips) X 10,000 (10k lot) = $0.6. If you were trading a standard lot (100,000 units of currency) your spread cost would be 0.00006pips (0.6pips) X 100,000 (1 standard lot) = $6.

    If your account is denominated in another currency, like GBP, you would have to convert it to US Dollars.


    Understanding a high spread and a low spread

    It’s important to note that the FX spread can vary over the course of the day, ranging between a ‘high spread’ and a ‘low spread’.

    This is because the spread can be influenced by multiple factors like volatility or liquidity. You will notice that some currency pairs, like emerging market currency pairs, have a greater spread than major currency pairs. Your major currency pairs trade in higher volumes compared to emerging market currencies, and higher trade volumes tend to lead to lower spreads under normal conditions.

    High spread

    A high spread means there is a large difference between the bid and the ask price. Emerging market currency pairs generally have a high spread compared to major currency pairs.

    Low spread

    A low spread means there is a small difference between the bid and the ask price. It is preferable to trade when spreads are low like during the major forex sessions. A low spread generally indicates that volatility is low and liquidity is high.

    Keeping an eye on changes in the spread

    News is a notorious time of market uncertainty. Releases on the economic calendar happen sporadically and depending if expectations are met or not, can cause prices to fluctuate rapidly. Just like retail traders, large liquidity providers do not know the outcome of news events prior to their release! Because of this, they look to offset some of their risk by widening spreads.

    Spreads can cause margin calls

    If you are currently holding a position and the spread widens dramatically, you may be stopped out of your position or receive a margin call. The only way to protect yourself during times of widening spreads is to limit the amount of leverage used in your account. It is also sometimes beneficial to hold onto a trade during times of spread-widening until the spread has narrowed.

    more...
    Premium Trading Forum: subscription || The Forex Guide to Fundamentals Fundamentals
    Trading blogs || My blog

  2. #412
    member ForeCastle's Avatar
    Join Date
    Apr 2013
    Posts
    1,077
    Blog Entries
    236

    Oil Price Outlook: Bearish Breakdown

    The impact from Trump tariffs and deteriorating US China trade relations in addition to several other downside risks to global GDP growth have sent crude oil on a 16.5 percent nosedive over the month of May – and prices could still head lower. Market sentiment, as well as oil demand and prices, threaten to deteriorate further considering the barrage of high-impact economic events and data releases next week which look to provide the latest health check on risk appetite and could further spark cross-asset volatility.

    Forex Strategies-oil0106new.gif

    Recent crude oil carnage could be curbed, however, if the fundamental backdrop for global growth improves on the back of upbeat data or trade war rhetoric. Strength in the US economy may shine and inspire investor confidence if leading indicators like the ISM manufacturing and services PMI readings surprise to the upside. Although, markets are likely still digesting the looming effect from the US slapping a 5 percent tariff slapped onto all Mexican goods exports with any whiff of downward global GDP growth revisions risking more downside in oil.

    According to the latest CFTC Commitment of Traders data, net oil futures positioning shows a reduction in net short positioning as the volume of commercials longs outpaced that of shorts for the last 5 weeks. The bullish bets from commercial hedgers could provide crude oil prices with a bit of buoyancy, but it is noteworthy that non-commercial speculative futures traders have grown increasingly bearish over the last month as prices spiral lower.

    more...
    Premium Trading Forum: subscription || The Forex Guide to Fundamentals Fundamentals
    Trading blogs || My blog

  3. #413
    member ForeCastle's Avatar
    Join Date
    Apr 2013
    Posts
    1,077
    Blog Entries
    236

    Bollinger Bands® and MACD Strategy

    Bollinger Bands® can provide invaluable signals for technical traders, and when combined with the Moving Average Convergence Divergence (MACD) indicator, gives traders insight into both volatility and momentum in the forex market.

    Forex Strategies-xauusd-w1-fx-choice-limited.png


    What is the Bollinger and MACD Combination?

    As the title suggests, traders can make use of Bollinger Bands® in conjunction with MACD to support trade set ups. Bollinger Bands® allow traders to view the cyclical nature of volatility while the MACD is an effective trend-following, momentum indicator.

    Forex Strategies-usdcad-d1-fx-choice-limited.png


    Using these two indicators together can assist traders when making higher probability trades as they can gauge the direction and strength of an existing trend, along with volatility. As a result, traders can use the MACD to assess if a trend is picking up in momentum or slowing down and setting up for a possible breakout; while the Bollinger Band® can be used as an entry trigger and subsequent confirmation of a trade.

    How to Use Bollinger Bands® and MACD to Trade Forex


    Traders can trade with Bollinger Bands® and MACD in a number of different ways but two of the most common ways to trade with these two indicators involve breakouts and trend trading.

    The MACD indicator supports the bullish trade as the MACD line has crossed the signal line and continues to move above the signal line, showing strong upward momentum. The Bollinger Band® then confirms the move to the upside as price begins to “walk the band” on increased volatility (expansion of the band).

    Stops can be placed below the lower Bollinger Band® or at the low of the descending channel. Targets can be placed at a previous high or significant level of resistance - while maintaining a positive risk to reward ratio. Since there is a possibility that the breakout trade turns into a trend reversal, traders should consider multiple target levels and manually move stops up or utilize a trailing stop.

    more...
    Premium Trading Forum: subscription || The Forex Guide to Fundamentals Fundamentals
    Trading blogs || My blog

  4. #414
    member BrokersMinutes's Avatar
    Join Date
    Jun 2013
    Posts
    534
    Blog Entries
    236

    USD/MXN - weekly/monthly bullish breakout; daily correction

    • After printing a multi-decade high at the start of the week, USD/MXN has slumped.
    • Mexican Peso interest rate differential remains attractive against the USD.

    Forex Strategies-usdmxn-d1-jafx-ltd.png


    USD/MXN traded at just under 25.50 on Monday, its highest level in decades before making a sharp reversal and falling for three straight days. The sell-off was driven by news that in the US, the USD2 trillion coronavirus rescue package was finally being approved, weakening the greenback. While the US dollar remains the safe-haven asset of choice, the massive US liquidity interventions of late will eventually drive the US dollar lower, with higher yielding currencies like the Mexican Peso likely to benefit. While both countries have cut interest rates lately, the Fed rate currently sits at 0.00% to 0.25%, while the Mexican interest rate is at 6.5%, a substantial yield pick-up over the greenback.

    more..

    Trading Blogs || My blog

  5. #415
    member TheNews's Avatar
    Join Date
    Feb 2013
    Posts
    7,383
    Blog Entries
    1032

    USD/MXN Outlook: Downside Pressure Continues

    Forex Strategies-usdmxn-w1-cryptorocket-limited.png


    This week has brought another round of down-pressure for USD/MXN, which has seen the US Dollar fall 4% against the Mexican Peso, breaking the symmetrical triangle pattern and resting around the 22.90 mark. Broad-based Dollar weakness and risk-on sentiment dominated the first half of the week on the back of a possible drug to fight Covid-19.

    more...
    Analytics and News section || Trading News Events thread
    Trading blogs || My blog

  6. #416
    Senior Member Taylor Woods's Avatar
    Join Date
    Jan 2019
    Posts
    299
    Forex traders need to invest in appropriate research to adopt and execute their specific trading strategies. By studying the market as it should be, you can shed light on market trends, the timing of entry/exit, and the effects of fundamentals. In the forex market, the trader also should know about different pairs and how they work in order to succeed in the market.

  7. #417
    member TheNews's Avatar
    Join Date
    Feb 2013
    Posts
    7,383
    Blog Entries
    1032

    USD/MXN - daily bear market rally

    As markets continue to monitor Covid-19 cases, the Mexican Peso is able to contain some of the losses

    more...
    Analytics and News section || Trading News Events thread
    Trading blogs || My blog

  8. #418
    member TheNews's Avatar
    Join Date
    Feb 2013
    Posts
    7,383
    Blog Entries
    1032

    Gold 1Q 2021 Forecast

    While the 1Q’21 gold price outlook is bullish, there are some caveats – mainly, that gold may not be the best performing metal, precious or otherwise.

    more...
    Analytics and News section || Trading News Events thread
    Trading blogs || My blog

  9. #419
    Member Ace Trader Pro's Avatar
    Join Date
    Dec 2020
    Location
    South East Asia
    Posts
    98
    Blog Entries
    1

    Heiken Sar MACD Strategy

    This trading strategy utilized 4 standard indicators that comes with Metatrader 4.

    1) Heiken Ashi (default setting, use green for bullish, orangeRed for bearish)
    2) Parabolic Sar ( Step : 0.02, Max : 0.6)
    3) Moving Average (100 period, Exponential)
    4) MACD (default setting)

    For buy signal :

    Heiken Ashi (green) close above 100 MA, Parabolic Sar changed direction to buy signal. We get the confirmation from MACD where the MACD histogram move above 0 level.


    The example chart of EURUSD 1 hr chart illustrate the strategy buy condition :

    Forex Strategies-eurusdh1_hsm_buy_signal.png

    For sell signal :

    Heiken Ashi (red) close below 100 MA, Parabolic Sar changed direction to sell signal. We get the confirmation from MACD where the MACD histogram move below 0 level.

    The example chart of USDCAD 1 hr chart illustrate the strategy sell condition :

    Forex Strategies-usdcadh1_hsm_sell_signal.png

    For this strategy, the exit condition either buy fix pips or close position when the Parabolic Sar change direction. It is depends on individual risk involvement.

    I didn't try on other timeframe but lower time frame may work.

    This strategy also worth looking to turn into expert advisor.

  10. #420
    member TheNews's Avatar
    Join Date
    Feb 2013
    Posts
    7,383
    Blog Entries
    1032

    US Dollar Forecast

    Forex Strategies-dxy-w1-alpari.png


    The US Retail Sales report may generate a bullish reaction in the Dollar as the update is expected to show a pickup in household spending.

    more...
    Analytics and News section || Trading News Events thread
    Trading blogs || My blog

Page 42 of 43 FirstFirst ... 32 40 41 42 43 LastLast

LinkBacks (?)

  1. 10-09-2013, 09:11 PM

Tags for this Thread

Bookmarks

Posting Permissions

  • You may not post new threads
  • You may not post replies
  • You may not post attachments
  • You may not edit your posts
  •