Page 33 of 43 FirstFirst ... 23 31 32 33 34 35 ... LastLast
Results 321 to 330 of 430
Like Tree6Likes

Forex Strategies

This is a discussion on Forex Strategies within the Trading Systems forums, part of the Trading Forum category; Talking Points: Price Action is a form of technical analysis devoid of indicators Traders can trade price action in isolation, ...


  1. #321
    member ForeCastle's Avatar
    Join Date
    Apr 2013
    Posts
    1,077
    Blog Entries
    236

    The Three Tenets of Price Action

    Talking Points:

    • Price Action is a form of technical analysis devoid of indicators
    • Traders can trade price action in isolation, or in addition to existing indicators and strategies
    • We look at three of the most important aspects of Price Action Analysis


    As traders, our job is not easy.

    By opening a trade with the anticipation of profit, we are essentially trying to predict the future. And human beings can’t predict the future, so the very nature of our goal is somewhat of a conundrum.

    This is where technical analysis can come into play. By observing the way that prices have moved in the past, we may be able to get an idea for the way that prices may move in the future.

    Price action can be a valuable tool for the trader. The benefits of price action are numerous, and we looked at some of the highlights in the article Four Simple Ways to Become a Better Price Action Trader.

    In this article, we’re going to discuss three of the most pertinent themes of the study of price action.

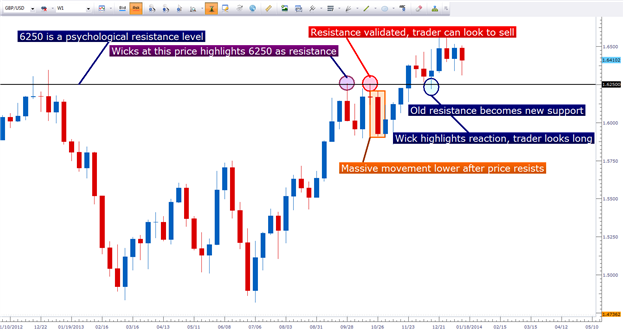
    Tenet #1 Old support can become new resistance, and old resistance can become new support

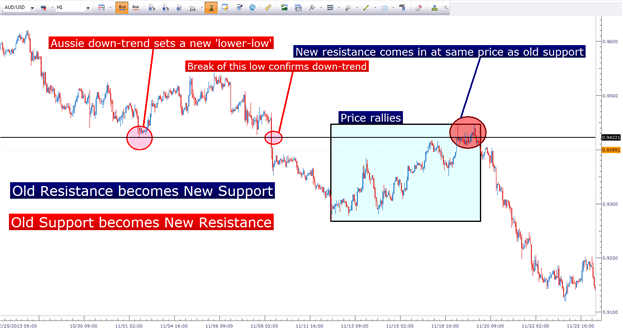
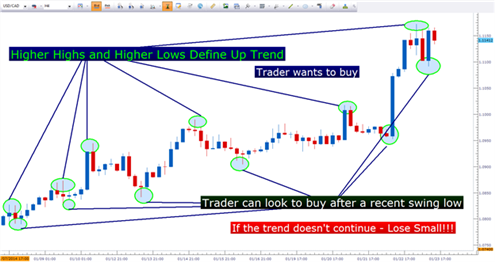
    One of the greatest aspects of price action is that its logical. Trends rarely develop in a straight line… usually an up-trend is a series of higher-highs, and higher-lows; while down-trends are often series of lower-lows, and lower-highs.

    More interesting is the fact that in an up-trend, as prices are making higher-highs and higher-lows; the resistance from the previous ‘higher-high,’ can, in many cases, become a similar price level for the next ‘higher-low.’
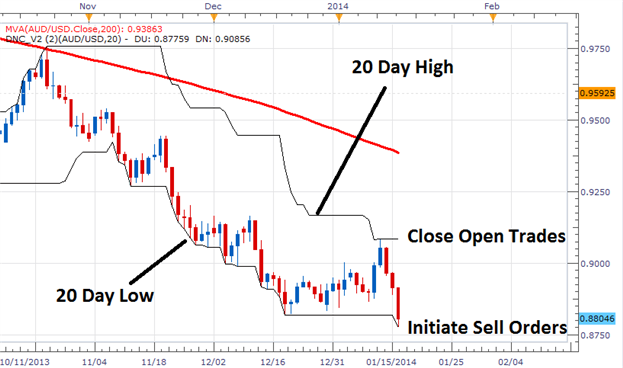
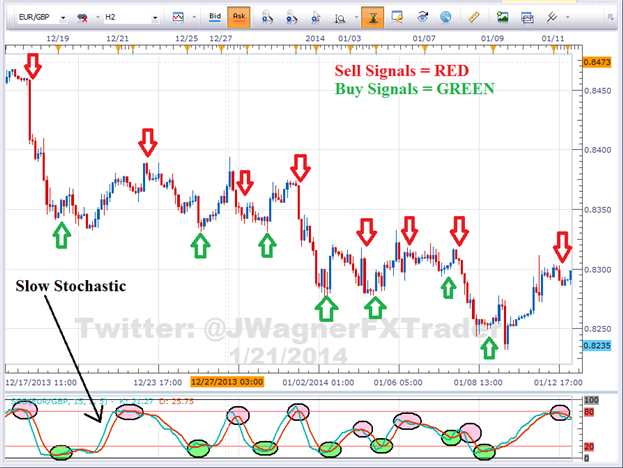
    In essence, previous resistance has become new support when prices are trending higher. Let’s take a look at the recent down-trend in the Aussie-dollar as an example:


    Tenet #2 The past cannot predict the future, but it can help work with probabilities

    One of the inherent difficulties of technical analysis is that the past is not always going to be indicative of the future.
    Things change…trends reverse… and new information finds its way into the market at a break-neck pace.
    One of the allures of price action is that it’s one of the cleanest ways to perform technical analysis. Price action doesn’t purport to tell us anything other than the cleanest interpretation of what has happened in the past (and I call this the cleanest because there is no mathematical function introducing lag into our technical analysis).

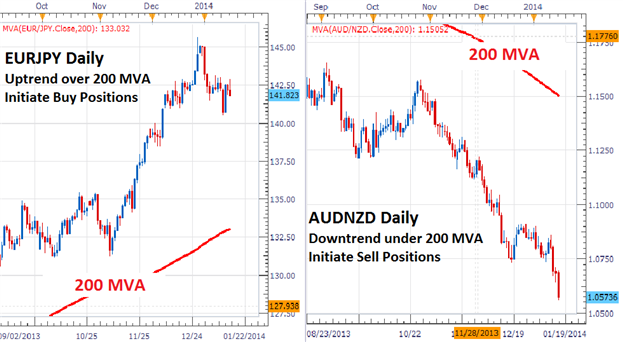
    So, we can look to buy up-trends cheaply, or to sell down-trends expensively in the effort to get the probabilities on our side as much as possible.

    If we see that the Aussie is trending lower or that the Sterling is trending higher – it’s not enough to simply buy or sell and ‘hope’ that profit produces itself. We need to be tactical in an effort to avoid The Number One Mistake that Forex Traders Make (looking for advantageous risk-reward ratios).

    We outlined this approach from the perspective of a swing-trader in the article The Four-Hour Trader, a Full Trading Plan.
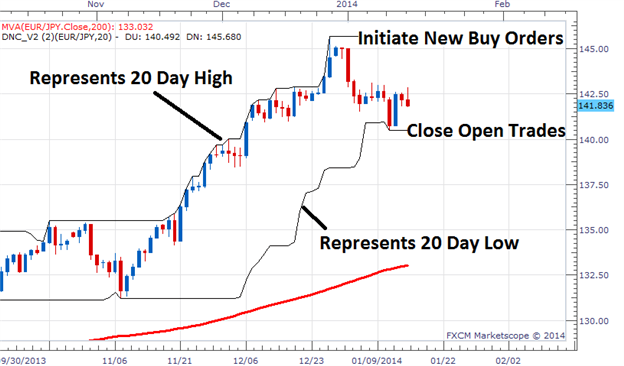
    Traders can use price action to look to buy up-trends cheaply, or sell down-trends expensively


    While looking for risk-efficient entries won’t help you tell the future any better, it can mitigate the damage from the trades in which you are incorrect, while looking to maximize the benefit when you are on the correct side of the move.

    Tenet #3 Price levels matter

    As human beings, we can’t help but think in round numbers…

    For example, if I ask someone how much they paid for their automobile, they’d likely round the amount up or down to give me an even number. As in, most human beings won’t respond with an exact dollar and cents amount… they’ll often just say ’39 grand,’ or maybe something like ‘40k,’ but rarely will someone respond with an amount like $39,256.23.

    The reason is because, as human beings – most of us wouldn’t care about the $256.23 in the response… we just wanted a ‘ballpark’ type of answer, and as people we value simplicity.
    This comes into trading as well.

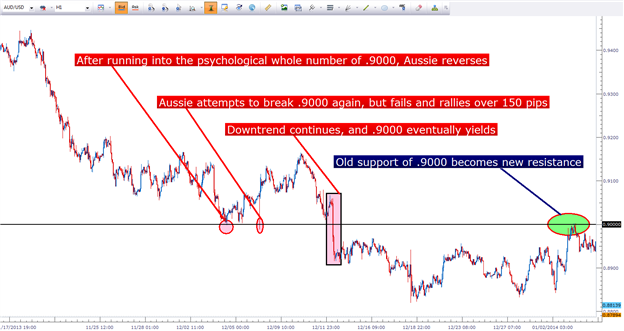
    Many traders will place stops or limits around whole numbers; like the price of .9000 on AUDUSD. And when the price on Aussie ripped down to .9000, those sitting orders changed the order flow (and the price) massively.


    Notice that on two separate attempts, price reversed at the .9000 level; and on the third attempt support of .9000 eventually yields as the down-trend in Aussie continues.

    And shortly thereafter, old support of .9000 became new resistance.

    -- Written by James Stanley

    More...

  2. #322
    member ForeCastle's Avatar
    Join Date
    Apr 2013
    Posts
    1,077
    Blog Entries
    236

    How Forex News Traders Use ISM Numbers

    Talking Points

    • The Institute for Supply Management (ISM) was founded in 1915 and is the first supply management institute in the world.
    • Servicing 40,000 business professionals in more than 90 countries, ISM focuses on supply chain management.
    • Forex traders rely heavily on ISM’s release their Purchasing Managers Index (PMI) on the first business day of each month to gauge economic growth.


    NZDUSD M5 : 17 pips prrice movement by USD ISM Manufacturing PMI :

    Forex Strategies-nzdusd-m5-metaquotes-software-corp-17-pips-prrice-movement-.png


    What is ISM?

    A country’s economy is as strong as its supply chain. The Institute for Supply Management (ISM) measures the economic activity from both the manufacturing side as well as the service side. Formed in 1915, ISM is the first management institute in the world with over 40,000 members in 90 countries. Since it can draw from information gathered from the surveying its large membership of purchasing managers, the ISM economic news releases are carefully watched by Forex traders around the world as a reliable guide to economic activity.


    ISM Surveys

    ISM publishes three surveys; manufacturing, construction, and services. Published on the first business day of the month, the ISM Purchasing Managers Index (PMI) is compiled from surveys of 400 manufacturing purchasing managers. These purchasing managers from different sectors represent five different fields; inventories and employment, speed of supplier deliveries, production level, and new orders from customers.

    XAUUSD M5 : 3345 pips price movement by USD - ISM Non-Manufacturing PMI news event :

    Forex Strategies-xauusd-m5-metaquotes-software-corp-3345-pips-price-movement-.png


    In addition, ISM construction PMI is released on the second business day of the month, followed by services on the third business day. Forex traders will look to these releases to determine the risks at any given time in the market.

    EURUSD M5 : 37 pips price movement by USD - ISM Non-Manufacturing PMI news event :

    Forex Strategies-eurusd-m5-metaquotes-software-corp-37-pips-price-movement-.png


    Forex Market Impact

    The Manufacturing and Non-manufacturing PMI’s are big market movers. When these reports come out at 10:30 AM ET, currencies can become very volatile. Since these economic releases are based on the previous month’s historical data gathered directly from industry professionals, Forex traders can determine if the US economy is expanding or contracting.

    Forex traders will compare the previous month’s number with the forecasted number that economists have published. If the released PMI number is better than the previous number and higher than the forecasted number, the US dollar tends to rally. This is where fundamental and technical analysis comes together to create a trade setup.

    AUDUSD M5 : 21 pips price movement by USD - ISM Non-Manufacturing PMI news event :

    Forex Strategies-audusd-m5-metaquotes-software-corp-21-pips-price-movement-.png


    In the example above, notice how the better than expected PMI number triggered a US dollar rally against the Euro. As seen in the chart above of the EURUSD, the ISM Non-Manufacturing was not only above 50 but at 55.4, beat the forecasts calling for a drop from 54.4 to 54.0.

    When an economic release beats expectations, like in the example above, sharp fast moves can result. In this case, EURUSD dropped 22 pips in 15 minutes. Traders often choose the Euro as the “anti-dollar” to take advantage of capital flows between two of the largest economies.

    The Euro zone has a large liquid capital markets which can absorb the huge waves of capital seeking refuge from the U.S. So a weak US ISM Non-Manufacturing number usually leads to a dollar sell-off and a rise in the Euro. Another scenario is when the number released is in line with forecasts and/or unchanged from the previous month, then the US dollar may not react at all to the number.

    AUDUSD M5 : 32 pips prrice movement by USD ISM Manufacturing PMI :

    Forex Strategies-audusd-m5-metaquotes-software-corp-32-pips-price-movement-.png


    Overall, an ISM PMI number above 50 indicates that the economy is expanding and is healthy. However, a number below 50 indicates that the economy is weak and contracting. This number is so important that if the PMI is below 50 for two consecutive months, an economy is considered in recession.

    PMI’s are also compiled for Euro zone countries by the Markit Group while US regional and national PMIs are compiled by ISM. As you can see, traders have good reason to pay special attention to the important releases from the Institute of Supply Management.

    ---Written by Gregory McLeod Trading Instructor

    More...

    ===================

    Trading the News - Economic Numbers - ISM Manufacturing

    A lesson on what this indicator is and what it tells us about the manufacturing sector of the economy as well as its status as a leading indicator of overall economic conditions.


  3. #323
    member ForeCastle's Avatar
    Join Date
    Apr 2013
    Posts
    1,077
    Blog Entries
    236

    A 3 Step Trading Plan for Channel Breakouts

    Talking Points:

    • First find the trend to determine the trend
    • Learn to enter Forex breakouts using Donchian Channels.
    • Channels can be used to trail your stop and lock in profit.


    The Forex market is known for its strong trends, which can make trading breakouts of support and resistance levels an effective approach to the markets. To plan for such market conditions, today we will review a three step breakout strategy using the Donchian Channels.
    Let’s get started!

    Find the Trend

    The first step to trend trading is to find the trend! There are many ways to identify the trends depicted below, but one of easiest is through the use of the 200 period MVA (Moving Average). To begin add this indicator to your chart, and then see if price is above or below the average. This is how we will determine the trend and our trading bias.

    Given the information above, traders should look for opportunities to buy the EURJPY in its current uptrend as price is above the average. As well, the AUDNZD pictured below offers selling opportunities since the pair is priced under the 200 period MVA. Once we have this information, then we can plan entry placements for a potential breakout.

    Learn Forex – Daily Charts & 200 MVA


    Trading Donchian Channels

    Donchian Channels are a technical tool that can be applied to any chart. They are used to pinpoint current levels of support and resistance by identifying the high and low price on a graph, over the selected number of periods. For today’s strategy we will be using 20 periods meaning that the channels will be used to identify the 20 day high and low in price.

    Since the price of the EURJPY is trading above the 200 MVA, traders will want to identify new entries to buy the pair on a breakout towards higher highs. With our current 20 Day high identified by the Donchian Channels at 145.68 traders can set an entry to buy the EURJPY one pip above this value.
    Now, let’s look at how to enter into a sell position.

    Learn Forex – EURJPY Daily with Channels


    The process of initiating sell positions in a downtrend is exactly the opposite. Again, we will revisit the AUD/NZD Daily graph pictured below. As price is below the 200 MVA, traders will look to sell the pair in the event of price creating a new 20 Day low. Currently that low resides at .8775 and traders can look to initiate new sell positions under that value.

    Learn Forex – AUDNZD Daily with Channels


    Setting Risk & Trailing Stops

    When trading any strategy, setting stops and managing risk should be considered. When using Donchian Channels, this process can be simplified. Remember how our pricing channels (representing the 20 Day high or low), act as an area of support or resistance? In an uptrend, price is expected to move to higher highs and stay above this value. If price moves through the bottom channel, representing a new 20 Day low, traders will want to exit any long positions. Conversely in a downtrend, traders will want to place stops orders at the current 20 period high. This way, traders will exit any short positions upon the creation of a new high.

    Traders may also use the Donchian Channels as a mechanism to trail their stop. As the trend continues, traders may move their stop along with the designated channel. Trailing a stop in this manner will allow you to update the stop with the position, and lock in profit as the trend continues.


    More...

  4. #324
    member ForeCastle's Avatar
    Join Date
    Apr 2013
    Posts
    1,077
    Blog Entries
    236

    The Price Action Trigger

    Talking Points:

    • Price Action is the study of technical analysis using price and price alone
    • Candlestick wicks show areas where price reversals have taken place intra-candle
    • Traders can combine wicks with support and/or resistance to look for risk-efficient entries


    One of the best parts about price action is that it’s one of the cleanest ways possible of performing technical analysis. By trading without indicators, and evaluating price movements based on price alone, traders eliminate the risk of lag that is inherent in most technical indicators.

    In this article, we’re going to focus exclusively on the entry into the trade or position.

    The Value of Candlestick Wicks

    A candle’s wick shows levels at which prices have reversed. Let’s look at a recent example in EURUSD.


    This reversal can be for any number of reasons: Perhaps a major technical level brought new sellers into the market? Or maybe a data announcement or event sparked a sharp reversal; the reason doesn’t matter nearly as much as the fact that the reversal happened… and price action can show this to the trader, and the trader can then build this into their approach.
    Combining Wicks with Support and Resistance

    Since wicks highlight reversals, traders can look to associate these areas on the chart with support or resistance levels to see areas that may prove beneficial. The support and/or resistance can be found in any number of ways, whether using Fibonacci, Psychological Round Numbers, Pivot Points, or even previous price action inflections themselves.

    This serves as validation of that support or resistance level, as the very wick itself highlights the fact that traders had reacted during the formation of that candle, and pushed prices accordingly higher off of support or lower off of resistance.

    Let’s look at an example to illustrate.


    The price level of 1.6250 was a very interesting level on GBPUSD. This came in as a strong resistance level on the pair throughout 2012 and 2013. It’s also a psychological level that will often show up in the Forex market.

    Notice (in purple) the first attempt to break above 6250 was rebuked. The wick touching this price shows that as soon as 6250 was hit, enough sellers came into the market to push prices lower.

    Three candles later another attempt to break 6250 occurred, only this time the candle printed as a doji (highlighted in the red circle above).

    The fact that the wick of this doji could not break above 6250 highlights that resistance in the pair, and the trader can possibly look to go short. The beauty of something like this is that the risk is defined: If a trader is trading for resistance to be respected, then prices should not break above the high of that wick.

    Notice that the following candle is a large down day, until eventually support comes in.
    Eventually 1.6250 yields to the bullishness in the pair, but shortly thereafter the old level of resistance at 6250 becomes a new level of support; once again highlighted by a candlestick wick (highlighted in blue).

    The trader can look to trade this setup long, with a stop below the bottom of the wick so that if the momentum that created that wick at support continues, the trader can be looking at a profitable position.

    -- Written by James Stanley

    More...

  5. #325
    member ForeCastle's Avatar
    Join Date
    Apr 2013
    Posts
    1,077
    Blog Entries
    236

    Why Traders Should Not Rely on Risk: Reward Alone

    Talking Points:

    • Why Risk: Reward Is Important
    • Why Risk: Reward Is A Piece Of The Puzzle Only
    • Clean Trading Systems That Utilize Risk: Reward Well


    If you’re new to trading, you should always focus on trading in terms of positive risk: reward relationship. The simple but very important logic of trading with good or great risk: reward ratios is that you will have a hard time growing your account if you continue to lose large chunks of your account because of poorly planned trades. Another way to view the importance of risk: reward is in thinking that if you were the captain of a ship, you wouldn’t focus on your destination if you had a big hole in your boat, rather you’d know that your progress will be heavily hindered until you fix the leak.

    Why Risk: Reward Is Important

    When we set out to find the traits of successful traders, we looked at 12,000,000 live trades from October 1st 2009-September 30th 2010, and we found that traders were actually right the majority of the time, which was great, but they struggled to keep their heads above water. The reason traders were not making progress is because they were losing more money on their losing trades than they won on their winning trades. This brought about our call to make sure traders to enforce a risk: reward ratio of 1:1 or higher.

    Learn Forex: The Gaping Hole in Many Trading Plans Is % Risked vs. % Gain

    S


    You would be right in looking at the results of these trades and saying that traders will have a hard time making progress if they are risking on average 94 pips while taking 52 pips from the market on their winning trades. As one trader was noted, that’s a painful way to make a buck. However, you wouldn’t be that much better off if you walked away thinking that if you only set a positive risk: reward ratio of 1: 1 or higher that you’ll be set for trading greatness.

    Why Risk: Reward Is a Piece of the Puzzle Only

    As you’ve already seen it’s very important to ensure that you have your risk: reward appropriately set for every trade. Of course, you need to understand that the draw of risk: reward alone could pull you into trading with a weak system that has very little probability of long-term success. In fact, think about this question to help you understand that Risk: Reward is a key part but not the whole piece to the trading puzzle.

    Isn’t Gambling Built On The Idea Of Attractive Risk: Reward Ratios?

    As you can imagine, many people walk into casinos with the idea that they can make a killing with a small stack of cash. Of course, the casino was built with money that was fed into their system with that kind of thinking. What’s more, casinos understand market risk better than 99% of the people who walk in their doors and the reason why they have table limits and rules for each game is that they understand when the risk of playing with a customer are no longer in their favor. In fact, there are two other key aspects of trading that you need to focus on in addition to Risk: Reward to help you with your long-term trading goals.

    The two other components of your trading plan should be minimizing leverage to an appropriate amount and finding a trading system that provides trading signals that you’re comfortable trading with.

    Minimizing Leverage: Leverage is often more of a foe than a friend for many traders. On the surface, using leverage sounds like an exciting way to grow your account but emotionally, the greed of many traders causes them to push the envelope on available leverage. This may work well in the short term until a handful of bad trades highly leveraged pushes them past the point of return. Ed Thorp, the math instructor at MIT & hedge fund manager once said in an interview, “Any good investment, sufficiently leveraged, can lead to ruin.” Another term for this is overtrading but whatever you call it, you need to combine your knowledge of risk: reward with leverage that is manageable, which we found was around 5x total market exposure to your account balance.

    Learn Forex: Correlation of Lower Leverage & Higher Relative Profitability


    Clean Trading Systems That Utilize Risk: Reward Well

    There is a very clear reason why trading system is introduced last. As the referenced quote mentioned, even a good trading system can lead to ruin when too much leverage is applied. Therefore, once you focus more on using an effective risk: reward of 1: 1 or great and an effective leverage around 5x of your total account capital, then you can look to find a trading suitable that can display trade opportunities within the scope of the larger trend.

    The truth about trading that many traders only learn later is that very good traders can use a multitude of any systems and still come out profitable. Just like a world-class golfer can use a variety of golf clubs to hit a winning shot, so a trader can use any variety of trend identification systems to display trend trading opportunities.

    Two favored approaches that both focus on entering in the direction of the overall trend after a correction has formed is Elliott Wave which utilizes Fibonacci Retracements. While Elliott Wave can get complicated, the overall concept is rather simple as it states that a trend will be made up of 3 impulses and 2 corrections for a total of 5 moves. Corrections or counter-trend moves are your opportunity to join the overall trend. When you come across a correction that is slowing down, you can look to take that trade with a minimal amount of leverage and a positive risk: reward ratio such as 50 pip stop and 150 pip limit.

    Learn Forex: Elliott Wave Can Help You Put Into Action the Traits of Successful Traders


    Some traders aren’t comfortable with the subjectivity of Elliott Wave. There’s an ongoing joke that if you put a chart in front of 10 Elliott Wave technicians that you will get 10 different counts. If that sounds like you, then another good trend trading system that looks to enter on corrections within the overall trend is Ichimoku, which is meant to help you see in one glance if there is a good trend and an equally good entry at the current rates.

    In Closing

    This article wasn’t meant to discourage you about Risk: Reward but rather encourage you to combine the value of risk: reward with minimal leverage and a good trading system to help you identify higher probability opportunities. This will allow you to be excited about market opportunities while keeping a realistic outlook on the opportunities that can lead to success in trading.
    Happy Trading!
    ---Written by Tyler Yell, Trading Instructor

    More...

  6. #326
    member ForeCastle's Avatar
    Join Date
    Apr 2013
    Posts
    1,077
    Blog Entries
    236

    All About Currency Crosses

    Talking Points

    • Foreign exchange rates are quoted in pairs
    • Major Pairs reference major currencies coupled with the USD
    • Cross Pairs reference major currencies coupled with a non USD currency


    Foreign exchange rates are quoted using two currencies, which then are combined to create a currency pair. The majority of these pairs are created using the G-8 currencies listed below which are then divided into two classifications, Major Pairs and Cross Pairs.

    Today we will continue our review by briefly explaining exactly is meant by a currency cross.


    Currency Cross Pairs

    “Major Pairs” are considered when any of the Major G8 currencies are coupled with the USD, such as the EURUSD. A cross pair is one that does not include the USD. These currency cross pairs were created to ease the process in which traders could exchange money. Not only were transactions simplified without first having to convert to USD as a common medium, but now traders can also trade while avoiding USD volatility.

    The other major benefit to trading cross pairs is for their strong trending markets. One example of a currency cross pair is the EURAUD. For the 2013 trading year the EURAUD moved a total of 3378 pips from low to high. This is nearly 4x the movement of the EURUSD! The EURUSD major only managed a move 848 pips, measured from low to high for the 2013 trading year. Other cross pairs for the Euro can be seen depicted below and includes the EURGBP, EURAUD and EURJPY to name a few.So remember next time you open your platform there are opportunities outside of the majors, and look for the currency crosses.


    ---Written by Walker England, Trading Instructor

    More...

  7. #327
    member ForeCastle's Avatar
    Join Date
    Apr 2013
    Posts
    1,077
    Blog Entries
    236

    How to Trade with Stochastic Oscillator

    Talking Points:
    -Slow Stochastic provides clear signals in a forex strategy
    -Take only those signals from overbought or oversold levels
    -Filter forex signals so you are taking only those in the direction of the trend

    Stochastic is a simple momentum oscillator developed by George C. Lane in the late 1950’s. Being a momentum oscillator, Stochastic can help determine when a currency pair is overbought or oversold. Since the oscillator is over 50 years old, it has stood the test of time, which is a large reason why many traders use it to this day.

    Though there are multiple variations of Stochastic, today we’ll focus solely on Slow Stochastic.
    Slow stochastic is found at the bottom of your chart and is made up of two moving averages. These moving averages are bound between 0 and 100. The blue line is the %K line and the red line is the %D line. Since %D is a moving average of %K, the red line will also lag or trail the blue line.

    Traders are constantly looking for ways to catch new trends that are developing. Therefore, momentum oscillators can provide clues when the market’s momentum is slowing down, which often precedes a shift in trend. As a result, a trader using stochastic can see these shifts in trend on their chart.

    Learn Forex: Slow Stochastic Entry Signals


    Momentum shifts directions when these two Stochastic lines cross. Therefore, a trader takes a signal in the direction of the cross when the blue line crosses the red line.

    As you can see from the picture above, the short term trends were detected by Stochastic. However, traders are always looking for ways to improve signals so they can be strengthened. There are two ways we can filter these trades to improve the strength of signal.

    1 - Look for Crossovers at Extreme Levels

    Naturally, a trader won’t want to take every signal that appears. Some signals are stronger than others. The first filter we can apply to the oscillator is taking cross overs that occur at extreme levels.

    Learn Forex: Filtering Stochastic Entry Signals


    Since the oscillator is bound between 0 and 100, overbought is considered above the 80 level. On the other hand, oversold is considered below the 20 level. Therefore, cross downs that occur above 80 would indicate a potential shifting trend lower from overbought levels.
    Likewise, a cross up that occurs below 20 would indicate a potential shifting trend higher from oversold levels.

    2 - Filter Trades on Higher Time Frame in Trend’s Direction

    The second filter we can look to add is a trend filter. If we find a very strong uptrend, the Stochastic oscillator is likely to remain in overbought levels for an extended period of time giving many false sell signals.

    We would not want to sell a strong uptrend since more pips are available in the direction of the trend. (see “2 Benefits of Trend Trading”)
    Therefore, if we find a strong uptrend, we need to look for a dip or correction to time a buy entry. That means waiting for an intraday chart to correct and show oversold readings.

    At that point, if Stochastic crosses up from oversold levels, then the selling pressure and momentum is likely alleviated. This provides us a signal to buy which is in alignment with the larger trend.

    In the EURJPY chart above, prices were well above the 200 Day Simple Moving Average (the moving average wasn’t shown because it was well below the current prices). Therefore, if we filtered trades according to the trend on a daily chart, then only the long signals (green arrows) would have been taken.

    Therefore, traders use Stochastic to time entries for trades in the direction of the larger trend.

    ---Written by Jeremy Wagner, Head Trading Instructor, DailyFX Education

    More...

  8. #328
    member ForeCastle's Avatar
    Join Date
    Apr 2013
    Posts
    1,077
    Blog Entries
    236

    What Is a Margin Call & How Do You Avoid One?

    Talking Points:
    -A Short Introduction to Margin & Leverage
    -Causes of Margin Calls
    -Margin Call Procedure & FXCM Smart Margin Feature
    -How to Avoid Margin Calls

    “Never meet a margin call. You are on the wrong side of a market. Why send good money after bad? Keep the money for another day.”
    -Jesse Livermore

    To get a grasp on what a margin call is, you should understand the purpose and use of Margin & Leverage. Margin & Leverage are two sides of the same coin. The purpose of either is to help you control a contract larger than your account balance. Simply put, margin is the amount required to hold the trade open. Leverage is the multiple of exposure to account equity. Therefore, if you have an account with a value of $10,000 but you would like to buy a 100,000 contract for EURUSD, you would be required to put up $800 for margin in an account leaving $9,200 in usable margin. Usable Margin should be seen as a safety net and you should protect your usable margin at all costs.

    Learn Forex: Creating an Order Will Tell You the Margin for Your Trade Size


    Causes of a Margin Call

    To understand the cause of a margin call is the first step. The second and more beneficial step is learning understanding how to stay far away from a potential margin call. The short answer as to understand what causes a margin call is simple, you’ve run out of usable margin.

    Learn Forex: Usable Margin & Usable Margin % Are Key Metrics of Every Account


    The second and promised more beneficial step is to understand what depletes your usable margin and stay away from those activities. In risk of oversimplifying the causes, here are the top causes for margin calls which you should avoid like the plague (presented in no specific order):

    • Holding on to a losing trade too long which depletes Usable Margin
    • Overleveraging your account combined with the 1st reason
    • An underfunded account which will force you to over trade with too little usable margin


    Put together in one sentence, the common causes of margin call is the use of excessive leverage with inadequate capital while holding on to losing trades for too long when they should have been cut.

    What Happens When A Margin Call Takes Place?

    When a margin call takes place, you are liquidated or closed out of your trades. The purpose is two-fold: you no longer have the money in your account to hold the losing positions and the broker is now on the line for your losses which is equally bad for the broker.

    How to Avoid Margin Calls

    Leverage is often and fittingly referred to as a double-edged sword. The purpose of that statement is that the larger leverage you use to hold a trade greater than some large multiple of your account, the less usable margin you have to absorb any losses. The sword only cuts deeper if an over-leveraged trade goes against you as the gains can quickly deplete your account and when your usable margin % hits, zero, you will receive a margin call. This only gives further credence to the reason of using protective stops while cutting your losses as short as possible.

    Learn Forex: The Effects of Leverage Cut Both Ways, Choose Wisely


    The purpose of this quick Trader A vs. Trader B snapshot is to show you the quick peril you can find yourself in when over leveraged. In the end, we don’t know what tomorrow will bring in terms of price action even when a compelling set-up is presented.
    Happy Trading!

    ---Written by Tyler Yell, Trading Instructor

    More...

  9. #329
    member ForeCastle's Avatar
    Join Date
    Apr 2013
    Posts
    1,077
    Blog Entries
    236

    Forex Market Size: A Traders Advantage

    Talking Points

    • The Forex market is the largest and most liquid market in the world.
    • The US dollar makes up the majority of Forex transactions
    • The Forex market’s deep liquidity is advantageous to traders by allowing them to enter and exit the market instantaneously


    According to the Bank for International Settlements, foreign-exchange trading increased to an average of $5.3 trillion a day. To put this into perspective, this averages out to be $220 billion per hour. The foreign exchange market is largely made up of institutional investors, corporations, governments, banks, as well as currency speculators. Roughly 90% of this volume is generated by currency speculators capitalizing on intraday price movements.

    Unlike the stock and futures market that are housed in central physical exchanges, the Foreign exchange market is an over-the-counter market, decentralized market completely housed electronically. Banks from Hong Kong to Zurich and from London to New York. Though most investors are familiar with the stock market, they are unaware how small in volume it is in relation to the Forex market.


    In the diagram above, it can be easily seen how the FX market’s $5.3 trillion per day in trading volume dwarfs the equities and futures markets. In fact, it would take thirty days of trading on the New York stock exchange to equal one day of Forex trading!

    Traders from other markets are attracted to the Forex because of this extremely high levels of liquidity. Liquidity is important as it allows traders to get in and out of a position at with ease 24 hours a day 5 ½ days a week. It allows large trading volumes to enter and exit the market without the large fluctuations in price that would happen in less liquid market. This means that if you will never get in a position because of the lack of a buyer. This liquidity can vary from one trading session to another and one currency pair to another as well.


    As the most traded currency, the US dollar makes up 85% of Forex trading volume. At nearly 40% of trading volume, the euro is ahead of the third place Japanese yen that takes almost 20%. With volume concentrated mainly in the US Dollar, Euro and Yen, Forex traders can focus their attention on just a handful of major pairs. In addition, the greater liquidity found in the Forex market is conducive to long, well-defined trends that respond well to technical analysis and charting methods.

    In sum, the Forex market size and depth make it the ideal trading market. This liquidity makes it easy for traders to sell and buy currencies. This is why traders from all different asset classes are turning to the Forex market.

    ---Written by Gregory McLeod Trading Instructor

    More...

  10. #330
    member ForeCastle's Avatar
    Join Date
    Apr 2013
    Posts
    1,077
    Blog Entries
    236

    The Price Action Playbook

    Talking Points:

    • Traders can perform technical analysis without any additional indicators on the chart
    • Price Action can be used to find trends, identify support and resistance, and trigger positions
    • Traders can look to price action in an effort to enforce effective risk-reward ratios


    Over the past couple of years, we’ve published numerous resources on the subject of price action; and this isn’t a theme that’s been exclusive to DailyFX. On numerous websites around the internet, the topic of price action seems to be taking on more of the limelight as traders around the world realize the value that it can bring to the table.
    Price Action isn’t going to help us ‘tell’ the future any more so than any other indicator: After all, both studies involve looking at the past to simply get an idea for how prices may move in the future; and regardless of how much we may want it to, the past will never perfectly forecast future events.

    However, price action can help traders by offering the most clean and accurate view on past proceedings on the chart; and since most indicators use a mathematical function to derive their value, the very fact that price action does not include any functions or translation to read past prices, its message remains pure.

    Further, because traders can get the most accurate look at technical analysis, Price Action can make it more possible or simplistic to identify favorable risk-reward ratios; allowing traders to systematically institute The Traits of Successful Traders.

    In this article, we’re going to touch on some of the more pertinent themes of prices action while providing more thorough education on each point. If you’d like to see additional information, please click on the hyper-linked heading that will take you to an article that will explain that subject matter more thoroughly.

    Getting Started with Price Action

    In the article Four Simple Ways to Become a Better Price Action Trader, we offer a simple way that traders can get more familiar with the topic. In the article, we teach the basics of Price Action Analysis: How to read trends, how to identify support and resistance, and the basics of triggering a position once an attractive setup has been found.

    We also offered the Price Action Primer via Brainshark, which we had put together for traders that wanted a simple and easy introduction to this form of analysis. This is completely free-of-charge and takes about 15 minutes to complete. After clicking on the link below, you’ll first be asked to input the information into the ‘guestbook’ after which the lesson will begin.


    Price Action to Grade and Trade Trends

    One of the more attractive trading strategies available to trader is to notice prevailing trends in the marketplace so that we might look for them to continue.

    After all, with the future being unpredictable, this can allow the trader to take a step back and say ‘if the biases that have been seen in the market are to continue, I might be able to limit out of a trade.’ More attractive is the fact that if the trend doesn’t continue, the trader can bail out of the position while mitigating their loss.

    Trading trends with price action can allow traders to address The Number One Mistake Forex Traders Make; which is faulty risk-reward ratios.

    Because trends often take a ‘two steps forward, one step back’ pattern as prices move, traders can look to use this to their advantage by buying up-trends cheaply, and selling down-trends expensively. The following picture will illustrate further:

    Buying after ‘One Step Back’


    The goal when trading trends is to keep losses small while maximizing winning positions. By buying after price has made a recent swing low (or selling after a recent ‘swing high’) traders can keep their initial stops small so that if the trend does notresume, the loss can be small. But if the trend does continue, the profit could be three, four, or five times the initial risk amount.

    Price Action as Support/Resistance
    One of the more interesting features of price action is that it can show us the exact prices at which reactions or reversals have taken place at in the past. This can be an excellent way to validate or confirm a support or resistance level. In The Three Tenets of Price Action, we looked at two separate ways that this can be done.

    The first way that price action can assist with support and/or resistance is through the study of psychological round numbers. This would be like the price of 1.3000 on EURUSD, or 1850 on S&P 500; prices which are round numbers that will often attract stop and limit orders. As prices move into those levels, the stops and limits residing in the area can greatly change the order flow in the market. This can create retracements, or reversals along with quite a bit of potential opportunity.

    In the picture below, taken from The Three Tenets of Price Action, we look at AUDUSD and its recent price action as it intersected with the psychologically round level of .9000.

    Price Action as Support/Resistance Confirmation/Validation


    Notice how, after running into the price of .9000 for the very first time the Aussie retraced 150 pips. Does this mean that the down-trend was over? No – it simply means that there was a pause in the trend after a very strong support level was hit. Traders can use this as an opportunity to sell into the trend at a more advantageous price.

    But even if the trader wasn’t able to short the Aussie from .9150 when the original trend was coming back, price action can still help locate entries.

    Notice how prices eventually broke through the .9000 level, only to come back and revisit old support, as new resistance. This was the first ‘Tenet’ of price action that we had looked at: During up-trends, old resistance will often become new support, and during down-trends, old support will often become new resistance.

    Entering Trades via Price Action

    Grading trends and identifying support and resistance is a fantastic benefit of price action; but to take this a step further, we can combine Multiple Time Frame Analysis with Price Action Analysis to get a more granular look at the market to more strategically plot our entry into the position.

    We explained this premise in the article, The Price Action Trigger.

    After traders have diagnosed a trend with higher-highs, and higher-lows; the trader can wait for prices to begin moving higher off of a recent ‘higher-low.’

    At this point, the trader can then move down to a lower time frame chart to get a more detailed look inside of that market; and as soon as prices on the lower time frame begin making a series of ‘higher-highs,’ and ‘higher lows,’ the trader can look to trigger long in anticipation of the original up-trend coming back to order.

    Multiple Time Frame Analysis can assist with entering trades


    -- Written by James Stanley

    More...

Page 33 of 43 FirstFirst ... 23 31 32 33 34 35 ... LastLast

LinkBacks (?)

  1. 10-09-2013, 09:11 PM

Tags for this Thread

Bookmarks

Posting Permissions

  • You may not post new threads
  • You may not post replies
  • You may not post attachments
  • You may not edit your posts
  •