Page 28 of 44 FirstFirst ... 18 26 27 28 29 30 38 ... LastLast
Results 271 to 280 of 434
Like Tree10Likes

Forex Strategies

This is a discussion on Forex Strategies within the Trading Systems forums, part of the Trading Forum category; Talking Points: Trading psychology is a necessity to long-term trading success Traders first have to learn to lose properly before ...


  1. #271
    member ForeCastle's Avatar
    Join Date
    Apr 2013
    Posts
    1,077
    Blog Entries
    242

    The Forex Trader’s Guide to Speculation Psychology

    Talking Points:

    • Trading psychology is a necessity to long-term trading success
    • Traders first have to learn to lose properly before they can win long-term
    • Keeping a positive outlook allows traders to stay on their strategy even during losing streaks


    Over the past few articles, we’ve investigated the concept of Trading Psychology; because this can have a huge impact on a trader’s bottom line.

    After you’ve developed a strategy, and learned the basics of the market – you have many of the tools that are needed to be successful. And when that success doesn’t come, numerous questions can swirl around inside of a trader’s head.

    ‘Am I trading the right strategy?’ ‘Do I really know what I’m doing?’ ‘If all these pros make it seem so easy, why does it seem so difficult?’

    If you’ve thought of any of the above questions – do not worry; you’re not alone. I’ve thought them just like any other trader has thought them. The difference between a professional and an amateur is that the professional knows how to properly answer those questions and the amateur does not.
    What follows are suggestions to get to where you want to be.

    The biggest psychological obstacle for traders is proper perception of losses (and the concept of losing). When traders first come to markets, they often feel that they have to ‘beat’ the market.
    This is a bad idea. If you try to beat the market, it often comes back to beat you.

    Most great traders are great risk managers first and foremost. Because if you’re losing more than you’re winning (even if you’re winning more often than your losing), well – then you are NOT a profitable trader.

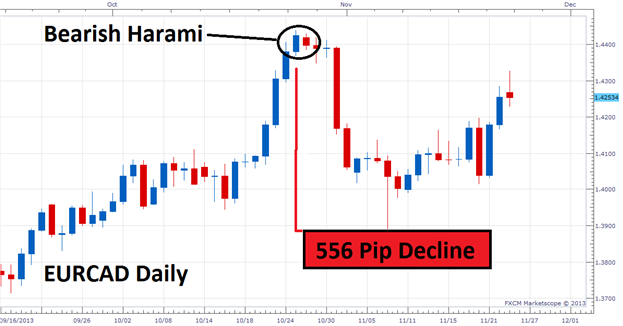
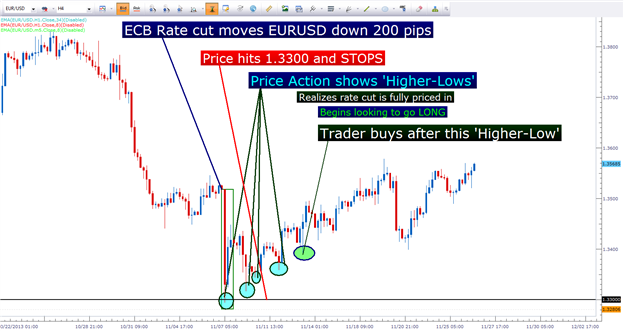
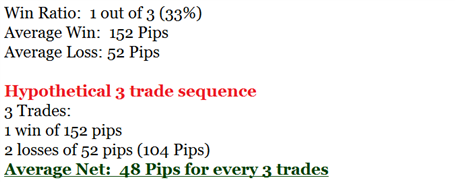
    In the article How to Lose Properly, we looked at a way in which traders can conceptualize the inevitable prospect of losing: Because you are going to lose as a trader; the big question is whether or not you are letting those losses more than offset your gains.

    This is so incredibly huge because this is The Number One Mistake Forex Traders Make; taking such large losses when they are wrong and such small gains when they are right. This means that they can be winning 2 out of every 3 trades – AND STILL LOSE MONEY!

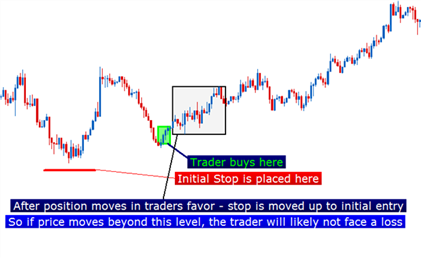
    In the article, we stressed the importance of always trading with a stop; and the further importance of properly establishing your risk at the outset of a trade. This way, if the trade moves against you, you can stand confident on your original analysis. Lastly, we closed the article by suggesting the use of break-even stops in an effort to prevent those psychologically draining situations of watching a winner turn around, and come back as a loser.

    The Break-Even Stop can provide comfort as initial risk is not exposed


    Learning to lose properly is a necessity for traders to find long-term success; because until you learn how to cap your losses, you always run the risk of having just one trade blow up the gains from many others.

    But, even after you learn to lose, it doesn’t necessarily mean that you’ll enjoy or like it any more… Losing still stinks no matter how good you are, or how much money you can make. Because of that, it’s extremely important to be able to bring a positive mindset to the market every single day, and we looked at how to do that in the article, How to Adopt a Positive Trading Mentality.

    Bring a positive mindset to the charts every day…

    Since you will inevitably be taking losses in this sport of trading, it’s important to disallow those losses from ruining our outlooks or frames of mind.

    What will often happen is that a trader might take a couple of stops only to get discouraged. And after they’re discouraged, they get sloppier on their analysis, or they question their own approach. The results of which can be DISASTEROUS.

    Learning to be a profitable trader can be difficult enough; but once you start assigning blame for not being able to predict the future, you’ve begun to beat yourself up for something you had no control over in the first place.
    In the article, we offer a way that traders can look at trading in a very similar field; entrepreneurship. We specifically used the example of a small business owner of a retail clothing store. If our small business owner wants to sell clothes, they first have to buy them – right? So, our entrepreneur needs to acquire inventory before they can ever enact a sale.

    And of the acquired inventory, likely, some will sell, and some won’t. But, if the business owner is able to sell enough to offset the cost of the inventory that doesn’t sell – then they have found profit.
    This isn’t too dissimilar to a trader…

    We take positions in the hope of watching them become profitable; much like the clothier in our example buying inventory. Some of our trades, like some of our business owner’s inventory, will work out well, while others won’t.

    The key to keeping a positive mindset in trading is to look at losses in the same way that the business owner looks at unsold inventory; simply as a cost of doing business.

    Because once you’ve learned to lose properly, and then after you’ve learned to keep those losses in scope of the bigger picture – you’ve addressed biggest aspects of trading psychology. Now, we have the other end of the coin: What happens when you have TOO MUCH confidence, and we addressed this in the article Fear and Greed, The Trader’s Struggle.

    Strike the delicate balance between fear and greed

    These two drives can have a large bearing in the way we live our lives; and not just in trading but in other areas as well. In trading, both fear and greed can be massively detrimental, as they can cloud our judgment and promulgate bad decisions.

    Most human beings will be greedy when they have a losing position; willing to hold on if only price can come back to their entry level. And when in a winning position, most human beings will begin to be fearful (what if the position comes back against me! Nobody ever went broke taking profits, right?).
    This is the type of logic that leads to The Number One Mistake that Forex Traders Make… We suggested that traders should look to reverse those drives, and to be greedy when they’ve been proven right and when their trades have worked out. If fearful, you can use the breakeven stop to help alleviate the concern that your initial risk is still exposed.

    And when in a losing position, when most human beings are willing to sit in the trade in the hope that it comes back; well this is when you want to be fearful. Your analysis has been proven incorrect, and you’re upside down in the trade – why in the world would you want to hang on any longer?

    Take the advice of many professional traders, Warren Buffett included…


    Once you’ve mastered these three topics, you have a very strong leg up on the rest of the market. The final thing for traders to focus on is a problem that many might not even know about yet… And that is the danger of over-confidence, and the risk of falling into The Confidence Trap.

    Don’t let confidence get the best of you

    After putting together a string of successes, its natural human nature to build up confidence around your dealings; and this can be a really good thing.

    As an example, confidence can help you offset fear, as we discussed above… Confidence can also help you keep a positive mindset every day, which is also very important.

    But once a trader has gone into the territory of being ‘over-confident,’ they introduce some very large risks into their approach, key of which is the willingness to bend your own rules simply because you ‘feel’ that you will be successful.

    In the article The Confidence Trap, we cover this concept in depth. We share that traders should look to strike that delicate balance between being scared or fearful, and over-confident. We did this with ‘The Confidence Continuum.’

    The Confidence Continuum


    Where to go from here?

    After a trader has mastered the psychological aspect (which could take many, many years), it’s time to start looking at ways of improving our product knowledge about the assets that are being traded.

    In the FX Market, it’s extremely important to understand how important currency values are to economies. In The Nucleus of the Forex Market, We included a fantastic example of how the nation of Japan was ravaged by a strong yen, and how hope was brought back into the equation with ‘Abenomics.’

    --- Written by James Stanley

    More...

  2. #272
    member ForeCastle's Avatar
    Join Date
    Apr 2013
    Posts
    1,077
    Blog Entries
    242

    Take Advantage of False Breakouts at Great Prices with Ichimoku

    Talking Points:

    • What is a False Breakout?
    • How Ichimoku Can Help You Recognize a False Breakout
    • Trading Opportunity in EURUSD with Ichimoku on Recent Move


    There are few things more frustrating to traders than false breakouts. Especially if your bread and butter as a trader is catching trends at the earliest stage possible. However, much like whipsaws on protective stops, false breakouts are often seen as a necessary evil.

    What is a False Breakout?

    A false breakout takes place when price appears to be making a renewed move in the direction of the trend only to be retraced. A trend trader who is looking for prices to eventually move higher but wants confirmation of a price thrust in the direction of the trend is especially prey to false breakouts. This is because a break of resistance like a trendline that is pierced by price without follow through is ground zero to a false breakout.

    Learn Forex: USDJPY frustrated many traders when a breakout was fully retraced


    How Ichimoku Helps You Recognize a False Breakout

    Like many pains of trading such as stops getting hit at an unfortunate price, false breakouts cannot be avoided. However, they can be minimized as well as become a nice trading signal upon their failure. The reason I like looking to false breakouts as a trading opportunities is that they can often have a sharp reversal in the direction of the prior move with a good risk to reward ratio.

    Ichimoku is a technical trading system that helps you catch moves in the direction of the trend on the time frame that you’re trading. Ichimoku is often seen as a difficult system to learn due to the 5 components that are displayed on the chart to explain a trading opportunity but each line serves a purpose and when you understand each purpose, you begin to get a feel for the value that Ichimoku can bring to your technical trading strategy.

    Learn Forex: Ichimoku Labels


    The Chikou Span is a very helpful portion of Ichimoku that helps you see when a price breakout is suspect and could fail. The Chikou span is the bright green line on the chart and is simply the price of the current candle pushed back 26 periods on the chart time frame you’re trading. The trailing function of the Chikou Span is why it is translated to English as the lagging line.

    If price has broken above the cloud but the lagging line is not following through, Ichimoku may be alerting you to an opportunity. The preferable signal is for price to return back to the prior trend which can be your signal to enter into the trade.

    Trading Opportunity in EURUSD with Ichimoku on Recent Move


    Recently, the European Central Bank adjusted their monetary policyand dropped their reference rate to 0.25% off of weaker than expected Consumer Price Index reading. Because the market was not expecting the drop, EURUSD fell to 1.3295 on the news before rebounding as high as 1.3448. Because Ichimoku’s lagging line hasn’t followed through, there could be a trading opportunity if price moves back in the direction of 1.3295 and potentially beyond.

    Ichimoku Trade: Sell EURUSD If Price Breaks Below 1.3415 Showing a False Breakout Occurred

    Stop: 1.3550 (Technical Invalidation Point on the Chart)

    Limit: 1.3295 (Monthly Low)

    If this is your first reading of the Ichimoku report, here is a recap of the traditional rules for a sell trade:
    -Price is below the Kumo Cloud (That will be our entry trigger)
    -The trigger line (black) is below the base line (light blue) or is crossing below
    -Lagging line is below price action from 26 periods ago (bright green line)
    -Kumo ahead of price is bearish and falling (red cloud = bearish Kumo)

    If the breakout turns out to be legitimate and 1.3550 is taken out, then the next target would be in the neighborhood of 1.3630 /3650 range.

    Happy Trading!

    ---Written by Tyler Yell, Trading Instructor

    More...

  3. #273
    member ForeCastle's Avatar
    Join Date
    Apr 2013
    Posts
    1,077
    Blog Entries
    242

    Candle Patterns for Forex Price Reversals

    Talking Points

    • Candlestick analysis can be used to spot market reversals and resumptions of trends.
    • The bullish engulfing pattern can spotted inside the Three Outside Up pattern.
    • Candles can be used as a confirmation tool, and used for Forex entries


    Understanding candlestick charts and their patterns allow traders to work price action into an existing Forex trading strategy. Normally candle patterns such as the Bullish Three Outside Up can be used to confirm a change of trend, or even validate a market entry. With this idea in mind we will focus on recognizing and trading one of the markets most clear candle patterns.


    The Three Outside Up

    A Three Outside Up candle pattern may sound complicated at first, but it is actually a derivation of the bullish engulfing pattern. Pictured above we can see the Three Outside Up pattern is comprised of three individual candles. The first candle should close down and will depict the end of a currency pair’scurrentweakness. This first candle can close with a variety of body and wick sizes and can vary from chart to chart.While it is notdirectly related to the next engulfing pattern, this candle should denote the end of the markets current decline.

    The second and third candles in the pattern are arguably the most important. As seen above, the second candle is expected to engulf the first with a large blue candle. This large bullish engulfing candle signifies new strength in the market as price attempts to break to higher highs. To be considered a complete bullish engulfing candle price of the second candle should close well above the high of the first candle. Lastly, candle number three is used to validate the current change in market direction. This candle should open immediately higher, creating as small a wick to the downside as possible. Upon closing above candle two, candle three will validate the new bullish market bias.

    Let’s look at a current example.
    Learn Forex – GBPUSD Daily Trend


    Uses in Trading

    Above we can see the Bullish Three Outside Up in action on the GBPUSD currency pair. The daily graph has been in a long standing established uptrend, but notice there has been dips along the way. There have been three candle patterns, which have been highlighted in the chart, showing prices return back in the direction of the trend. The last of which signaled the August 2013 bottom for the pair, before rallying as much as 1158. So how can this be worked into a trading plan?

    Traders looking to take advantage of the Bullish Three Outside Down pattern can add it into any existing trending market plan. Most traders will use it as a confirmation tool such as SSI to signal a change in market direction. If the market has a bias upward, like the GBPUSD chart above, traders can use this candle pattern to establish new buying positions.

    ---Written by Walker England, Trading Instructor

    More...

  4. #274
    member ForeCastle's Avatar
    Join Date
    Apr 2013
    Posts
    1,077
    Blog Entries
    242

    3 Tools to Help You Spot a Reentry point After a Strong FX Move

    Talking Points

    • Spotting An Outsize Move – Breaking Resistance
    • Meeting The Tools – Fib Resistance, Ichimoku, Pivots
    • What’s Next If Focal Prices Are Hit – Price Action & Reaction


    “After spending many years in Wall Street and after making and losing millions of dollars I want to tell you this: It was never my thinking that made the big money for me. It was always my sitting. Go that? My sitting tight! ... I've known many men who were right at exactly the right time, and began buying or selling stocks when prices were at the very level which should show the greatest profit. And their experience invariably matched mine--that is, they made no real money out of it. Men who can both be right and sit tight are uncommon.”
    -Jesse Livermore

    Acting in haste hurts. From a trading perspective, trading in haste or hurry is often known as chasing price. Chasing price often shows itself when you’ve finally talked yourself into a trade only to see it react against your entry shortly after your entry.

    Learn Forex: Big Moves Are Exciting But Approach with Caution


    Spotting an Outsize Move

    An outsized move can often be seen without any indicators or chart tools. In simple terms, an outsized move like the one seen recently in GBPAUD or GBPJPY will likely take out multiple levels of resistance. When resistance or a prior price ceiling is broken, you have clear indication that the current group of buyers are more confident or holding onto more conviction than they have had in the past when they backed off the move and a correction began.

    In addition to multiple levels of resistance breaking, you’ll often notice a series of very bullish candles where price consistently closes near the session high over and over again. In an uptrend, this type of moves shows you that buyers are holding this and have little conviction to let off the pressure against the sellers.

    Of course, spotting the outsized move is the easy part. The difficulty comes in having the emotional strength to
    fight off the fear of missing out and waiting for a decent and appropriate level of entry. The ability to wait and identify these points is a key mark of a mature or professional trader.

    Fibonacci is a sequence of numbers found throughout nature that applies to everything from the atomic structure & DNA molecules to formation of a cyclone or hurricane’s eye that gives the formation its strength. The value often found in the Fibonacci sequence to traders is the ratio between these numbers which show up in and outside of the markets. More often than most believe, a move will correct down to a Fibonacci percentage such at 38.2%, 50% or 61.8% of the prior move.

    Learn Forex: GBPAUD recently retraced down to Fib Levels before Bouncing


    Another key tool that many traders are getting more accustomed to is Ichimoku. Ichimoku is a technical or chart based trend trading system that illustrates support and resistance values in a simplified form and is considered a complement to candlestick trading. Looking to Ichimoku Cloud as a method to identify trend entries is still in use today and can be used in both bullish (rising) and bearish (falling) markets. This dynamic indicator can be used on the time frame of your preference and was voted Best Technical Indicator 9 Consecutive Years in Tokyo’s Nikkei newspaper.

    Learn Forex: Ichimoku’s Cloud Shows a Nice Entry on GBPAUD Developing


    As you are likely seeing, it is important to keep an eye out for a confluence of signals showing a correction or retracement may have ended and that you may be approaching an opportunity for reentry. Another tool that can help you see dynamic corrections within an unfolding trend are pivot points. Pivot points are based on recent price action and can help you build a directional bias when price corrects down to the pivot level before resuming the overall trend.

    Learn Forex: This Fib Window of 1.7600 -1.7330 Will Be a Focal Point for Reentry


    If you’re unaware of the key levels that are included in Pivot Points, they are the High, Low & Close. Those three critical prices are divided by 3 and that price gives you the pivot for a specific time frame. Therefore, a daily pivot for today would take yesterday’s high, low & close divided by 3 and similarly for weekly pivots.

    What’s Next If Focal Prices Are Hit? Price Action & Reaction

    On the chart above, we’ve located a few technical indicators that provide potential support on GBPAUD between 1.7330 & 1.7600. Beyond the indicators, you’ll notice that the prior price action high aligns with the current 50% Fibonacci retracement at 1.7415. Also, the August high of 1.7483 is near the current 38.2% retracement, so there could be key moves off those levels. Therefore, this range presents prices where you can look for price action signals like a bullish engulfing pattern that shows the trend could begin its resumption.

    Big Picture of GBPAUD Potential: Bull Flag Opportunity


    Happy Trading!
    ---Written by Tyler Yell, Trading Instructor

    More...

  5. #275
    member ForeCastle's Avatar
    Join Date
    Apr 2013
    Posts
    1,077
    Blog Entries
    242

    Trade the Harami Candlestick Pattern

    Talking Points

    • Candlestick analysis can be worked into any active Forex trading strategy.
    • The Harami pattern can lead to trend changes and potential breakouts
    • Traders can look for profit taking or retracement trading opportunities


    Once traders understand the basics, they can then begin to compile a series of candles to form patterns to confirm potential changes and market direction. One of the most used candle patterns is known as the Harami. Today we will review the Harami pattern and how it can be implemented into your trading strategy.


    The Harami Candle Pattern

    The Harami candle pattern may be new to some but for many it may already be known as a derivation of an “Inside Bar”. Pictured above we can see a traditional Harami which can be defined by a few distinct characteristics. First the Harami is comprised of two candles. The first candle shoulddepicta large bullish candle such as a bullish engulfing candle. This blue candle is then followed up by a second smaller candle. The key to identifying a Harami is to have this second candle not close outside of the previous candles body. To add validity to the pattern, the second candle should close above half the traded value of the first candles body.

    A bearish Harami will show a bull market stopping dead in its tracks as in the example below. However, these patterns can be considered weak, because even if the pair pulls back after a Harami it does not necessarily dictate a full market reversal. Because of this, the pattern often incorporates a third candle for confirmation, creating a Three Inside Down pattern.

    Let’s look at a current example.

    Learn Forex – EURCAD with Harami


    Uses in Trading

    Above we can see a Bearish Harami in action on the EURCAD currency pair. The daily graph has been in a long standing established uptrend, but prices have a tendency to retrace along the way. This last retracement was started with the formation of a Harami. With its creation, the market put in its current high then quickly descended 556 pips to for a higher low on the chart.

    Traders looking to take advantage of the Bearish Harami pattern can add it into any existing trending market plan. Traders can look to take profits on any existing long trades, or even consider trading a full out reversal once this pattern appears. Regardless of your trading plan, when adding new components to your strategy you should be tracking your results with a trade journal. This way over time you can gauge the effectiveness of price action and candle analysis in your trading.

    ---Written by Walker England, Trading Instructor

    More...

  6. #276
    member ForeCastle's Avatar
    Join Date
    Apr 2013
    Posts
    1,077
    Blog Entries
    242

    Strong & Weak: British Pound Outperforms

    Talking Points:
    -British Pound has been the best performer over the past 3 weeks

    The British Pound has been in a broad based rally for more than 3 weeks and has easily earned the top spot in this week’s strong and weak analysis. The Sterling has been the only currency of the 5 main currencies to gain ground in each of the past 3 weeks against a basket of currencies.

    Forex Strategy: Matching Strong versus Weak

    Currency Up Arrows Down Arrows Change From Last Report
    GBP 7 Higher 1 ranking
    CHF 6 1 Higher 6 rankings
    USD 4 2 Lower 2 rankings
    EUR 4 2 Higher 2 rankings
    CAD 3 4 Down 1 ranking
    NZD 2 5 Down 3 rankings
    JPY 1 6 Down 1 ranking
    AUD 7 Down 1 ranking


    Trend following is one of the oldest strategies in trading. Since the Pound Sterling has clearly been in a strong advance, trend traders will look to buy strength as trends can sometimes continue for quite a while.

    When comparing the price of the exchange rates relative to their 200 period Simple Moving Average, the Sterling trend is the cleanest and is now considered the strongest currency according to the

    Strong & Weak analysis.

    Forex Education: GBPUSD at the top of a Trend Channel


    One factor that could accelerate gains for the British Pound is FXCM’s Speculative Sentiment Index (SSI). The SSI reading for the GBPUSD shows nearly 4 times as many traders are currently sellers than who are buyers in the pair. SSI is a good contrarian indicator especially when traders are lined up against the direction of the trend. The GBPUSD exemplifies both a strong trend and extreme SSI reading providing the recipe for a breakout.

    A break above resistance could mean sharp gains as these sellers become a future supply of buyers (in order to close out their short positions, they would need to buy it back).

    Executing the Trade

    Since we anticipate the British Pound may continue its broad based rally we will take a diversified approach and buy the single currency against a basket of currencies. There are several advantages to trading a currency rather than a pair with the largest benefit being diversification.
    You can try trading the GBP Basket BUY position in a Mirror account. We recommend risking less than 5% on all open trades. As a result, risk less than 1-2% on this basket so you have additional capacity to take on other trades.

    Good luck with your trading!

    ---Written by Jeremy Wagner, Head Trading Instructor, DailyFX Education

    More...

  7. #277
    member ForeCastle's Avatar
    Join Date
    Apr 2013
    Posts
    1,077
    Blog Entries
    242

    How to Trade the Death Cross on Oil

    Talking Points
    - Moving Average crossovers are a popular way traders use this indicator
    - A valid crossover happens when the faster moving average crosses either above a slower moving average which would be called a bullish crossover or below which is called a bearish crossover
    - When the 50-day simple moving average crosses below the 200-day simple moving average, it is commonly called a “Death Cross” and signifies a large bearish move.

    What is the ‘Death Cross’ pattern?

    Though its sounds scary and ominous, the ‘Death Cross’ (DC) pattern is neither. In fact, consumers that are tired of paying $80 or more to fill up their gas tank will rejoice at what this pattern means to the price of oil. The DC occurs when the short-term 50-day simple moving average crosses below the 200-day simple moving average. Typically, in a moving average crossover, a shorter term moving average crosses below a longer term moving average a sell signal is generated and price is expected to move lower. What makes the DC different is that the 200-day SMA is watched by so many traders to determine long term bullishness or bearishness that when the 50-day crosses below the 200, the selling can be substantial as institutional and retail selling converge.

    Learn Forex: USOil Moving Average Death Cross


    In the chart above there are 4 DCs on USOil which led to significant price moves lower. There is one DC on June 18, 2010 in which the decline was minimal. In fact, since 1984, there has been 21 Death Cross (DC) formations on oil with an average decline of 8.3% over the following 6 months after the crossover. With the current price of oil just south of $92.00 per barrel, we could see a decline down to the $80- $84.00 region once oil closes, on a daily basis, below the current trend line. This will be good news for oil bears and US holiday drivers but bad news for Oil bulls, for now.

    In each of case of the DC, the following price decline was short-lived and a sharp rebound followed. This could give new life and a great entry point for those who are bullish oil. Such a rebound would need confirmation. Oil bulls will wait their turn and may look for the advent of the Golden Cross before initiating longs. The Golden Cross is made up of the 50-day simple moving average crossing above the 200-day simple moving average and is a major buy signal. The DC is nothing to fear if you know which direction to trade. It marks the possible acceleration and extension of and oil “slide” lower.

    ---Written by Gregory McLeod Trading Instructor

    More...

  8. #278
    member ForeCastle's Avatar
    Join Date
    Apr 2013
    Posts
    1,077
    Blog Entries
    242

    The Complete Trading Approach

    Talking Points:

    • Traders should look to employ a balanced approach when trading in markets.
    • Fundamental and Technical Analysis can help locate higher-probability setups.
    • Risk Management and Strong Psychology are necessary for long-term success.


    Traders continue to flock to the Forex market in droves. Many of these traders are brand new to markets, and Foreign Exchange is the first venue they’ve looked at; while others are coming from equity or futures markets because the flexibility in FX make it more of a ‘pure trader’s market.’
    Regardless of whether you’re just starting to trade or if you’ve been around the market for a while, it often behooves us to have a strategy. Without a strategy, we essentially have to ‘guess’ which positions might work out for us each trading day, in hope that the market cooperates.

    The strategy is the process; and it’s the process that will allow you to reach your goals in the arena of trading. What follows are the four most pertinent components of the process traders should look to take into account in order to find long-lasting success in markets.

    Fundamental Analysis

    Future price movements are often shaped by economic data. When the NFP number gets announced, or when the European Central Bank decides to cut rates; you’ll see this take place very quickly in numerous markets. Traders scramble to price in this ‘new’ information, and if the data was compelling enough, these prices changes can put in longer-term moves (new trends).
    This type of thing happens in all markets; but what makes Foreign-exchange different is the realm of impact each of these data prints can bring.

    As an example, The European Central Bank cut rates 25 basis points on November the 7th of this year. We explained the motivation behind a weak currency in the article, The Nucleus of the Forex Market. This would normally be bearish for an economy; with lower rates of return, there is less incentive for foreign investors to deposit capital. And surely, as this news came in the market the Euro was punished lower by over 200 pips.

    Fundamental data can bring MASSIVE volatility to markets; but will it last?


    After the ECB shocked markets with the November rate cut, the Euro continued to move lower until it hit a price of 1.3300 (marked with the black line in the above graphic); at which point, prices began to reverse and move higher. As of this writing, EUR/USD is over 250 pips higher than this 1.3300 level of resistance.

    So, the ECB cut rates and prices moved over 200 pips lower, only to reverse at 1.3300. Price on EUR/USD then moved higher by 250 pips (and higher than the pre-ECB rate cut level).
    What does this tell us about fundamental analysis in the FX market?

    Fundamental data (and their accompanying announcements) can spark price movements in the Forex market. But these fundamental announcements are unpredictable… and even if we could predict these events, there would be no way to know exactly how the market will price them in.
    This is where the trader needs to incorporate additional tools into their approach; and we’ll talk about some of those below.

    Technical Analysis

    For a few different reasons, Technical Analysis has a much more prominent role in FX as opposed to other markets. Surely, Technical Analysis is used by stock and futures traders; but in FX we’re dealing with entirely different subject matter.

    As an example – a 10% movement in a day for a single stock can be considered a ‘great day.’ Movements of 5% or more are extremely common, especially when markets are pricing in new information (like earnings). Movements of 20% or more are less common, but they happen with regularity.

    If a currency were to move 20% in a day, much bigger issues are at stake. In the above example, we looked at a 200+ pip movement in the EURUSD, which I described as ‘massive.’ And, in relative scope – this was a massive move.

    But 200 pips in the EURUSD is really only about a 1.5% move


    With currencies, much more is at stake than just one single company, in one single economy. We’re talking about the foundation by which our entire civilization is founded upon. Daily volatility of 5% or more in a developed nation’s currency could wreak havoc on that economy, and any economy that wanted to trade with them.

    So, in general – price movements are smaller in FX…. But we also have more leverage to work with. This isn’t ‘just’ a good thing, because leverage can amplify gains AND losses; but this speaks to the flexibility that I mentioned at the beginning of this article.

    As a trader, when I want to turn up the leverage on a position, it’s my right to do so in the FX market. In stocks, that option isn’t even available as maximum leverage is capped at four times account equity.

    But, because these price movements are, in general, smaller than what we might see in other markets; traders often place a higher importance on technical analysis in seeking out trades or positions.

    Technical Analysis is the art of using the chart, and past prices in an effort to find trade setups; so, technical analysis is really just a way of examining the past; and there are a lot of different ways of doing so.

    Some traders prefer to use indicators like Moving Averages, or RSI; and these can be good if used correctly. But what often happens is that a trader finds that an indicator can help, so they automatically think that two must be better; and if two is better, why not three?

    A wise trader once told me that any indicator is really just a fancy moving average; and this is truth. Indicators are based on past prices; they just use their own mathematical formula to derive the indicator value. Because of this, Price Action is often considered to be one of the more ‘clean’ manners of examining past prices. Price Action strips out the mathematical formula and focuses solely on price.

    In the previous example of the EURUSD reaction after the ECB rate cut, do you remember where price had made its miraculous turn-around? The turnaround in EURUSD happened right after 1.3300 came into play; a perfect example of price action at work. The price of 1.3300 is considered a ‘Psychological Whole Number,’ that can often exhibit elements of support and/or resistance; similar to EURUSD at 1.3000, although 1.3300 wouldn’t be considered ‘as round’ as 1.3000.

    But Price Action can do a lot more than just show us psychological levels on charts. We could’ve used price action to trade that EURUSD setup very proficiently.

    The Potent Combination of Fundamentals and Price Action


    Price action can be used to find and grade trends, find support and resistances levels, and also trigger into positions.

    So, to recap: Fundamentals help shape future price movements; and technical analysis can help explain past price movements. Between these two analytical systems, we can begin to focus on the highest-probability strategies and setups.

    But this will not remove risk; and until a trader learns to manage their risk, the probability of profitability (long-term) will remain miniscule – and because of that, Risk Management isn’t just a preference, it’s a necessity.

    Risk Management

    An inevitable part of trading is losing. Because you cannot predict the future, you will, at least on occasion, be wrong. And if you aren’t managing your risk, one losing position can wipe away the gains from many winners. As long as this risk impacts the trader, the trader will struggle to find consistent profitability.

    Winning Percentage isn’t the only factor of profitability…


    Traders can look to prevent the number one mistake by simply using a stop and limit order to enforce a minimum 1-to-1 risk-to-reward ratio.

    So, if you set a stop of 50 pips look for at least 50 pips on the limit or profit target of the trade. And just like we outlined in How to Lose Properly, set your risk at the outset of a trade based on fundamental and technical analysis. If the position moves against you, so be it; but do not throw good money after bad money by widening your stop in the ‘hope’ that the position comes back.
    One of the most difficult things about trading is dealing with losses. It’s almost inhuman to be comfortable with losing, no matter how inevitable it may be. This is why trading psychology is so important…

    Trading Psychology

    One of the most difficult aspects of trading to master isn’t fundamental or technical analysis; it’s our own psychology. We covered this concept in-depth over the past month, and we recapped much of this work in The Forex Trader’s Guide to Speculation Psychology.

    As human beings, we generally look at success based on how often we are right. But, just like we saw above, those traders in GBPJPY that are winning 66% of the time; they might feel successful but they’re STILL losing money.

    If we reverse the above ratios; where traders are winning 33% of the time (1 out of 3), but winning 152 pips on each win, and losing 52 pips on each loss – let’s take a look at the average results:


    In the above graphic, you can see how a 33% winning ratio can amount to a profitable strategy.
    The trader achieving these statistics, winning 33% of their trades with an average win of 152 pips and an average loss of 52 pips is averaging a 48 pip net profit for every three trades that they’re placing. This trader is making money.

    But do they feel like they’re making money? They’re failing two out of every three trades. Most human beings, despite being profitable, would feel like they’re losers, or inadequate in some way because they can only win one out of every three trades that they’re placing.
    This is where the importance of a Positive Outlook comes into play; enabling the trader to look at the bigger picture, losing properly when they are wrong, and focusing on managing winning trades while the losers manage themselves.

    -- Written by James Stanley

    More...

  9. #279
    member ForeCastle's Avatar
    Join Date
    Apr 2013
    Posts
    1,077
    Blog Entries
    242

    A Bearish Breakout for Candle Traders

    Talking Points

    • Traders can use Candlestick patterns to modify their strategy to price action clues.
    • The Three Inside Down pattern can confrim new market breakouts
    • This pattern can signal an opportunity to take profits or place new market entries


    Understanding candlestick charts continues to be the backbone of price action analysis for the Forex market. Once traders understand the basics, they can then begin to compile a series of candles to form patterns to confirm potential changes and market direction. Often candle patterns are also used to confirm an existing idea. Today we will review the Three Inside Down pattern and how it can be used in your trading.


    Three Inside Down Pattern

    TheThree Inside Down candle pattern is actually a continuation of the Harami. Pictured above,we can see that this pattern is broken into three distinct candles. First again we have a large engulfing candle. This blue candle represents the end of bullish momentum as trading pauses with an inside bar creating the Harami. The third candle confirms the markets new downward bias with price breaking to lower lows. Not only should the body of candle number three closes below the second candle, It should close beneath the first candle as well.

    This pattern is considered a strong candle for the fact that traders get an extra candle for market confirmation. As price moves toward lower lows traders can then look for new selling or retracement opportunities.

    Let’s look at a current example.

    Learn Forex – AUDUSD Daily & Three Inside Down


    Uses in Trading

    Above we can see an effect Three Inside Down pattern on the AUDUSD daily graph. After a strong bullish move, the AUDUSD consolidated with an inside candle. The third candle confirmed the markets direction, with a break of price support. After its creation, the market put in its current high then quickly descended 556 pips to for a higher low on the chart.

    Traders looking to take advantage of the Bullish Three Inside Down pattern can add it into any existing trending market plan to identify changes in market direction. Traders may even trade independently it with an inside bar breakout strategy. Regardless of the method taken, traders should track their progress with a trading journal and periodically review how candle analysis is working in their trading.

    ---Written by Walker England, Trading Instructor

    More...

  10. #280
    member ForeCastle's Avatar
    Join Date
    Apr 2013
    Posts
    1,077
    Blog Entries
    242

    Australian Dollar Weakness versus Kiwi Could Mean Downtrend Continues

    Talking Points
    -MACD Crossovers are used by Forex Traders to spot reversals in trend direction
    - Using trend direction to filter MACD signals can reduce the number of false signals
    - AUDZND has rallied to the top of a downtrend channel as the MACD line is crossing below its signal line generating a sell signal

    Sometimes Forex traders do not want to trade currency pairs that are highly correlated to Europe, the US or Japan. Debt ceiling and US Fed “Taper Talk”, fast moving Yen pairs, Eurozone crisis; where can traders go to escape the excess volatility and headline driven markets?

    Forex Strategies-audnzd-h4-metaquotes-software-corp-temp-file-screenshot-29729.png


    The answer may lay south of the equator. The AUD/NZD also known as the “Aussie Kiwi” is not a fast mover but often displays very clear and predictable trends. Many traders like the slow and steady trends of AUDNZD.

    Learn Forex: AUDNZD Downtrend


    Notice the above chart as gains in this pair were capped on October 27th at 1.1579 and have been in freefall since making that high. There has been a series of lower swing highs and lower swing lows forming this downtrend. The rallies higher and the subsequent drop was confirmed a few candles later by MACD.

    When I look for trends to trade, I like for them to be fairly obvious with price action moving down from the upper left to the lower right. AUD/NZD fits that description. When the red MACD line crosses down below its blue MACD signal line, a sell signal is generated. MACD is a lagging indicator so the initial move down has already started. MACD helps to confirm this move and gives a trader added confidence that there is a further decline ahead. In addition, a bearish rejection from the 1.1200 resistance zone a close below 1.1160 could lead to a move lower to the bottom of the channel near 1.1057. The 1.1030 level could be the next destination as a long-term 2005 trendline could offer support.

    AUD/NZD may be no speed “demon” with an average daily range of 74 pips. However, the “slow and steady” approach won the race for the turtle over the rabbit and this approach may make Aussie Kiwi a winner as well.

    ---Written by Gregory McLeod Trading Instructor

    More...

Page 28 of 44 FirstFirst ... 18 26 27 28 29 30 38 ... LastLast

LinkBacks (?)

  1. 10-09-2013, 10:11 PM

Tags for this Thread

Bookmarks

Posting Permissions

  • You may not post new threads
  • You may not post replies
  • You may not post attachments
  • You may not edit your posts
  •