Page 37 of 43 FirstFirst ... 27 35 36 37 38 39 ... LastLast
Results 361 to 370 of 430
Like Tree6Likes

Forex Strategies

This is a discussion on Forex Strategies within the Trading Systems forums, part of the Trading Forum category; Talking Points: MVAs show the average price of a currency for a specific number of periods As price moves so ...


  1. #361
    member ForeCastle's Avatar
    Join Date
    Apr 2013
    Posts
    1,077
    Blog Entries
    236

    Getting Started with Moving Averages

    Talking Points:

    • MVAs show the average price of a currency for a specific number of periods
    • As price moves so will the indicator, giving clues about the current market
    • Traders can filter a trading decision based on the position of price relative to a MVA


    Simple Moving Averages (MVAs) consist of some of the most versatile and widely used indicators in the market. Typically MVAs are used for filtering the trend, support and resistance levels, as well as market entries. Today we will continue our look at indicators by reviewing one of these components to get you comfortable using MVAs in your trading strategy. Let’s get started!

    MVAs and the Trend

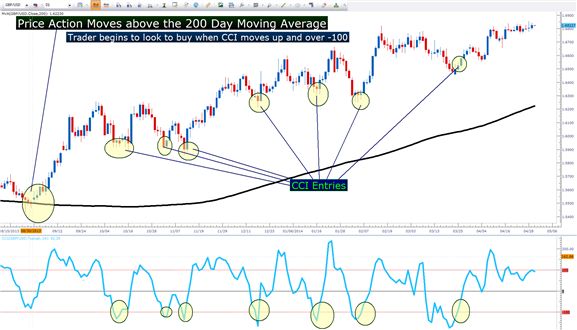
    First you may be asking, “What is a moving average?” Moving averages are simple technical tools that are designed to measure the average price presented on a graph for a designated number of periods. For example the 200 period MVA is shown below. This means that the closing price has been taken for the last 200 periods, added them together then finally divided that sum out again by 200. Once this number has been established, the average is printed on the graph as a frame of reference.

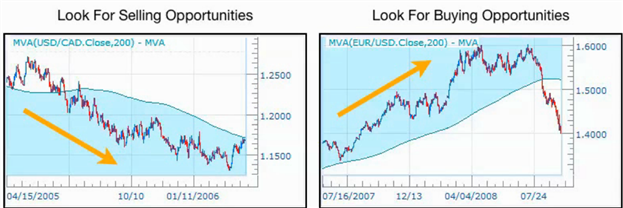
    Below we can see a USDCAD daily graph with price trending downward. You should notice as price trends downward, the MVA will begin moving lower as well. With price moving down faster than the 200 period MVA this is a strong signal that the market is declining.Likewise as price moves upward, the average will slowly move towards higher highs as well. Knowing this, we can now work the MVA into our trading.


    Trading with a MVA Filter

    Once a 200 period MVA has been added to your chart, you can easily decipher whether you should be considering a buy or sell position. The best trading environment for new buying positions would be in an uptrend as price moves towards higher highs, while the currency pair stays above the 200 MVA. The example below shows opportunities to buy the EURUSD as it rallies above the average. Since the trend is up, at no time should traders consider a sell based position!

    This bias abruptly changes when prices move below the designated 200 period MVA. Since the price on this USDCAD daily chart is below the average traders should at no point consider new positions buying the pair. As price moves towards lower lows and stays below the average, only new sell positions should be considered. Now that you have filtered for the trend, you can focus your attention to timing new entries with the market!


    Trading with MVAs

    Filtering for the trend is just one of three key ways you can utilize the Moving Average in your trading!

    ---Written by Walker England, Trading Instructor

    More...

  2. #362
    member ForeCastle's Avatar
    Join Date
    Apr 2013
    Posts
    1,077
    Blog Entries
    236

    Long-Term Chart Indicators on AUDUSD Point To One Thing

    Talking Points

    • The Value of Long Term Indictors
    • What’s Aligning on AUDUSD?
    • The AUD Outlook for Summer 2014


    There has been a lot of excitement around the Australian Dollar andspecifically, the AUDUSD for most of 2014 so far. The latest Commitment of Traders (COT) report from the US CFTC shows that leveraged players continued to buy AUDUSD in the week to Tuesday April 22. This was the 6th week in a row that they have been net buyers. What’s more, the positioning between large speculators and commercial hedgers are at 52-week extremes which tip us to the fact that something is on the horizon and longer term indicators may be telling us what that could be.

    Learn Forex: Large Players Have an Opposing View


    The Value of Long Term Indictors

    Analysis and trading are two completely different things. Trading off weekly indicators is not recommended but they can help you view where the path of least resistance may lie. Today, we’ll look at Ichimoku, long-term polarity points on the chart, and stochastics. Together, these tools can help us see that we’re at a critical juncture on the chart showing that the path of least resistance on AUDUSD may very well be to the downside.

    What’s Aligning on AUDUSD?

    This week aligns a lot of key economic data for the US Dollar which has been searching for a bottom of late. While we may not find the bottom for the US Dollar and could push lower, a handful of key technical indicators are showing that momentum on the bullish AUDUSD run is hitting a wall. The first indicator that looks specifically at momentum is Slow Stochastics is in dangerous territory for AUDUSD bulls.

    Learn Forex: Slow Stochastics Show AUDUSD is looking Top-heavy Again


    The chart above shows that another potential corrective rally could be running on fumes. The highlighted section shows the lack of follow through as slow stochastics top out. Another weekly chart that should bring caution is the Weekly Ichimoku Chart.

    Learn Forex: Weekly AUDUSD Ichimoku with Polarity Point


    This chart starts when AUDUSD bottomed in 2008. You’ll notice after the peak in 2011, AUDUSD has continued to slip. What’s more, a critical level was breached that is a highlighted rectangle on my chart. That box shows an intermediate top before pushing higher in 2009-2010, then caught a corrective low in late 2011 before seeing some action again around late 2013-present. What’s key is that this box that has been pivotal on the chart alight in the area that we recently pushed lower on, 0.9400.

    There are a few other tools like Fibonacci Time Cycles and Elliott Wave that show a key move in the Aussie is approaching. Either way, you need to manage your risk to make sure that if this trade doesn’t pan out, you have margin left over for the next move.

    The AUD Outlook for Summer 2014

    Today’s article has looked at Weekly charts. Indicators on weekly charts are often respected more than intraday charts as they take into account, large amounts of data. Whether that’s true or not, you can see that AUD is either going to be bouncing off resistance or breaking through which would bring about a major move. You've likely heard of the phrase, "sell in may and go away." This phrase has surprising merit but what's more, is that the USD & JPY often out perform other G7 currencies during this time frame as well which could also put downward pressure on AUDUSD.

    Happy Trading!
    ---Written by Tyler Yell, Trading Instructor

    More...

  3. #363
    member ForeCastle's Avatar
    Join Date
    Apr 2013
    Posts
    1,077
    Blog Entries
    236

    Three Ways to Trade with Moving Averages

    Talking Points:

    • Traders can use mathematical averaging to their advantage by employing the moving average.
    • Moving averages can be used to initiate positions in the direction of the trend.
    • Traders can incorporate multiple moving averages to fit in their strategy to accomplish specific goals.


    Indicators can be tricky tools. Knowing which ones to use and how to use them can be complicated enough; but finding out how to properly employ an entire strategy in the right market environment can be the most difficult question for traders to address.

    The Moving Average is simply the last x period’s closing prices added together, and divided by the number of observed periods (x). And it’s in its simplicity lies its beauty. When prices are trending higher, the moving average will reflect this by also moving higher. And when prices are trending lower, these new lower prices will begin to be factored into the moving average and it too will begin moving lower.

    While this averaging effect brings on an element of lag, it also allows the trader an ideal way of categorizing trends and trending conditions. In this article, we’re going to discuss three different ways this utilitarian indicator can be employed by the trader.

    As a Trend-Filter

    Because the moving average does such a great job of identifying the trend, it can be readily used to offer traders a trend-side bias in their strategies. So if price action is above a moving average, only long positions are looked at while price action below the moving average mandates that only short positions are taken.

    For this trend-filtering effect, longer-term moving averages generally work better as faster-period settings may be too active for the desired filtering effect. The 200 Day Moving Average is a common example, which is simply the last 200 day’s closing prices added together and divided by 200.

    After a bias has been obtained and traders know which direction they want to look to trade in a market, positions can be triggered in a variety of ways. An oscillator such as RSI or CCI can help traders catch retracements by identifying short-term overbought or oversold situations.

    In the picture below, we show an example of a CCI (Commodity Channel Index) Entry with the 200 day moving average as a trend filter.

    Moving Average as a Trend Filter, CCI as an Entry Trigger


    As a trigger to initiate positions

    Taking the idea of strategy development a step further, the logic of the moving average can also be used to actually open new positions.

    After all, if price action is showing a trending state just by residing above a moving average, doesn’t logic dictate that the very action of crossing that moving average can have trending connotations as well?

    So traders can also use the price/moving average crossover as a trigger into new positions, as shown below.

    The Moving Average can also be used to initiate positions in the direction of the trend


    The downside to the moving average trigger is that choppy or trend-less markets can invite sloppy entries as congested prices meander back and forth around a specific MA. So it’s highly suggested to avoid using a moving average trigger in isolation without any other filters or limitations. Doing so could mean massive losses if markets congest or range for prolonged periods of time.

    As a Crossover Trigger

    The third and final way that moving averages can be implemented is with the moving average crossover. This is an extremely common way of triggering trades, but has the undesired impact of being especially ‘laggy’ by introducing two different lagging indicators rather than just one (as is the case of using the MA as a filter or a trigger individually).

    Common examples of moving average crossovers are the 20 and 50 period crossovers, the 20 and 100 period crossover, the 20 and 200 period crossover, and the 50 and 200 period crossover (commonly called ‘the death cross’ when the 50 goes below the 200, or the ‘golden cross’ when the 50 goes above the 200).

    The 50 Day/200 Day Moving Average Crossover


    This can be taken a step further with multiple time frame analysis. Traders can look to a longer-term chart to use a moving average filter as we had outlined in the (1) part of this article, and then the crossover can be used as a trigger in the direction of the trend on the shorter time frame.

    While no indicator is going to be perfect, these three methods show the utility that can be brought to the table with the moving average, and how easily traders can use this versatile tool to trigger trades ahead and in front of very large, outsized moves in the market.

    --- Written by James Stanley

    More...

  4. #364
    member ForeCastle's Avatar
    Join Date
    Apr 2013
    Posts
    1,077
    Blog Entries
    236

    The Power of Confluence in the Forex Market

    Talking Points:

    • Psychological price levels can change trends and create swings within the market.
    • Traders can combine psychological levels with other forms of Support and Resistance to find which levels may have the most potential.
    • Areas of confluent support and resistance can offer entry potential for swings and new trends.


    Human beings often think in round numbers and traders are no different. This means that stops and limits will often exist around these ‘rounded’ intervals on the chart, and as trends move and prices surge into these batches of waiting orders; price action can change dramatically.

    Trends can be stopped dead in their tracks… and if the batch ‘sitting orders’ are large enough, a full-on reversal may be afoot.
    In this article, we’re going to attempt to take this study a step further by helping traders to notice which of these levels may end up carrying more weight with future price action.

    Support and Resistance Does Not Exist in a Vacuum

    A common question that new traders pose is ‘which type of support or resistance should I be watching or which is most important?’
    The only truthful answer to this question is that it’s impossible to know which support or resistance level may elicit a change in price behavior until it’s already happened.

    But traders can attempt to see which prices may carry more power by aligning multiple permutations of support or resistance analysis, and looking for commonalities.
    Let’s walk through an example together.

    In EURUSD earlier this morning, selling denominated the early portion of the European session. Prices dropped from 1.3715 to 1.3650 in the first four hours of European trade.
    In the first hour of trade, prices moved down to the S1 weekly pivot point (the red line on the chart at a price of 1.3771), and then selling slowed. It didn’t stop, as prices still moved lower; but it did slow.

    Confluence can be powerful, in both the short and long-term


    Over the next 3 hours, price action grinded lower until a price of 1.3650 was hit (a minor psychological level highlighted by the first yellow circle), at which point buyers began to come in. Notice how price action oscillated between the psych level, and the S1 Pivot for four hours, even attempting to move lower but reversing yet again at 3650 (second yellow circle).
    After the second attempt at breaking 1.3650, sellers retreated and buyers took over, as prices then began moving higher, eventually catching resistance at the psychological level of 1.3725 (third yellow circle).

    This is confluence; and while the S1 weekly pivot point wasn’t enough to turn around prices, the combined force of the S1 pivot along with a psychological support/resistance level at 1.3650 certainly was. This is why traders want to use multiple forms of support and resistance identification, because you never know which one (or which combination) will impact prices until after it’s happened.
    Why/How does confluence work?

    The bigger question to ask is why technical analysis might work?

    The logic behind technical analysis is that if enough people are seeing something, and thus reacting to those stimuli, it can potentially become a self-fulfilling prophecy.

    Take the 200-day moving average as an example. If every trader in the world were watching AUDUSD trade up to the 200-day moving average; and if enough traders sell under the premise that resistance may come in – that can change the supply and demand in that market, and that can create a reversal in price (more buying than selling means prices will move up). In the example below, we can see how the confluent level of .9750 in AUDUSD promulgated a strong reversal in the trend.

    Confluence can exist between indicators and psychological levels


    Support and resistance levels are no different. As prices approach these levels, traders observe the potential for a reversal.
    And when multiple support or resistance levels exist in the same region or area, this is called ‘confluence,’ and this confluence of support or resistance can offer traders multiple reasons for prices to reverse or stall; making potential trade ideas for swings or reversals even stronger than they might be otherwise.

    How to Find Confluent Levels of Support and Resistance

    Just as we said in the earlier portion of this article, traders are best served by following and observing multiple forms of support and resistance analysis.

    Price action can be used to validate which levels have been valuable, as traders can notice swings in prices or reactions in markets to see which price levels have elicited new behaviors.

    But traders can attempt to see which levels may offer a higher chance of exhibiting support or resistance in the future by applying multiple studies.
    Longer-term pivot points (weekly and monthly) will usually generate considerable interest, and the same can be said for Fibonacci retracement levels within longer-term trends.

    Traders can apply these on the longer-term charts as I had in the EURUSD example, while following the more granular psychological support and resistance levels on the longer-term charts.

    Traders can also look to indicators, as we had in the AUDUSD example with the 200-day moving average. Parabolic SAR, Volatility bands, or Price Channels can all be applied to the chart in the trader’s search for confluent levels of support or resistance.

    How to Trade Support and Resistance Confluence

    So support and resistance confluence can show us areas where reversals or swings may take place, but what’s next?
    Traders should keep in mind that there is no form of analysis that will predict future price movements. If there were, there would be no reason for me to write this article, or for you to read it. Trading would be easy because we could follow this ‘holy grail’ all the way to the promise land. Unfortunately, the future is and will remain unpredictable.

    Instead, trading is about probabilities. And seeing an up-trend stall at resistance, or a down-trend pause during support simply shows us an area where a reversal in price may take place.

    As price action signals potential reversals, traders can look at this as an opportunity for a potential trade entry with a positive risk reward ratio. As in, if you’re right – you can look to make $2 for every $1 that you’re risking in the event that you’re wrong. This is the effort to avoid the Top Trading Mistake, or The Number One Mistake that Forex Traders Make.

    Traders can use price action to signal entries after integrating Support and/or Resistance


    You can use this in combination with multiple time frame analysis to trade retracements in ‘major’ trends on longer-term charts; or you can even include additional indicators such as I do in my short-term momentum trading strategy.

    The possibilities are endless; but provided traders are focusing on risk management and risk-efficient entries, there are numerous ways that support and resistance confluence can beneficially be integrated into a trader’s approach.

    --- Written by James Stanley

    More...

  5. #365
    member ForeCastle's Avatar
    Join Date
    Apr 2013
    Posts
    1,077
    Blog Entries
    236

    USDCHF Reaches Range Resistance

    Talking Points

    • Range markets can provide opportunities for observant traders
    • The USDCHF has reached a point of resistance in a Daily Range
    • Traders can use oscillators to confirm entries for their strategy


    Have you ever experienced a market that seemed to be going nowhere fast? When the market lacks direction, this may seem as a deterrent to traders. However, the opposite is quite true! Sideways markets are known as ranges and can provide trading opportunities for the observant trader. Today we examine an example of the range developing on the USDCHF and discuss techniques to trading this technical setup.

    First traders must learn to identify a range. The good news is, ranges are some of the easiest to pinpoint through the use of horizontal support and resistance lines. These areas can be found by connecting a series of high and low points on your graph. Below we can see our example on the USDCHF. A line of resistance has been formed by connecting the April 4th and May 15th peaks. The lows from March 3rd and May 8th have been connected to form acting support.

    Learn Forex – USDCHF Daily Range


    Trading The Range

    Once a range has been identified, traders need to develop a plan for order execution. The easiest way to go about trading a range is to wait until the market reaches the previously mentioned points of support or resistance. Since the range is a directionless based strategy, traders will look to sell resistance, and look to buy areas of support.

    Once a trade has been placed, risk can be managed through a stop placed outside of the identified lines of support and resistance. That way trades will be exited in the event of a breakout. Traders can then set profit targets at the opposing point of the range. This will allow traders to complete a positive risk reward ratio while range trading by making more pips in the event of a profitable position, relative to the amount risked in the event of a loss.

    Learn Forex – Trading The Range


    Confirming Entries

    One final technique for trading ranges, involves employing an oscillator on entry. This step can be added to any range trading plan to pinpoint an entry into the market. This can be done by aligning an oscillators overbought and oversold levels with the previously mentioned lines of support or resistance values. Let’s look at an example of how this may work.

    Here again is our example on the USDCHF daily chart. Notice how price has tested resistance and traders may now be looking to execute fresh sell positions. Traders may choose to wait patiently and only enter a fresh order when an oscillator, such as CCI , returns from an overbought position. This signal can be a strong indicator of momentum heading back towards support, providing an additional execution trigger. Once this is done, traders may then continue setting up stop and limit orders as previously mentioned.

    Learn Forex – USDCHF Range with CCI


    Now that you are a little more familiar with trading ranges, you can begin practicing your trading.

    ---Written by Walker England, Trading Instructor

    More...

  6. #366
    member ForeCastle's Avatar
    Join Date
    Apr 2013
    Posts
    1,077
    Blog Entries
    236

    The Day Trader’s Plan

    Talking Points:

    • Traders are often best served by having a well-thought-out plan.
    • We look at the what, how, when, and why of the trading plan below.


    Regardless of what you’re doing in this world, it often helps to have a plan. The harder the task, the more helpful a well thought-out plan can be.

    A plan is practically a necessity for anyone with the courage and the capital to speculate in markets. In this article, we’re going to look at a template for a day-trader’s trading plan. We’re going to use the same model shared in the article, How to Build a Four-Point Trading Plan, but we’re going to focus this plan specifically on trading short-terms (day-trading). If you’d like a more detailed trading plan, we shared this type of template in the article, The Trader’s Plan.

    The What

    This is the portion of the plan where the trader defines the type of activities they want to perform in the market. Because this is a plan built for short-term traders, the primary options to be decided upon are the market condition to be focused on and the amount of risk that will be taken on each trade and each day.

    Markets display three different types of conditions; and traders should focus their strategy on one


    But another important component for short-term traders to add here is risk amounts. Traders can list how much they’re going to risk on any individual trade idea, as well as their maximum risk in a day.

    So, for example, traders can list that they’ll risk .5% of their account on any one trade, while allowing themselves 5% for the entire day. So, if 5% of the trader’s equity is lost at any point, all trades are closed and greener pastures are sought tomorrow.

    This type of model gives the trader 10 attempts, and if 10 consecutive trades get stopped out (hitting the 5% threshold), activities for the day are stopped.

    This way, if a trader is having a really bad day and can’t seem to hit water if they fall out-of-a-boat, they have a safety mechanism to ensure that this one bad day doesn’t turn into a career-altering event.

    The How

    This is where the trader documents and defines their strategy. This is probably the portion of the trading plan that will get the most attention, and take the most time to complete.

    The key to remember here is that there isn’t just one way to do this. There are no holy grails, or ‘can’t miss’ strategies, so don’t worry about trying to recreate the wheel here.

    The image below depicts the entry protocol of the strategy, and you can certainly check out the article if you’d like more information on the full strategy:


    But just because this is my strategy, it doesn’t mean that it’s the only way that a market can be traded short-term. Another popular option is to look at trading ‘swings’ or short-term reversals in price.

    Regardless of how a trader is looking to speculate in a market, longer-term support and resistance levels should be a part of the strategy. These price levels can assist with grading market conditions, or managing risk for short-term trend traders; and they can be extremely important for entries in range and breakout-related strategies.

    The When

    This is the portion of the plan with which the trader sets their ‘working hours.’

    Since the FX market is open 24 hours, the ability (and desire) to jump into trades or positions is a constant temptation. If a trader has a good morning, and they see that there are some especially attractive opportunities later on that night, they might have a hard time passing them up.

    But in reality, the FX market can trade pretty differently from one session to the next, and for the day-trader or scalper these differences can be enormous; so much so that short-term traders are often best served by choosing the most amenable time-of-day to employ their strategy.

    Time-of-day can have huge impacts on a market’s price action


    From the image above, we can see that volatility is usually highest during the ‘overlap’ period when prices are coming in from both London and New York market centers (approximately 8-11AM Eastern Time).

    For traders executing trending or breakout-related scalping strategies, this would be the time of day that could present the most opportunities.

    On the flip side, volatility generally decreases in the Asian-trading session (which was called The Best Time of Day for FX Traders in our Traits of Successful Traders series). If a speculator is looking to implement a short-term range strategy, this could be more ideal than the more volatile London or US sessions.

    The Why

    This last portion of the plan is the motivation. This is where you can list the reason(s) that you want to become a better trader.

    The simple act of writing down your goal can make that goal a very real thing. I realize this may sound corny, or like ‘new-age’ type-of-thinking; but trading is not easy. Traders have to learn how to lose properly; they’re going to face losing and drawdown periods that can be psychological torturous. These periods can make it difficult to get excited about opening up your platform each morning to look for new trades. This is the reason that traders fail; it’s not because profitability is impossible, it’s just that it might not be as easy as that person had initially hoped.

    End your trading plan with your goals, and let those goals drive you through the difficult periods so that you can find and prosper in greener pastures.

    --- Written by James Stanley

    More...

  7. #367
    member ForeCastle's Avatar
    Join Date
    Apr 2013
    Posts
    1,077
    Blog Entries
    236

    How Highly Correlated Equity Markets Can Lead To a Currency Trade

    Talking Points:

    • The High Correlation of JPN225 to USDJPY
    • Bullish Key Week on Nikkei 225
    • USDJPY Implications


    Many of the major markets are becoming increasingly correlated. In fact, it’s tough to get a feel for currencies or commodities without checking the bond market and stock market as well. While some markets are more closely related than others, one equity market has held an amazingly tight correlation to a currency pair for a very long time.

    The High Correlation of JPN225 to USDJPY


    Visually, it’s easy to see that, ‘as goes the Nikkei, so goes USDJPY’. If you’re comfortable with the correlation coefficient reading, since the beginning of May, USDJPY has been positively correlated to the JPN225 or Nikkei by a matter of 0.821. If you’re not familiar with the correlation coefficient, it is a statistical number between -1 & +1 calculated to present the linear depending of two variables. 1.0 is a perfect positive correlation and -1.0 is a perfect inverse correlation. Anything above 0.5 or below -0.5 is considered a significant correlation, including of course, USDJPY & JPN225 at 0.821.

    Because traders are always working to build an edge, we can look for signs of strength in one to help us see upcoming strength in the other. Let’s breakdown some of the developments in both markets and specifically the JPN225 to see what may be on the horizon for the JPY crosses.

    Bullish Key Week on Nikkei 225 & More!

    A lot of bullish developments on the JPN225 were formed on the close of the weekly candle. Let’s break them down before talking about their currency implications:


    The first thing that many traders look for on a chart is a price action signal. One of my favorite signals is known as a Bullish Key candle where the candle pushes lower than the prior low but closes higher than the prior candle’s high. This is additionally important if the low is a new low for a significant period of time or of significant support which you can see is true on JPN225 above.

    Secondly, you’ll notice a cloud on the chart below price. This cloud is part of the dynamic Ichimoku indicator. In uptrends, Ichimoku’s cloud will often act as support and in downtrends, Ichimoku’s cloud may act as resistance. Given the bullish key week off the weekly cloud touch, that adds significance to the move.

    Lastly, you’ll see a trendline drawn from the high from the start of 2014. Price has stayed below this trendline on a closing basis until last week’s close. Trendline breaks are simple ways to see that if nothing else, a trend is losing momentum and could soon be reversing.

    Now that we’ve seen three components that argue for further upside in the JPN225, let’s see how this could apply to Forex given the high correlation earlier discussed.

    USDJPY Implications


    The USDJPY has yet to move as explosively higher in the same way as JPN225. However, upon close look, you’ll see there are budding developments on USDJPY that could bring opportunity to buyers. Let’s have a closer look on a tighter time frame.

    Learn Forex: A Closer Look at USDJPY


    USDJPY is not without its positive signs. We’ve had a bounce similar to the Oct. ’13 low which resulted in a 900+ pip push higher. Last week, the Bank of Japan Governor, Kuroda mentioned that he didn’t see JPY strengthening against the USD (read: doesn’t seeing going lower) and he commented on the “very strong” economic recovery in the US vs. the one in Japan.

    However, with the evidence in favor of upside, let’s take a look at the chart resistance ahead. There is a cluster of resistance point between the May 13th high of 102.36 & the May 2nd high of 103.02. If we can have a weekly close through these levels, then a retest of the prior highs could very well be under way. If price stays below these levels, it would appear that the correction still needs to complete before moving higher.

    Happy Trading!
    --Written by Tyler Yell, Trading Instructor

    More...

  8. #368
    member ForeCastle's Avatar
    Join Date
    Apr 2013
    Posts
    1,077
    Blog Entries
    236

    Chinese Yuan

    Talking Points:

    • USDCNH is now available to trade for FXCM traders.
    • SSI is a polarizing -10 (91% retail traders are short).
    • Potential buy trade based on SSI and support at 6.2340.


    Unlike stock traders and their IPOs, Forex traders rarely have new instruments to trade. Except recently when FXCM added the US Dollar / Chinese Yuan pair, USDCNH, to their platforms. I've been eyeing the charts for awhile waiting for an opportunity to trade and believe there might be a trade setup on the horizon.
    Adding USD/CHN onto Your Trading Platform

    If you are a FXCM trader, you now have access to trade the Yuan even if you hadn't realized it yet. But you might need to add it onto your account's dealing rates window before you can trade. The Yuan can be added inside the Trading Station platform by going to Symbols --> USDCHN --> Apply. You can also follow the visual instructions below.

    Learn Forex: Adding the USDCHN Pair into the Dealing Rates Window


    Once the pair has been added, you will see it available in the dealing rates window and inside the Marketscope charts' symbol drop down list. We are now ready for analysis.

    Extreme Sentiment Readings for the Chinese Yuan

    More than 90% of FXCM traders with a position on the USDCNH are short. Those familiar with how the SSI works know that this presents an opportunity where we can trade against the retail crowd and Buy the USDCNH. We can see in the picture below, as the SSI has reached lower lows in the last 3 weeks, USDCNH's prices have reached higher highs.

    Learn Forex: USDCNH SSI


    We are trading based on the belief that this move will continue to the upside as long as SSI is at these extreme SSI levels, but how should we go about opening up this trade?
    Technicals Line Up to Support 6.2340

    The final part of my analysis on this new pair are the trend lines that have formed on a 4-hour chart. There are primary and secondary price channels, and a tertiary trend line that have affected price action throughout the last couple months. In 3 days time, we will be at a point in time where all three of these trend lines will cross, creating a strong confluence of support.

    Learn Forex: Buy Setup for USDCNH (US Dollar / Chinese Yuan)


    As pictured above, if the USDCNH were to fall near that support zone around the time when these trend lines meet, we could see a bounce back towards 6.2500, 6.2750, or beyond. This would put our entry order to buy around 6.2340. A stop loss below these levels at 6.2250 could be appropriate to cut losses quickly if the trade moves against us. Targets could be set as high as 6.2750 if USDCNH were to reach the top of the primary price channel in the next couple of weeks.

    Winning With a Weak Yuan


    So the table has been set. It is possible that the Yuan will not gain enough strength by Friday to hit this interesting price level, but if it does, it could be a nice way to start off trading this new currency pair with both strong sentiment and technical analysis backing it.

    Good trading!
    ---Written by Rob Pasche

    More...

  9. #369
    member ForeCastle's Avatar
    Join Date
    Apr 2013
    Posts
    1,077
    Blog Entries
    236

    Follow The Fractal Tool Toward Better Breakout Entries

    Talking Points:

    • Fractals Defined
    • How Traders Can Use Fractals
    • Real-Time Fractal Set-Up

    “You can either buy low & sell high or trade with the trend, but you cannot do both.”
    -Bill Williams

    Many traders spend too much time looking for the best possible entry. However, the entry can be based on any number of technical indicators. For traders who are a fan of price-action, you could do no worse than finding triggers based on a fractal breakout in the direction of the trend.

    Fractals Defined


    Let’s start with an introduction to fractals. The actually are applied to trading from nature and not the other way around. It may be helpful to know that fractals are effectively a way of looking a sub-sets of large pieces of data to understand what developments are being created in real-time. From a trading / market perspective, fractals are an indicator highlighting the chart’s local highs and lows where the price movement reversed marking a 5-bar high or low. These reversal points are called respectively Fractal highs and lows.

    Learn Forex: The Hand is a Perfect Fractal


    Before we take this natural reoccurrence to the market, you should see how your hand, with fingers pointing up is the perfect up fractal and with your palm facing you, is a perfect down fractal. A Market swing Fractal shows a price extreme in the middle of 5 bars whereas an up fractal has the middle bar with a highest high in the middle with two lower highs on the left and two lower highs on the right. A down fractal will have a low price extreme in the middle bar of a 5-bar sequence with the higher lows on the left and two higher lows on the right.

    How Traders Can Use Fractals

    Volatility is a key determinant to trading opportunities. One of the common triggers that volatility is in play is when a prior high or low is taken out and a new trend begins. Fractals can be applied to the chart so that you can see when a recent key level has broken which can lead to a price-action trading opportunity.

    Learn Forex: Pinpoint Key Price Action Swings With Fractals


    Fractals revolve around price action highs and lows and can easily pinpoint places for a breakout entry or tight price action based stop. Fractals can be used in a variety of ways. Most commonly, traders will look for a bar to close above a prior up fractal to show an upside breakout or a close below a prior down fractal to signal a downside breakout that is potentially worth trading. Another positive aspect is that when you have a comfortable view of a strong trend in play, you can use fractals as a trailing stop from a prior counter-trend move which made a fractal.

    Real-Time Fractal Set-Up


    For purpose of review, fractals mark price changes or pivots in the market. For reasons known or unknown, they are reaction points that can help you spot key places to place an entry order or stop. From a trader’s stand-point, they allow you to enter on a confirming view of your analysis vs. a hunch that a market is oversold or overbought and is time to enter like this trade set-up on the Australian Dollar.

    Learn Forex: A Fractal Based Entry on AUDUSD


    Every trader should embrace the following seven words:
    I don’t know what will happen next

    This isn’t meant to disregard your analysis but tell a simple fact about trading. Anything can happen in the market place and an infinite number of possibilities are plausible. As a trader, we can develop a strategy with set rules that work with our psychology to give us an edge but it will not predict the future. Therefore, we can use fractals as a trigger to put us into a trade or out of a trade and we may not know if the trade will end in a profit but we can now that we’re only acting on objective evidence.

    Happy Trading!
    ---Written by Tyler Yell, Trading Instructor

    More...

  10. #370
    member ForeCastle's Avatar
    Join Date
    Apr 2013
    Posts
    1,077
    Blog Entries
    236

    USDCHF Breakout Hindered by 200-Day Moving Average

    Talking Points:

    • The USDCHF break has run into the 200 Day Moving Average.
    • Potential buyers could enter upon a confirmed break above the 200 Day MA.
    • Sentiment has been indecisive all week, not giving us a clear reading.

    The 200-Day Simple Moving Average

    The 200-Day Simple Moving Average is one of the most popular indicators in the world. When price breaks through a 200 MA on a daily chart, it can often be seen as a topic of conversation on financial news stations, websites and newspapers.
    It is primarily used to give traders and investors an overall sense of how strong or weak a currency pair is.

    Typically, when a currency pair’s price falls below the 200 Day MA, it is a sign of weakness with a potential for further price decline. And when a currency pair’s price breaks above the 200 Day MA, it is a sign of strength with a potential for further price increases.

    Learn Forex: USDCHF vs 200 Day Moving Average

    Forex Strategies-usdchf-d1-metaquotes-software-corp-temp-file-screenshot-27642.png


    The chart above shows the recent price action surrounding the 200 Day MA. We see a large run up in price breaking through multiple resistance levels until it met this powerful MA line. We have had 6 consecutive days where price has temporarily broke through the 200 Day MA or price has come within 10 pips of the line before retreating lower. So this level is acting as strong resistance.

    If price were to remain below the MA, it could propel it lower back into the pair’s price channel. However, a breakout to the upside could add yet another reason to buy the USDCHF. Until we witness a larger price move, we are in a state of limbo.

    Indecisive SSI for the USDCHF

    Ever since the stalemate caused by the 200 Day Moving Average, sentiment has moved sideways as well. After the first flip in SSI in months, we have since seen 3 flips in the last week alone. This gives some insight on the uncertainty of where the USDCHF could be headed. This can be seen in the graph below where we track both price and SSI indecisiveness.

    Learn Forex: Speculative Sentiment Index (SSI) on USDCHF


    I am still partial to a long position on the USDCHF, but not as strongly as I was last week. Reducing existing trade size could be a smart money management move, or waiting for a confirmed break of the 200-Day Moving Average before buying.

    Good trading!
    ---Written by Rob Pasche

    More...

Page 37 of 43 FirstFirst ... 27 35 36 37 38 39 ... LastLast

LinkBacks (?)

  1. 10-09-2013, 09:11 PM

Tags for this Thread

Bookmarks

Posting Permissions

  • You may not post new threads
  • You may not post replies
  • You may not post attachments
  • You may not edit your posts
  •