
 LinkBack URL
 About LinkBacks


Forex: USD/CHF Technical Analysis
Talking Points:
- USD/CHF Technical Strategy: Flat
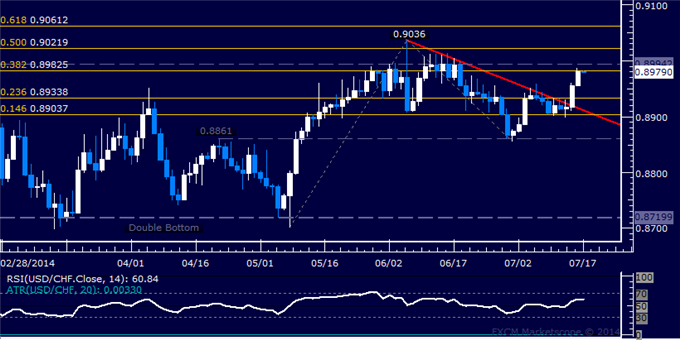
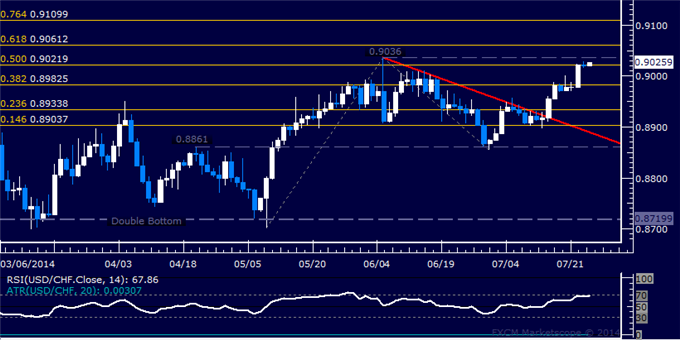
- Support: 0.8986 (23.6% Fib exp.), 0.8947 (trend line)
- Resistance: 0.9038 (38.2% Fib exp.), 0.9081 (50% Fib exp.)
The Swiss Franc pulled back against the US Dollar yesterday but prices failed to reclaim a foothold above support-turned-resistance at 0.9038, the 38.2% Fibonacci expansion. A daily close above this barrier initially exposes the 50% level at 0.9081. Alternatively, a reversal below support at 0.8986, the 23.6% Fib, eyes a rising trend line set from mid-December (now at 0.8950).
On balance, positioning is little-changed from yesterday, with prices oscillating in a choppy range around familiar levels and offering little by way of a discernibly attractive trade setup. We will keep to the sidelines for now, waiting for something actionable to emerge.
More...


 Reply With Quote


Bookmarks