Page 46 of 70 FirstFirst ... 36 44 45 46 47 48 56 ... LastLast
Results 451 to 460 of 698
Like Tree1Likes

Tifia Daily Market Analytics

This is a discussion on Tifia Daily Market Analytics within the Analytics and News forums, part of the Trading Forum category; USD/CAD: Before Important Events 30/04/2019 According to data published at the beginning of today's Asian session, the official Purchasing Managers ...


  1. #451
    Senior Member TifiaFX's Avatar
    Join Date
    Mar 2017
    Posts
    697
    USD/CAD: Before Important Events
    30/04/2019

    According to data published at the beginning of today's Asian session, the official Purchasing Managers Index (PMI) for the non-manufacturing sector in China fell to 54.3 in April from 54.8 in March. The index for the non-production sphere reflects the dynamics of activity in such areas as retail, air travel, software development, real estate market and construction. The decline was due to a weakening of demand and activity in construction.
    The official PMI for the manufacturing sector in China also fell in April, to 50.1 from 50.5 in March. The decline in the index was due to the weakening of production and domestic demand.
    According to Caixin, PMI for China's manufacturing sector in April was 50.2 against 50.8 in March. Unlike the official index, which reflects the dynamics of activity of large state-owned companies, PMI Caixin pays more attention to the status of private producers.
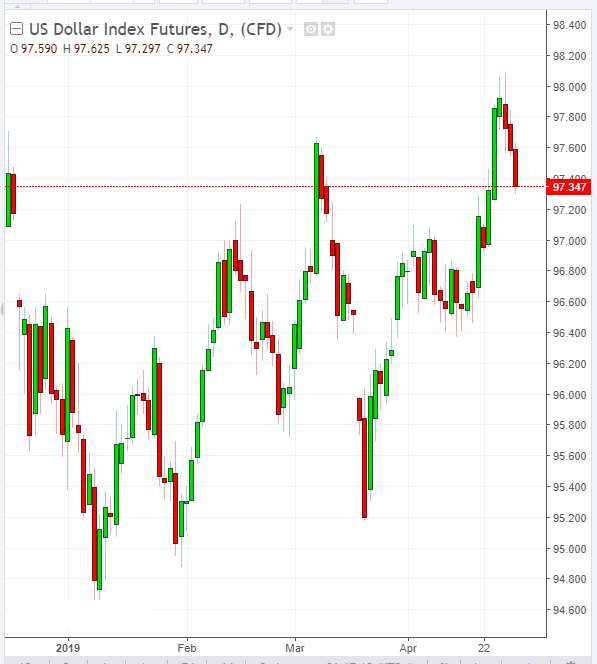
    The data presented caused a short-term strengthening of the US dollar, primarily against the RMB and commodity currencies, including the Canadian dollar.
    In the course of the European session, the dollar is falling again. Investors are switching their attention to future important events. On Wednesday (18:00 GMT) the decision of the Fed on the interest rate will be published, and on Friday (12:30 GMT) - data from the US labor market.
    Some economists expect the Fed to cut rates in December due to lower US inflation rates. Comments by Fed officials and labor market data will provide insight into the current state of the US economy and give the dollar a new impulse, either for growth or for decline.

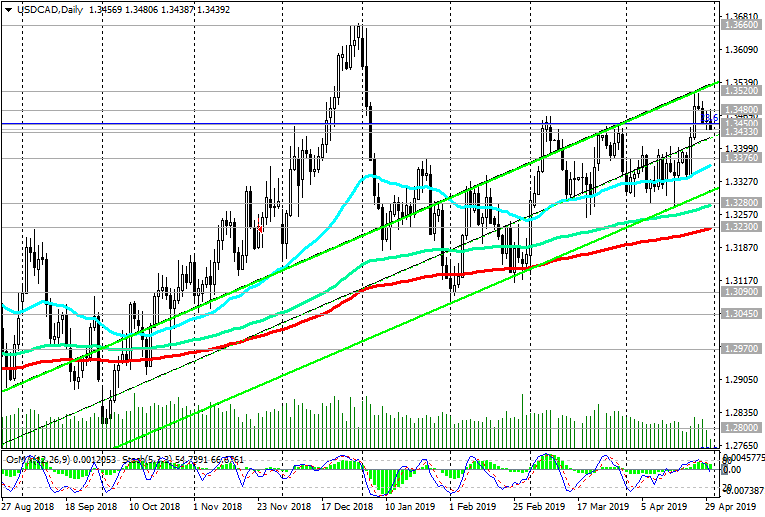
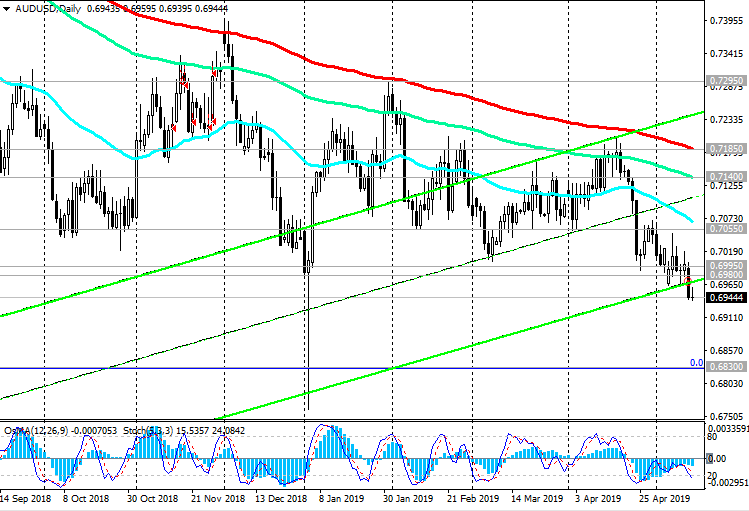
    Despite the current decline, USD / CAD maintains a long-term positive trend, trading above key support levels of 1.3280 (EMA144), 1.3230 (EMA200 on the daily chart). The breakdown of local resistance levels of 1.3480, 1.3520 will be a signal for the resumption of long positions with targets at resistance levels of 1.3660 (highs of 2018), 1.3790 (highs of 2017).
    Support Levels: 1.3433, 1.3400, 1.3376, 1.3300, 1.3280, 1.3230
    Resistance Levels: 1.3480, 1.3520, 1.3600, 1.3660, 1.3790
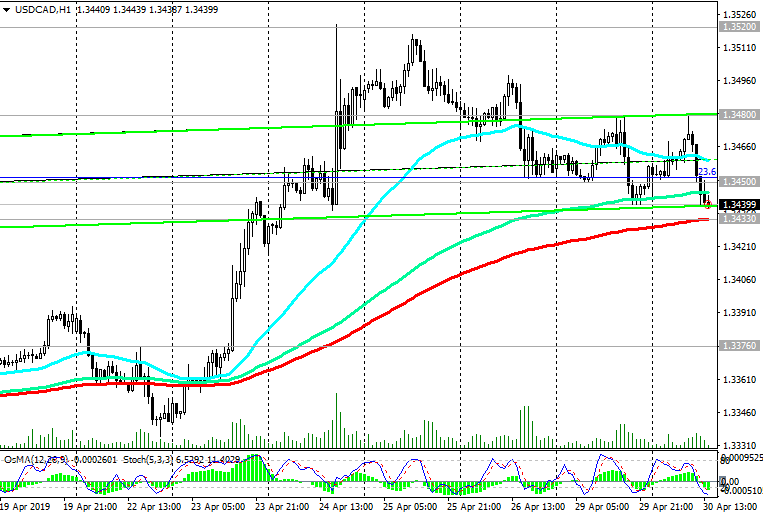
    Trading Scenarios

    Sell Stop 1.3425. Stop-Loss 1.3490. Take-Profit 1.3400, 1.3376, 1.3300, 1.3280, 1.3230
    Buy Stop 1.3490. Stop Loss 1.3425. Take-Profit 1.3520, 1.3600, 1.3660, 1.3790


    *) For up-to-date and detailed analytics and news on the forex market visit Tifia Forex Broker website tifia.com

  2. #452
    Senior Member TifiaFX's Avatar
    Join Date
    Mar 2017
    Posts
    697
    EUR/USD: Current Dynamics
    Eurodollar continues to decline. At the beginning of the European session on Friday, EUR / USD is trading at 1.3020. Pending publication (12:30 GMT) of a report from the US labor market, trading volumes are declining. If the report (average hourly wage, the number of new jobs created outside the agricultural sector, the unemployment rate) will be better than the forecast (+ 0.3% (against + 0.1% in March) / 180,000 (against 196,000 in March ) / 3.8% (against 3.8% in March)), then the strengthening of the dollar and the fall of EUR / USD will continue.
    The alternative scenario implies a rebound and the beginning of an upward correction of EUR / USD with targets at resistance levels of 1.1190, 1.1200 (ЕМА200 on the 1-hour chart), 1.1210, 1.1244 (ЕМА200 on the 4-hour chart). A more distant goal of the correction is resistance levels of 1.1255 (ЕМА50 on the daily chart), 1.1285 (Fibonacci level 23.6% of the correction to the fall from the level of 1.3900 started in May 2014), 1.1360 (ЕМА144), 1.1410 (ЕМА200 on the daily chart). Below resistance level 1.1285 short positions are preferable.
    Support Levels: 1.1125, 1.1100, 1.1000
    Resistance Levels: 1.1190, 1.1200, 1.1210, 1.1244, 1.1285, 1.1360, 1.1410

    Trading recommendations

    Sell in the market. Stop Loss 1.1220. Take-Profit 1.1125, 1.1100, 1.1000
    Buy Stop 1.1220. Stop-Loss 1.1155. Take-Profit 1.1244, 1.1285, 1.1360, 1.1410


    [img]https https://i.postimg.cc/t41Ggr0k/030519-EU-H4.png[/img]
    *) For up-to-date and detailed analytics and news on the forex market visit Tifia Forex Broker website tifia.com

  3. #453
    Senior Member TifiaFX's Avatar
    Join Date
    Mar 2017
    Posts
    697
    XAU/USD: current dynamics
    06/05/2019

    US President Donald Trump once again shocked the markets with his statement. On Sunday, he tweeted: “For 10 months, China paid the US $ 50 billion in high-tech products at a rate of 25% and 10% in other products worth $ 200 billion. These payments partially explain our huge economic success. These 10% will increase to 25% on Friday". He also wrote about the imminent imposition of duties in the amount of 25% on imports of goods that were not subject to duties from China in the amount of $ 325 billion.
    Chinese yuan and Chinese stock indexes collapsed at the opening of the trading day on Monday.
    Quotes of gold again crawled up. The pair XAU / USD at the beginning of the European session was trading near the mark of 1282.00, above the key support level of 1275.00 (ЕМА200 on the daily chart).
    Above the key support levels of 1277.00 (Fibonacci level 61.8% of the correction to the wave of decline since July 2016), 1275.00 (EMA200 on the daily chart), the upward trend prevails. The XAU / USD growth targets are resistance levels of 1312.00, 1323.00, 1345.00 (highs of February and 2019).
    An alternative scenario involves the breakdown of the support level of 1268.00 and
    decrease of XAU / USD in the direction of the important support level of 1248.00 (Fibonacci 50%). Breakdown of this level will return XAU / USD to the global bearish trend with targets at support levels of 1197.00 (November lows), 1185.00 (Fibonacci 23.6%), 1160.00 (2018 lows).
    Support Levels: 1279.00, 1277.00, 1275.00, 1268.00, 1248.00
    Resistance Levels: 1288.00, 1296.00, 1312.00, 1323.00, 1345.00, 1357.00, 1365.00, 1370.00

    Trading Scenarios

    Sell Stop 1274.00. Stop Loss 1288.00. Take-Profit 1268.00, 1248.00, 1234.00, 1220.00, 1197.00, 1185.00, 1160.00
    Buy Stop 1288.00. Stop Loss 1274.00. Take-Profit 1296.00, 1312.00, 1323.00, 1345.00, 1357.00, 1365.00, 1370.00


    *) For up-to-date and detailed analytics and news on the forex market visit Tifia Forex Broker website tifia.com

  4. #454
    Senior Member TifiaFX's Avatar
    Join Date
    Mar 2017
    Posts
    697
    NZD/USD: Current Dynamics
    05/07/2019

    On Sunday, US President Donald Trump unpleasantly surprised investors with two Twitter messages that by Friday duties on Chinese goods would be increased. Trump's statements provoked a sharp drop in many global markets.
    US Trade Representative Robert Lightheiser stated that in recent days "China has retreated from its promises". According to Lightheiser, duties on Chinese goods will be increased on Friday, as Trump warned.
    The economy of New Zealand is closely connected with the economy of China, which is the largest buyer of raw materials and food (primarily meat and dairy) goods from New Zealand. Therefore, any negative information from China also negatively affects the NZD quotes.
    On Tuesday, NZD / USD declines again after falling the previous day. The next meeting of the RBNZ will be held on Wednesday, and the decision on the rate of the RBNZ will be published on Wednesday at 02:00 (GMT). Probably, the rate will be reduced by 0.25% to 1.5%.
    Currently, NZD / USD is again attempting to break the local support level of 0.6600. Its breakthrough may trigger a further decline to support levels of 0.6510, 0.6430.
    So far, short positions look preferable.
    Support levels: 0.6575, 0.6510, 0.6430
    Resistance levels: 0.6660, 0.6700, 0.6745, 0.6780, 0.6800, 0.6935, 0.6980, 0.7060

    Trading scenarios

    Sell Stop 0.6590. Stop Loss 0.6670. Take-Profit 0.6575, 0.6510, 0.6430
    Buy Stop 0.6670. Stop Loss 0.6590. Take-Profit 0.6700, 0.6745, 0.6780, 0.6800, 0.6935, 0.6980, 0.7060


    *) For up-to-date and detailed analytics and news on the forex market visit Tifia Forex Broker website tifia.com

  5. #455
    Senior Member TifiaFX's Avatar
    Join Date
    Mar 2017
    Posts
    697
    S&P500: Current Situation
    05/08/2019

    In April, the S&P500 updated the annual and absolute maximum near the 2959.0 mark. On Wednesday, the decline in the S&P500 continues despite the fact that, overall, the positive trend continues.
    While the S&P500 index is trading above the key support level of 2770.0 (ЕМА200 on the daily chart), the long-term positive trend remains. Long positions are preferred above this level.
    Nevertheless, negative information, first of all, the negative course of negotiations between US and Chinese trade representatives, as well as negative economic news from the US, will cause a decrease in indices, and, as the worst-case scenario, will provoke another wave of decline.
    The indicators OsMA and Stochastic on the daily, 4-hour charts turned to the short positions, signaling a likely continuation of the decline.
    On Wednesday, the publication of important macro data is not planned, and Europe celebrates Victory Day. The decline in world and US indices may continue, while representatives of China and the United States will seek a solution to the situation.
    Support Levels: 2860.0, 2810.0, 2770.0, 2720.0
    Resistance Levels: 2885.0, 2915.0, 2937.0, 2959.0

    Trading recommendations

    Sell Stop 2858.0. Stop Loss 2902.0. Objectives 2810.0, 2770.0, 2720.0
    Buy Stop 2902.0. Stop Loss 2858.0. Objectives 2915.0, 2937.0, 2959.0

    *) For up-to-date and detailed analytics and news on the forex market visit Tifia Forex Broker website tifia.com

  6. #456
    Senior Member TifiaFX's Avatar
    Join Date
    Mar 2017
    Posts
    697
    AUD/USD remains in a long-term bearish trend.
    05/10/2019

    On Friday, the United States raised duties on imports of Chinese goods in the amount of $ 200 billion from 10% to 25%, as previously promised by US President Donald Trump. He also said on Thursday that the US will introduce new duties in the amount of 25% on the import of Chinese goods in the amount of $ 325 billion. Thus, all goods imported from China to the United States will be subject to duties of 25%.
    The foreign exchange market, on the whole, on Friday rather restrainedly reacted to this news, since it was already mainly taken into account in prices.
    Meanwhile, the US trade representative Robert Lighthizer and the country's finance minister Stephen Mnuchin met with Chinese Vice Premier Liu He and agreed to continue the discussion on Friday. This allows us to preserve hope for further progress in the negotiations and the fact that both parties will come to a solution to the conflict.
    From the news today, investors will also pay attention to the publication at 12:30 (GMT) of data on consumer inflation in the United States. It is expected that the consumer price index rose in April by + 0.4% (+ 2.1% in annual terms). If the data turns out to be better than the forecast, then the USD will strengthen, including with respect to AUD. With the escalation of international trade wars, the American dollar is in demand and looks more preferable than AUD.
    AUD / USD remains in a long-term bearish trend. At the beginning of the European session on Friday, AUD / USD is trading near the 0.7000 mark.
    Below resistance levels 0.7011 (ЕМА200 on the 1-hour chart), 0.7065 (ЕМА200 on the 4-hour chart) short positions are preferable.
    Breakdown of the local support level of 0.6980 will increase the risks of further decline towards support levels of 0.6910 (lows of September 2015), 0.6830 (lows of 2016).
    Support Levels: 0.6980, 0.6910, 0.6830
    Resistance Levels: 0.7011, 0.7065, 0.7145, 0.7190

    Trading Recommendations

    Sell in the market. Stop Loss 0.7020. Take-Profit 0.6980, 0.6910, 0.6830
    Buy Stop 0.7020. Stop Loss 0.6970. Take-Profit 0.7065, 0.7145, 0.7190
    [img]httpshttps://i.postimg.cc/RCY0wsbb/100519-DXY.png[/img]


    *) For up-to-date and detailed analytics and news on the forex market visit Tifia Forex Broker website tifia.com

  7. #457
    Senior Member TifiaFX's Avatar
    Join Date
    Mar 2017
    Posts
    697
    S&P500: Current Dynamics
    05/13/2019

    Despite negotiations, on Friday the White House raised customs duties on Chinese goods worth $ 200 billion from 10% to 25%. Moreover, the USA threatened to introduce additional duties for another 325 billion dollars, i.e. on all Chinese imports. Beijing said it would retaliate.
    The aggravation of the trade conflict between the United States and China led to increased fluctuations in world markets. Last week, the US S & P 500 index suffered the most severe losses since the beginning of the year.
    Many economists have warned that new duties and barrage trade barriers threaten the United States with a slowdown in economic growth.
    On Monday, the major US stock indices are falling, and futures for the S & P500 index at the beginning of the European session is trading near the mark of 2848.0. Probably, the American session will also begin with the fall of the indices.
    In case of fixation below the support level of 2860.0, the S & P500 will go to support level of 2770.0 (ЕМА200 on the daily chart). While the S & P500 index is trading above this key support level, long-term positive dynamics remain.
    Nevertheless, purchases can be resumed after the S & P500 consolidates in the zone above the short-term resistance levels of 2883.0 (ЕМА200 on the 4-hour chart), 2890.0 (ЕМА200 on the 1-hour chart).
    The indicators OsMA and Stochastic on the daily, 4-hour, 1-hour charts turned to the short positions, signaling a likely continuation of the decline.
    Support Levels: 2860.0, 2810.0, 2770.0, 2720.0
    Resistance Levels: 2883.0, 2890.0, 2915.0, 2937.0, 2959.0

    Trading Recommendations

    Sell Stop 2840.0. Stop Loss 2870.0. Objectives 2810.0, 2770.0, 2720.0
    Buy Stop 2870.0. Stop Loss 2840.0. Objectives 2883.0, 2890.0, 2915.0, 2937.0, 2959.0


    *) For up-to-date and detailed analytics and news on the forex market visit Tifia Forex Broker website tifia.com

  8. #458
    Senior Member TifiaFX's Avatar
    Join Date
    Mar 2017
    Posts
    697
    AUD/USD: trade conflict between the US and China threatens the global economy
    05/14/2019

    Last Monday, China announced its intention to raise duties on US imports of about $ 60 billion in response to US actions on Chinese imports. This raised investors' concerns that the US-China trade standoff would lead to a further slowdown in the global economy.
    According to economists, because of the trade war, China’s GDP growth in 2019 could be less than 6%, and the US dollar / Chinese yuan pair could rise to 7.2000.
    The President of the Federal Reserve Bank of Boston, Eric Rosengren, said on Monday that the escalation of the trade conflict between the United States and China increases the risk of negative developments in the economy.
    Financial markets reacted to these events with a fall in stock indices, a rise in the price of the Japanese yen, government bonds and gold, as well as a fall in commodity prices and commodity currencies. First of all, it refers to the Australian dollar. China is Australia's largest trading and economic partner and a buyer of its commodities, such as liquefied gas, coal, iron ore, and gold.
    External and internal macroeconomic background contributes to increasing pressure on the RBA in the direction of lowering the interest rate, and on the Australian dollar - in the direction of its further reduction.
    In this situation, the AUD / USD pair is likely to continue to decline, even regardless of the Fed's actions. With the escalation of international trade wars, the US dollar still looks preferable to other currencies due to the greater stability of the American economy in this situation.
    *)An advanced fundamental analysis is available on the Tifia Forex Broker website at tifia.com/analytics

    Trading Scenarios
    AUD / USD remains in a long-term bearish trend. The last wave of decline began in January 2018 from the level of 0.8120. AUD / USD remains under pressure below key resistance levels of 0.7140 (ЕМА144 on the daily chart), 0.7185 (ЕМА200 on the daily chart).
    Nevertheless, the breakdown of the resistance levels of 0.6995 (ЕМА200 on the 1-hour chart), 0.7055 (ЕМА200 on the 4-hour chart) may provoke a continuation of the upward correction to the resistance level of 0.7140. At the moment and below the resistance levels of 0.7140, 0.7185, short positions with targets at support levels of 0.6910 (lows of September 2015), 0.6830 (2016 lows) are preferable.
    Support Levels: 0.6910, 0.6830
    Resistance Levels: 0.6980, 0.6995, 0.7055, 0.7140, 0.7185

    Trading Scenarios

    Sell in the market. Stop Loss 0.6965. Take-Profit 0.6910, 0.6830
    Buy Stop 0.6965. Stop Loss 0.6935. Take-Profit 0.6980, 0.6995, 0.7055, 0.7140, 0.7185


    *) For up-to-date and detailed analytics and news on the forex market visit Tifia Forex Broker website tifia.com

  9. #459
    Senior Member TifiaFX's Avatar
    Join Date
    Mar 2017
    Posts
    697
    WTI: the price has reached the zone of important support levels
    05/15/2019

    Participants in the oil market are concerned about the escalation of trade confrontation between China and the United States and the slowdown in global economic growth. The International Energy Agency (IEA) on Wednesday lowered its forecast for global oil demand growth in 2019 by 90,000 barrels per day to 1.3 million barrels per day. These are negative fundamental factors for oil prices. At 14:30 (GMT), the Energy Information Administration of the US Department of Energy will publish its regular weekly report, according to which, reserves are expected to grow by 2.984 million barrels. If the forecast is confirmed, oil prices may resume their decline.
    At the beginning of the European session on Wednesday, WTI crude oil is trading near the 61.10 mark, through which there is a strong support level (ЕМА50 and the lower line of the ascending channel on the daily chart). In case of a breakdown of this level, the price will fall to support levels of 59.90 (ЕМА200 on the daily chart) and 59.50 (Fibonacci level 50% of the upward correction to a fall from the highs of the last few years near the 76.80 mark to the support level near the 42.14 mark). Above these levels, a long-term upward trend is maintained.
    If China and the United States nevertheless succeed in reaching an agreement, while negotiations between the representatives of the two countries continue, it is likely that oil prices will rise again.
    The signal for the resumption of purchases will be the breakdown of the short-term resistance level of 61.85 (ЕМА200 on the 1-hour and 4-hour charts). In this case, the price will go to the recent highs near the 66.50 mark and further, to the 70.00 mark, through which the upper line of the ascending channel passes on the daily chart.
    The alternative scenario will be associated with the breakdown of the support level of 59.50 and a decrease to the support level of 57.00 (EMA200 on the weekly chart). Breakdown of support levels 57.00, 55.40 (Fibonacci 38.2%) will revive the bearish trend.
    Support Levels: 61.10, 59.90, 59.50, 57.00, 55.40
    Resistance Levels: 61.85, 63.50, 64.40, 66.50, 68.00, 70.00

    Trading Scenarios

    Sell Stop 60.60. Stop Loss 62.10. Take-Profit 59.90, 59.50, 57.00, 55.40
    Buy Stop 62.10. Stop Loss 60.60. Take-Profit 63.50, 64.40, 66.50, 68.00, 70.00


    *) For up-to-date and detailed analytics and news on the forex market visit Tifia Forex Broker website tifia.com

  10. #460
    Senior Member TifiaFX's Avatar
    Join Date
    Mar 2017
    Posts
    697
    GBP/USD: Current Dynamics
    05/16/2019

    The pound continues to fall. The situation around Brexit has remained the main driver of the pound since mid-2016, when a Brexit referendum was held. At this time, the pound falls on information from the fact that the Prime Minister may lose his post, and his place will be taken by a supporter of tough Brexit.
    Theresa May was unable to advance in negotiations with the opposition Labor Party to support the Brexit agreement. And even among the members of her Conservative Party, there are more and more of her opponents.
    Having broken through the key support levels of 1.3045 (ЕМА200 on the daily chart), 1.3020 (ЕМА144 on the daily chart), on Thursday the GBP / USD pair has been falling for 9 days in a row and is trading on Thursday at the beginning of the European session, near the 1.2830 mark.
    Indicators OsMA and Stochastic on the 4-hour, daily, weekly charts recommend short positions.
    A further weakening of the pound will lead to a decline in GBP / USD to support levels of 1.2700 (lows of October and August 2018), 1.2600.
    Purchases will be possible only after GBP / USD returns to the zone above the short-term resistance level of 1.2960 (ЕМА200 on the 1-hour chart) with growth targets at resistance levels of 1.3045, 1.3210 (Fibonacci level 23.6% of the correction to the decline of GBP / USD in the wave, started in July 2014 near the level of 1.7200), 1.3370 (March and year highs), 1.3610 (ЕМА200 on the weekly chart).
    So far, short positions are preferred.
    Support Levels: 1.2800, 1.2778, 1.2700, 1.2660, 1.2600
    Resistance Levels: 1.2870, 1.2960, 1.3020, 1.3045, 1.3100, 1.3125, 1.3167, 1.3210

    Trading Scenarios

    Sell in the market. Stop Loss 1.2880. Take-Profit 1.2800, 1.2778, 1.2700, 1.2660, 1.2600
    Buy Stop 1.2880. Stop Loss 1.2820. Take-Profit 1.2960, 1.3020, 1.3045, 1.3100, 1.3125, 1.3167, 1.3210


    *) For up-to-date and detailed analytics and news on the forex market visit Tifia Forex Broker website tifia.com

Page 46 of 70 FirstFirst ... 36 44 45 46 47 48 56 ... LastLast

Tags for this Thread

Bookmarks

Posting Permissions

  • You may not post new threads
  • You may not post replies
  • You may not post attachments
  • You may not edit your posts
  •