Page 11 of 70 FirstFirst ... 9 10 11 12 13 21 61 ... LastLast
Results 101 to 110 of 698
Like Tree1Likes

Tifia Daily Market Analytics

This is a discussion on Tifia Daily Market Analytics within the Analytics and News forums, part of the Trading Forum category; XAG/USD: demand for precious metals has increased 09/08/2017 Current dynamics The escalation of geopolitical tensions, provoked by North Korea's threats ...


  1. #101
    Senior Member TifiaFX's Avatar
    Join Date
    Mar 2017
    Posts
    697
    XAG/USD: demand for precious metals has increased
    09/08/2017

    Current dynamics

    The escalation of geopolitical tensions, provoked by North Korea's threats against the United States, caused a sharp increase in demand for safe haven assets - yen, franc and precious metals. In recent days, North Korea has threatened to use nuclear weapons against the US in the event of a military provocation. Yesterday, the media reported that the North Korean army is "carefully studying" the operational plan for a missile strike on Guam. If the plan is implemented, "the United States will be the first to experience the power of strategic weapons", the DPRK said.
    On Tuesday, US President Donald Trump demanded that North Korea "stop further threats" against the US, saying that the answer would be "the fire and fury that the world has not seen so far".
    At the end of yesterday's trading session and with the opening of today's trading day, prices for precious metals soared. The troy ounce of gold has risen today by 7 dollars to 1267.00 dollars, silver - by 0.2 dollars to 16.60 dollars.
    The investors' withdrawal from risks in connection with the increased geopolitical tension provoked also a decline in world stock indices and a rise in prices for government bonds.
    As long as the situation around North Korea does not calm down, the demand for safe haven assets will continue. The dollar will also remain under pressure, despite strong data on the US labor market, published on Friday, which increases the likelihood of further interest rate increases in the US this year.
    Precious metals do not bring investment income. However, in the context of increasing economic or political uncertainty, the demand for precious metals as a safe haven is growing. Under conditions of an increase in the interest rate in the US, the price of precious metals is falling, as the cost of their acquisition and storage is growing.
    Today, investors will follow the publication (at 12:30 GMT) of data on labor costs and labor productivity in the US (excluding the agricultural sector) for the 2nd quarter. Positive data will support the dollar. Expected to grow by 1.2% and 0.7%, respectively.
    Investors also expect the release of inflation data in the US (on Friday 12:30 GMT) to assess the pace of inflation acceleration after its recent slowdown. The growth of inflation indices can strengthen expectations regarding the increase in interest rates of the Fed, and this is a negative factor for the precious metals market. The probability of another increase in interest rates in the US this year is estimated today at about 46%, according to the CME Group.
    *)An advanced fundamental analysis is available on the Tifia website at tifia.com/analytics

    Support and resistance levels
    Since the middle of April, the pair XAG / USD is declining in the descending channel on the daily chart. The lower boundary of the channel passes near the 14.30 mark (July lows), and the upper one - near the level of 16.80. A little higher, near the 17.00 mark, the resistance level passes (EMA200 on the daily chart). While XAG / USD is below these levels, the downward trend prevails, despite the current upward correction associated with the escalation of tensions between the US and North Korea.
    In case of breakdown of the support level of 16.45 (EMA200 on 1-hour and 4-hour charts), the descending dynamics will return, and after the breakdown of the local support level of 16.12 (August lows), the pair XAG / USD will go into the downlink on the daily chart with targets of 15.60, 14.90, 14.30 (July lows), 13.65 (the minimum of the global wave of decline in the pair XAG / USD since September 2012).
    Support levels: 16.45, 16.12, 15.60, 15.25, 14.90, 14.30, 13.65
    Resistance levels: 16.80, 17.00

    Trading Scenarios

    Sell Stop 16.43. Stop-Loss 16.68. Take-Profit 16.38, 16.12, 15.60, 15.25, 14.90, 14.30
    Buy Stop 16.68. Stop-Loss 16.43. Take-Profit 16.80, 17.00


    *) For up-to-date and detailed analytics and news on the forex market visit Tifia company website tifia.com

  2. #102
    Senior Member TifiaFX's Avatar
    Join Date
    Mar 2017
    Posts
    697
    NZD / USD: monetary policy has not changed
    10/08/2017
    Current dynamics

    As expected, the RBNZ kept the current interest rate in New Zealand at the same level of 1.75%. The RBNZ stated that against the backdrop of "many uncertainties," monetary policy "will remain soft in the foreseeable future," but "can be adjusted accordingly." For a stable recovery of the New Zealand economy and rising inflation of the value of traded goods, "a lower New Zealand dollar rate is needed."
    In response to the publication of the decision on the rate of the pair, the New Zealand dollar / dollar briefly jumped to 0.7370 from 0.7340, but then declined during the Asian session, and at the beginning of the European session it was already trading near the 0.7270 mark.
    Commodity currencies, including the New Zealand dollar, continue to decline in the foreign exchange market amid the continuing geopolitical tensions in the Asian region. The second day in a row, North Korea is threatening the United States. On Tuesday, the media reported that the North Korean army is "carefully studying" the operational plan for a missile strike on Guam. "The United States will be the first to experience the power of strategic weapons," the DPRK declared. US President Donald Trump demanded that North Korea "stop further threats" against the US, saying that the answer would be "the fire and the rage that the world has not seen so far." This time, North Korea threatened to "shell out from all sides" the territory of Guam in the coming weeks.
    As a result of its 10-day decline, the pair NZD / USD completely leveled its July growth. According to economists, "the current rate is more appropriate to short-term fundamental factors" and "approached its average value over the past year."
    As the geopolitical situation in the Asian region stabilizes, the New Zealand dollar will be able to maintain its position in the foreign exchange market due to rising commodity prices, also receiving support from long-term investors who prefer safe long-term investments. Preservation of the current interest rate at 1.75% in the long term will also contribute to this.
    *)An advanced fundamental analysis is available on the Tifia website at tifia.com/analytics

    Support and resistance levels
    The pair NZD / USD broke through an important short-term support level of 0.7350 (EMA200 on the 4-hour chart) and remains under pressure. Today, the NZD / USD pair has reached an important support level of 0.7285 (EMA200 on the weekly chart) and is developing a downward movement to the level of support
    0.7240 (Fibonacci retracement level of 38.2% of the upward correction to the global wave of decline of the pair from the level of 0.8800, which began in July 2014, the low of December 2016).
    Indicators OsMA and Stochastics on the 4-hour, daily, weekly charts went to the side of sellers, signaling a strong negative impulse.
    While NZD / USD is trading above the support level of 0.7150 (EMA200 on the daily chart), the upward dynamics is maintained. In the case of breakdown at the level of 0.7150, a further decline to support levels of 0.6860 (Fibonacci level of 23.6% and a lower limit of the range located between the levels of 0.7550 and 0.6860) is possible. At the level of 0.6860 are also the minimums of December 2016 and May 2017. A break at the level of 0.6860 will mean the end of the upward correction, which began in September 2015, and a return to the downward trend.
    The alternative scenario is to return to the zone above the level of 0.7350 and resume growth towards the annual maximum and the resistance level of 0.7550 (50% Fibonacci level). Meanwhile, it is too early to talk about long positions on the NZD / USD pair. Only a breakdown at 0.7550 would mean the end of the global bearish trend.
    Support levels: 0.7240, 0.7150
    Resistance levels: 0.7285, 0.7350, 0.7418, 0.7455, 0.7500, 0.7550

    Trading Scenarios

    Sell Stop 0.7250. Stop-Loss 0.7310. Take-Profit 0.7200, 0.7150
    Buy Stop 0.7310. Stop-Loss 0.7250. Take-Profit 0.7418, 0.7455, 0.7500, 0.7550, 0.7600


    *) For up-to-date and detailed analytics and news on the forex market visit Tifia company website tifia.com

  3. #103
    Senior Member TifiaFX's Avatar
    Join Date
    Mar 2017
    Posts
    697
    Brent: World oil supply grows
    11/08/2017
    Overview and dynamics

    As reported today by the International Energy Agency (IEA), the world oil supply in July increased by 520,000 barrels a day, even despite the arrangements in OPEC. Growth in the supply of oil has been observed for 3 consecutive months. The supply of oil in the world increased in July to 98.16 million barrels per day, which is by 500,000 barrels per day more than in the same period last year. OPEC oil production in July increased by 230,000 barrels per day and reached 32.84 million barrels per day, the high of 2017. The increase in OPEC production of the cartel is primarily due to the increase in production in Libya and Nigeria, which are exempt from participation in the transaction.
    The investors' skepticism about the effectiveness of OPEC measures is maintained due to poor compliance with the agreements on the reduction of oil production. All this imposes a negative imprint on the dynamics of oil prices.
    Prices fell on Thursday, despite the earlier data from the US Energy Ministry on oil reserves in the US (Wednesday 14:30 GMT). According to the report of the Energy Information Administration (EIA) of the United States, US oil inventories fell 6.451 million barrels last week, which was the sixth consecutive week.
    Today we are waiting for the publication at 17:00 (GMT) of the report of the oilfield service company Baker Hughes on the number of active drilling platforms in the US, which is an important indicator of the activity of the oil sector of the US economy and significantly affects the quotes of oil prices.
    The US successfully used the situation with a rise in prices against OPEC actions last year and increased production by 750,000 barrels a day to 9.3 million barrels per day, the highest since summer 2015. In fact, by the efforts of the US alone, more than a third of the reduced production was offset.
    At the moment, there are 765 active drilling rigs in the USA. If the number of installations increases again, this will negatively affect oil prices.
    *)An advanced fundamental analysis is available on the Tifia website at tifia.com/analytics

    Support and resistance levels
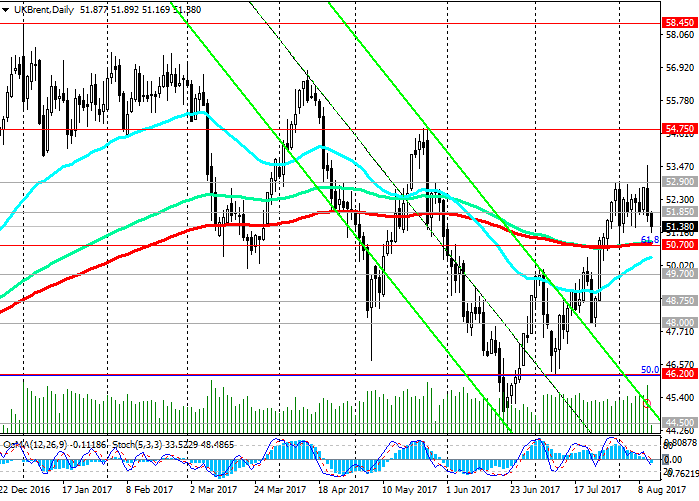
    The price of Brent crude oil was unable to develop an upward trend above the resistance level of 52.90 (EMA144 on the weekly chart) on Thursday and the second day is going down.
    While the price is below the short-term resistance level of 51.85 (EMA200 on the 1-hour chart), the downside dynamics will increase, and the downside correction target will be the support level of 50.70 (EMA200, EMA144 on the daily chart, EMA50 on the weekly chart, as well as Fibonacci 61, 8% correction to the decline from the level of 65.30 from June 2015 to the absolute minimums of 2016 near the mark of 27.00).
    Indicators OsMA and Stochastics on the 4-hour, daily charts went to the side of sellers.
    If the price breaks through the key support level of 50.70, then the decline will accelerate, risking again moving into a bearish trend. The targets then will be support levels 49.70, 48.75, 48.00, 46.20 (50% Fibonacci level), 44.50 (lows of the year). The more distant goal is the level 41.70 (the Fibonacci level of 38.2% and the lower boundary of the descending channel on the weekly chart).
    The scenario for growth implies breakdown of the resistance level of 52.90 and an increase to the resistance level of 54.75 (EMA200 on the weekly chart and May highs). The signal to growth will be the fixing of the price above the level of 51.85.
    Support levels: 51.00, 50.70, 50.00, 49.70, 48.75, 48.00, 47.70, 46.20, 45.50, 44.50, 41.70
    Resistance levels: 51.85, 52.90, 54.00, 54.75

    Trading Scenarios

    Sell Stop 51.10. Stop-Loss 52.10. Take-Profit 50.70, 50.00, 49.70, 48.75, 48.00, 46.20, 44.50
    Buy Stop 52.10. Stop-Loss 51.10. Take-Profit 52.90, 54.00, 54.75


    *) For up-to-date and detailed analytics and news on the forex market visit Tifia company website tifia.com

  4. #104
    Senior Member TifiaFX's Avatar
    Join Date
    Mar 2017
    Posts
    697
    XAU/USD: the dollar regains positions
    14/08/2017
    Current dynamics

    Friday's weak inflation data in the US, as well as an escalation in tensions between the US and North Korea, caused the dollar to fall on Friday and the demand for safe haven assets was growing.
    As reported by the US Labor Department, in July, consumer prices rose by 0.1% (the forecast was + 0.2%). The index pointed to a worsening of the outlook for price growth in the US, which weakened expectations of an increase in interest rates by the Fed this year.
    At the same time, US President Donald Trump said on Thursday that his previously voiced threats to reply North Korea with "fire and fury" apparently sounded "not tough enough." And on Saturday Donald Trump said that the United States is ready to strike North Korea, if it does not stop threatening the United States.
    As a result, on Friday, demand for gold continued to remain at high levels.
    On Friday, the president of the Federal Reserve Bank of Dallas, Robert Kaplan, said that the current level of interest rates is acceptable. Another Fed spokesman, the president of the Federal Reserve Bank of Minneapolis, Neil Kashkari, said that the Fed should wait with higher rates until inflation approaches the target of 2%. "We still can not reach the target level of inflation, and the growth of wages remains slow," Kashkari said.
    Now investors expect a rate hike in December with a probability of 38% (on Friday the probability was estimated at 47%), according to the CME Group.
    Gold, as you know, does not bring interest income. But it is growing in price in periods of low interest rates and political or economic instability in the world.
    So far, the demand for it is supported, mainly against the backdrop of domestic political instability in the United States and the tension in relations with the DPRK. As the geopolitical tensions decrease, investors' attention will again shift to economic indicators.
    Still, the risk of an increase in the US interest rate in December, despite the low level of inflation, exists. Strong labor market in the US indicates a stable state of the economy in the country.
    Tomorrow, investors will focus on the publication of inflation indicators for the United States. At 12:30 (GMT) are published retail sales indices for July, which are a leading indicator, and indices of export-import prices. Forecast: retail sales increased by 0.3% (against -0.2% in June), which should support the dollar quotes.
    *)An advanced fundamental analysis is available on the Tifia website at tifia.com/analytics

    Support and resistance levels
    With the opening of today's trading day, the dollar is recovering its positions in the foreign exchange market, and gold is getting cheaper.
    Indicators OsMA and Stochastics on the 1-hour, 4-hour charts of the pair XAU / USD turned to short positions.
    Probably further decline to support levels 1277.00 (Fibonacci level 61.8% correction to the wave of decline since July 2016), 1273.00 (EMA200 on the 1-hour chart).
    In the case of breakdown of these levels and the development of a downward correction, it is likely that the support level of 1260.00 (the bottom line of the uplink and EMA200 on the 4-hour chart) will decrease to the support level.
    The breakdown of support levels 1248.00 (Fibonacci 50.0%), 1244.00 (EMA200 on the daily chart) will provoke further decline of the pair XAU / USD and its return to the downtrend.
    The alternative scenario is connected with the breakdown of the resistance level of 1295.00 (the highs of June and the year and the upper line of the range located between the levels of 1185.00 and 1295.00) and further growth.
    So far, against the background of the dollar's recovery, the downward short-term dynamics is dominating.
    Support levels: 1277.00, 1273.00, 1260.00, 1248.00, 1244.00, 1229.00, 1220.00, 1205.00, 1185.00
    Levels of resistance: 1295.00

    Trading scenarios

    Sell in the market. Stop-Loss 1285.00. Take-Profit 1277.00, 1273.00, 1260.00, 1248.00, 1244.00
    Buy Stop 1285.00. Stop-Loss 1279.00. Take-Profit 1290.00, 1295.00


    *) For up-to-date and detailed analytics and news on the forex market visit Tifia company website tifia.com

  5. #105
    Senior Member TifiaFX's Avatar
    Join Date
    Mar 2017
    Posts
    697
    GBP/USD: producer price growth slowed
    15/08/2017
    Current dynamics

    The consumer price index (CPI) of the UK in July compared with July last year increased by 2.6% (the forecast was + 2.7%). Thus, according to the data presented today, in July the annual rate of consumer inflation did not change with respect to June. But the annual growth rate of purchasing prices of producers in July slowed sharply - to 6.5% from 10% in June.
    As a result of the sharp weakening of the pound after the referendum on Brexit in May, consumer price inflation accelerated to a maximum of 2.9% in mid-2013. Against the background of the weakening of the pound, the purchasing power of the British sharply decreased, which sharply limited their spending.
    Retail sales are one of the main "fillers" of British GDP. The slowdown in inflation favorably influences the British economy, which is oriented primarily toward the domestic market. Improving the situation in the service sector for consumers, which has recovered due to strong retail sales, contributes to GDP growth in the UK. So, according to official data released last Wednesday, in the second quarter, the British economy grew by 0.3% after rising 0.2% in the 1st quarter.
    The pound declined after the publication of today's data on inflation, but the British stock index FTSE rose, indicating the favorable impact of slowing inflation on the growth of the British economy. Yet the main risk for the UK economy remains Brexit.
    For today (at 12:30 GMT) it is planned to publish important data from the US - inflation indicators for July (retail sales), as well as import-export price indices.
    High level of retail sales will strengthen the US dollar. Forecast: + 0.4% (against -0.2% in June).
    The weak values of the indicators will put pressure on the dollar, which is now recovering in the foreign exchange market after it became known that the DPRK leader Kim Jong-un decided not to attack Guam after consulting with the military command. This was also facilitated by China's decision to support the sanctions against Pyongyang imposed by the United States.
    *)An advanced fundamental analysis is available on the Tifia website at tifia.com/analytics

    Support and resistance levels
    The pair GBP / USD broke through the important short-term support levels of 1.3000 (EMA200 on the 4-hour chart), 1.2960 (EMA50 on the daily chart, the bottom line of the uplink on the 4-hour chart) and is rapidly declining to the key support level 1.2860 (EMA200 on the daily chart).
    Break of this level will speak about the completion of the upward correction and will strengthen the risks of GBP / USD returning to a downtrend.
    The alternative scenario is connected with the return of GBP / USD to the zone above the level of 1.3000 and the resumption of growth. The closest target in this case will be resistance level 1.3210 (Fibonacci level 23.6% correction to the decline of the GBP / USD pair in the wave, which began in July 2014 near the level of 1.7200). Levels of 1.3300 (the upper limit of the channel on the weekly chart), 1.3460 (July and September highs) will be the next target.
    So far, the downward trend is dominating, as evidenced by the indicators OsMA and Stochastics, which on the 1-hour, 4-hour, daily and weekly charts turned to short positions.
    Support levels: 1.2860, 1.2800
    Resistance levels: 1.2960, 1.3000, 1.3100, 1.3210, 1.3300, 1.3400, 1.3460

    Trading Scenarios

    Sell Stop 1.2850. Stop-Loss 1.2910. Take-Profit 1.2815, 1.2765, 1.2700, 1.2640, 1.2590, 1.2550, 1.2365
    Buy Stop 1.2910. Stop-Loss 1.2850. Take-Profit 1.2960, 1.3000, 1.3100, 1.3210, 1.3300, 1.3400, 1.3460


    *) For up-to-date and detailed analytics and news on the forex market visit Tifia company website tifia.com

  6. #106
    Senior Member TifiaFX's Avatar
    Join Date
    Mar 2017
    Posts
    697
    XAG / USD: demand for precious metals declined
    16/08/2017

    Current dynamics

    After the tension in relations between North Korea and the United States declined and against the background of positive data on retail sales received from the US, the dollar regains its positions in the foreign exchange market, and the demand for safe haven assets, including precious metals, is declining.
    A few hours after China supported sanctions against Pyongyang imposed by the United States, North Korea refused to threaten to attack the United States.
    As reported yesterday by the US Department of Commerce, July data on retail sales exceeded expectations, an increase of 0.6% against the forecast (0.4%). Data on retail sales supported the further strengthening of the dollar and encouraged the buyers of the dollar, putting on its further growth.
    Today, the focus of traders will be the publication (18:00 GMT) of the protocol from the July Fed meeting to understand the prospects for monetary policy in the US.
    In recent weeks, Fed officials have talked about the weakness of inflation and uncertainty in fiscal policy. Published on Friday, inflation data increased fears that the price dynamics did not meet the expectations of the Fed. The consumer price index (CPI) in July rose by 0.1% compared to June, and by 1.7% compared to July of the previous year (the target level of annual inflation established by the Federal Reserve is 2%).
    The protocols, apparently, will also contain information on the continuation of the discussion on inflation, which remains weak and, in the opinion of some leaders of the Fed, may become a hindrance to further tightening of monetary policy in the US.
    This year, the Fed will hold three more meetings devoted to monetary policy: September 19 - 20, October 31 - November 1, and December 12 - 13. After the September and December meetings, the Fed will publish its new economic forecasts, while Fed Chairman Janet Yellen will hold a press conference.
    According to the CME Group, investors are taking into account the 53% chance of raising the Fed's interest rates in the price this year. Before the release of data on retail sales, they estimated such a probability of 37%.
    As is known, in the conditions of increase in the rate the price for precious metals, including silver, falls, as the cost of its acquisition and storage is growing.
    *)An advanced fundamental analysis is available on the Tifia Forex Broker website at tifia.com/analytics

    Support and resistance levels
    The pair XAG / USD was unable to develop an uptrend above the resistance level of 17.22 (August highs and the top line of the descending channel on the daily chart). Having broken the key level 17.00 (EMA200 on the daily chart), XAG / USD is falling deeper into the descending channel on the daily chart.
    At the moment, XAG / USD is trading at the support level of 16.58 (EMA200, EMA144 on the 4-hour chart). A break of this level will signal the continuation of the downward movement.
    While XAG / USD is below the level of 17.00, the downside dynamics prevails.
    In case of breakdown of the local support level of 16.12 (August lows), the pair XAG / USD will go into the downward channel on the daily chart towards its lower boundary with the targets of 15.60, 14.90, 14.30 (July lows), 13.65 (minimum of the global wave of the pair XAG / USD decline September 2012).
    Support levels: 16.58, 16.45, 16.12, 15.60, 15.25, 14.90, 14.30, 13.65
    Levels of resistance: 16.80, 17.00, 17.22

    Trading scenarios

    Sell Stop 16.55. Stop-Loss 16.70. Take-Profit 16.45, 16.38, 16.12, 15.60, 15.25, 14.90, 14.30
    Buy Stop 16.70. Stop-Loss 16.55. Take-Profit 16.80, 17.00, 17.22


    *) For up-to-date and detailed analytics and news on the forex market visit Tifia Forex Broker website tifia.com

  7. #107
    Senior Member TifiaFX's Avatar
    Join Date
    Mar 2017
    Posts
    697
    GBP/USD: revenue growth lags behind inflation
    17/08/2017
    Current dynamics


    As follows from yesterday's July minutes of the Fed meeting, there is no consensus among US central bank executives about further interest rate hikes. Slowing inflation forced some Fed officials to propose to refrain from further raising rates. "In the current conditions, the Fed can show patience", the protocols say. Earlier, the Fed planned to raise rates three times this year, but the protocols published on Wednesday make it doubtful.
    After the publication of the minutes, the dollar fell sharply in the foreign exchange market. The index of the US dollar, WSJ, estimating the value of the dollar against 16 other major world currencies, fell by 0.4%, to 86.33.
    Nevertheless, today the dollar is recovering its positions during the European trading session. This applies to the pair GBP / USD, which is declining after the publication of data on retail sales in the UK for July. According to the National Bureau of Statistics (ONS), presented today at the beginning of the European session, retail sales growth in the UK in July was modest (+ 0.3% vs. +0.2 forecast). The estimation of sales growth for June was reduced to 0.3% from 0.6%. In annual terms, growth was also modest (+ 1.3% vs. + 1.4%, according to the forecast).
    The British economy, largely dependent on domestic consumption, grew by just 0.3% in the second quarter (+ 0.2% in the first quarter).
    According to data published earlier this week, real British salaries in June declined for the fourth consecutive month. Because of the sharp increase in inflation against the backdrop of a sharp weakening of the pound after the referendum on Brexit, the real income growth of the British lags behind inflation, which is confirmed by the almost zero increase in personal expenses of the British and the level of retail sales.
    Sales in all categories, except for food and household goods, in comparison with the previous month decreased.
    In July, inflation was 2.6% against a nearly four-year high of 2.9% in May, well above the Bank of England's target of 2%.
    We are waiting for the data from the USA today. At 12:30 (GMT), the US Department of Labor will publish a weekly report on the number of initial applications for unemployment benefits. The forecast is expected to decline to 240,000 versus 244,000 for the previous period, which should positively affect the dollar. If the data is confirmed or better, the dollar will receive additional support.
    *)An advanced fundamental analysis is available on the Tifia Forex Broker website at tifia.com/analytics

    Support and resistance levels
    Since the beginning of August, the GBP / USD pair is actively declining. On the daily chart, GBP / USD fell back to the key support level of 1.2860 (EMA200). Downward dynamics prevails. Breakdown of this level will strengthen the risk of GBP / USD returning to a downtrend.
    Indicators OsMA and Stochastic daily, weekly, monthly charts were deployed to short positions.
    An alternative scenario relates to the return of GBP / USD to the zone above the level of 1.2980 (EMA200 on 1-hour and 4-hour charts) and the resumption of growth. The closest target in this case will be the resistance level 1.3210 (Fibonacci level 23.6% correction to the decline in the GBP / USD pair in the wave, which began in July 2014 near the level of 1.7200). Levels of 1.3300 (the upper limit of the channel on the weekly chart), 1.3460 (July and September highs) will be the next growth target.
    Support levels: 1.2860, 1.2800
    Resistance levels: 1.2980, 1.3000, 1.3100, 1.3210, 1.3300, 1.3400, 1.3460

    Trading scenarios

    Sell Stop 1.2850. Stop-Loss 1.2910. Take-Profit 1.2815, 1.2765, 1.2700, 1.2640, 1.2590, 1.2550, 1.2365
    Buy Stop 1.2910. Stop-Loss 1.2850. Take-Profit 1.2960, 1.3000, 1.3100, 1.3210, 1.3300, 1.3400, 1.3460


    *) For up-to-date and detailed analytics and news on the forex market visit Tifia Forex Broker website tifia.com

  8. #108
    Senior Member TifiaFX's Avatar
    Join Date
    Mar 2017
    Posts
    697
    EUR/USD: The ECB is concerned about the strengthening of the euro
    18/08/2017
    Current dynamics

    Despite the decline in the dollar, the pair EUR / USD remains under pressure (so far in the short term). Published on Thursday, the minutes of the July meeting of the ECB pointed out that the central bank is concerned about the strengthening of the single European currency this year.
    "There were fears about the risk of excessive growth of the euro in the future", - so it was said in the minutes.
    The strengthening of the Euro-currency negatively affects the economy of the Eurozone, as it makes European goods less competitive abroad. Weak rates of inflation in the Eurozone also contribute to the ECB's prolonging the stimulus program for the Eurozone economy for at least six months.
    As you know, the program QE in the Eurozone ends in December. Despite the fact that the Eurozone economy shows signs of stable growth, which is also due to the ECB, which pursues an extra soft monetary policy, inflation is still far below the target level of the ECB just below 2.0%.
    At the same time, the dollar also remains under pressure after the minutes published on Wednesday from the July Fed meeting. Investors continue to assess the prospects for an increase in the Federal Reserve's key interest rate in December with a probability of below 40%.
    The leadership of the US central bank still can not unanimously decide to raise rates in conditions of slow inflation. And this is a negative factor for the dollar.
    Thus, the EUR / USD pair is currently in the grip of the need to maintain a low interest rate in the Eurozone and the Fed's hesitancy in the matter of monetary policy, which makes both currencies vulnerable from this point of view.
    The US dollar, meanwhile, declined during the Asian session and at the beginning of the European session.
    If we consider that today is the last trading day of the week, then in the second half of the US session, we should expect some strengthening of the US currency against the background of closing short positions on the dollar and fixing profits.
    The news background is calm today. Volatility may intensify at the beginning of the US trading session, when at 12:30 (GMT) the consumer price index (CPI) in Canada (for July) is published.
    *)An advanced fundamental analysis is available on the Tifia Forex Broker website at tifia.com/analytics

    Support and resistance levels
    The pair EUR / USD is in a downward correction short-term trend since the beginning of August, when strong data was published from the US labor market.
    Repeated attempts to test the support level 1.1690 (EMA144 on the 4-hour chart) have not yet led to its breakdown.
    If the EUR / USD decline continues, the breakdown of the support level 1.1630 (EMA200 on 4-hour and weekly charts) will strengthen the risks of a return to the downtrend.
    However, only in case of breakdown of the support level 1.1150 (EMA200 on the daily chart) will EUR/USD return to a downtrend.
    Indicators OsMA and Stochastics do not give a clear signal.
    In the alternative scenario and after the breakdown of the local resistance level 1.1780 (the Fibonacci retracement level of 38.2% of the corrective growth from the lows reached in February 2015 in the last wave of the global decline from 1.3900), the EUR / USD is likely to strengthen further. The growth targets will be the levels of 1.1835, 1.1890 (the highs of the year), 1.1950, 1.2050, 1.2180 (50% Fibonacci level).
    Support levels: 1.1690, 1.1630
    Resistance levels: 1.1780, 1.1835, 1.1890, 1.1910, 1.1950, 1.2050, 1.2180

    Trading Scenarios

    Sell in the market. Stop-Loss 1.1785. Take-Profit 1.1690, 1.1630, 1.1600, 1.1550
    Buy Stop 1.1785. Stop-Loss 1.1710. Take-Profit 1.1835, 1.1890, 1.2000, 1.2050, 1.2100, 1.2180


    *) For up-to-date and detailed analytics and news on the forex market visit Tifia Forex Broker website tifia.com

  9. #109
    Senior Member TifiaFX's Avatar
    Join Date
    Mar 2017
    Posts
    697
    DJIA: the decline continues
    21/08/2017
    Current dynamics

    After Thursday, Wal-Mart Stores and Cisco Systems reported on the results, their shares fell significantly, pulling the Dow Jones Industrial Average, which dropped 1.2% (274 points) to 21751 points. This was the most significant decline since May 2017. The shares of all 30 companies, traded in DJIA, and all 11 main sectors in the S & P500 index fell.
    A portion of the disappointing financial statements of companies, which include large retailers and giants of the technology sector, as well as the terrorist attack in Spain, provoked the strongest intraday drop in the major US stock indices, which was the second this month.
    On Monday, there is a continued decline in major US stock indexes, including DJIA. Investors' attention this week will be focused on comments by representatives of world central banks, including Fed Chairman Janet Yellen and ECB President Mario Draghi.
    In general, the negative mood of investors, the tendency to exit from risky assets and the withdrawal of funds into safe assets prevail. Thus, the yield of 10-year US bonds rose to 2.202% from 2.196%, gold quotes also remain propped up after last Friday the price of gold exceeded the annual maximum and the mark of 1300.00 dollars per ounce for a short time.
    If today the decline in indices continues, it will be the third consecutive week of falling indices. The news background today for the US stock market, in general, is neutral.
    Low trading volumes and investor caution on the eve of the Jackson Hole conference increase the likelihood of a short-term spike in volatility and a return of the price to the current range.
    *)An advanced fundamental analysis is available on the Tifia Forex Broker website at tifia.com/analytics

    Support and resistance levels
    Having broken through the important short-term support levels 21825.0 (EMA144 on the 4-hour chart), 21755.0 (EMA200), DJIA found today support at the level of 21650.0 (EMA50 on the daily chart).
    The predominant negative short-term dynamics. Indicators OsMA and Stochastics on the 4-hour, daily, weekly charts went to the side of sellers.
    Probably the continuation of the correction decrease to the level of support 21500.0 (the bottom line of the ascending channel on the daily chart).
    In case of resumption of growth and consolidation above the level of 21825.0 (EMA144 on the 4-hour chart), the DJIA will move towards the recent absolute maximum near the level of 22177.0.
    If the decline continues, then after the breakdown of the support level of 21500.0, the target may be the support level of 20630.0 (Fibonacci level of 23.6% correction to the wave growth from the level of 15660.0 after recovery in February of this year to the collapse of the markets since the beginning of the year.The maximum of this wave and the level Fibonacci 0% is near the mark of 22000.0). Through the level 20630.0 also passes EMA200 on the daily chart. This level, therefore, is key to the bullish trend of DJIA.
    Support levels: 21710.0, 21650.0, 21500.0, 21300.0, 21000.0, 20630.0
    Resistance levels: 21770.0, 21840.0, 21950.0, 22060.0, 22177.0, 22300.0

    Trading Scenarios

    Buy Stop 21785.0. Stop-Loss 21600.0. Take-Profit 21825.0, 21950.0, 22060.0, 22177.0, 22300.0
    Sell Stop 21600.0. Stop-Loss 21785.0. Take-Profit 21500.0, 21300.0, 21000.0, 20630.0


    *) For up-to-date and detailed analytics and news on the forex market visit Tifia Forex Broker website tifia.com

  10. #110
    Senior Member TifiaFX's Avatar
    Join Date
    Mar 2017
    Posts
    697
    USD/CAD: the US dollar is recovering
    22/08/2017
    Current dynamics

    During today's Asian session and at the beginning of the European session, the US dollar is restoring its positions in the foreign exchange market. In recent days, both domestic political uncertainty in the US, as well as ambiguous US economic indicators, have reduced the hopes of investors who are betting on the growth of the dollar that the Federal Reserve will implement the third rate hike this year. According to interest rate futures, on Monday, market participants assessed the likelihood of further increases in US Fed rates this year at 40% versus 43% last month.
    From 24 to 26 August in Jackson Hole (USA) will host an annual economic conference, organized by the Fed, which will address the heads of the world's largest central banks. In the center of attention – is the speech of the head of the US Federal Reserve, Janet Yellen. She is expected to point out how the management of the central bank assesses the situation in the country's economy, and what are the prospects for further tightening of monetary policy in the US. If she makes any hints about the possibility of another interest rate hike by the end of the year, despite the low inflation in the US, the dollar will significantly strengthen in the foreign exchange market.
    Meanwhile, the Canadian dollar on Monday rose slightly against the US dollar, which was down against the major currencies. The strengthening of the Canadian currency was also due to the reduction in the difference in the yields of government bonds of Canada and the United States.
    Today, the US dollar is growing, restoring positions, which is also reflected in the growth of USD / CAD. Today its dynamics can be affected by the publication (at 12:30 GMT) of data on retail sales in Canada for June.
    The index is published monthly by Statistics Canada and estimates the total amount of retail sales. This index is often considered an indicator of consumer confidence and reflects the state of the retail sector in the short term. The growth of the index is usually a positive factor for CAD, the decline in the index will negatively affect CAD.
    A slight, almost zero, growth is expected (+ 0.3% vs. + 0.6% in May). If the data is even weaker, the Canadian dollar will fall in the foreign exchange market, including the USD / CAD pair.
    *)An advanced fundamental analysis is available on the Tifia Forex Broker website at tifia.com/analytics

    Support and resistance levels
    Late last month, the pair USD / CAD reached its next annual low near support level 1.2420 and returned to the range located between 1.2490 (EMA200) and 1.2740 (EMA144 on the weekly chart, Fibonacci level of 38.2% of the downward correction to the pair's growth in the global ascending Trend since September 2012 and the level of 0.9700). Near the level of 1.2740 also passes the top line of the descending channel on the daily chart and EMA200 on the 4-hour chart.
    In case of consolidation above the level of 1.2635 (EMA200 on the 1-hour chart), the USD / CAD growth will resume with the target of 1.2740. A more distant goal is the level of 1.3120 (EMA50 on the weekly chart, EMA200 on the daily chart and the December lows).
    The OsMA and Stochastic indicators on the 4-hour and weekly charts turned to long positions.
    If the pair continues to decline, the USD / CAD will go to support level 1.2490 (EMA200 on the weekly chart).
    The breakdown of support levels 1.2170 (50% Fibonacci level), 1.2030 (EMA200 on the monthly chart) will finally break the long-term bullish trend of the pair USD / CAD, which began in September 2012.
    Support levels: 1.2565, 1.2490, 1.2420, 1.2170, 1.2030
    Resistance levels: 1.2605, 1.2635, 1.2700, 1.2740, 1.2785, 1.2800, 1.2860, 1.2920, 1.3015, 1.3120, 1.3200

    Trading Scenarios

    Buy Stop 1.2610. Stop-Loss 1.2565. Take-Profit 1.2635, 1.2700, 1.2740, 1.2785, 1.2800, 1.2860, 1.2920 Sell Stop 1.2565. Stop-Loss 1.2610. Take-Profit 1.2500, 1.2400, 1.2170


    *) For up-to-date and detailed analytics and news on the forex market visit Tifia Forex Broker website tifia.com

Page 11 of 70 FirstFirst ... 9 10 11 12 13 21 61 ... LastLast

Tags for this Thread

Bookmarks

Posting Permissions

  • You may not post new threads
  • You may not post replies
  • You may not post attachments
  • You may not edit your posts
  •