Page 22 of 165 FirstFirst ... 12 20 21 22 23 24 32 72 122 ... LastLast
Results 211 to 220 of 1649

Wave Analysis by InstaForex

This is a discussion on Wave Analysis by InstaForex within the Analytics and News forums, part of the Trading Forum category; Technical analysis of Bitcoin for June 04, 2018 If we look at the 4-hour chart, we see that Bitcoin has ...


  1. #211
    Member
    Join Date
    Sep 2015
    Posts
    94
    Technical analysis of Bitcoin for June 04, 2018


    If we look at the 4-hour chart, we see that Bitcoin has hit the dynamic support Exponential 100-period Moving Average by Close (near a downward sloping channel). It seems that BTC is going down to test the lower channel and this has been already confirmed too by divergence between the Stochastic Oscillator and the price. A long as this Cryptocurrency does not break out and closes above the 7,754.45 level, the bias of the Bitcoin price is still bearish.

    (Disclaimer)

    *The market analysis posted here is meant to increase your awareness, but not to give instructions to make a trade.

  2. #212
    Senior Member InstaForex Gertrude's Avatar
    Join Date
    Sep 2015
    Posts
    1,885
    The trade war holds the

    The Australian dollar was marked by an impressive spurt due to an increase in global appetite for risk after the release of data on the US labor market, the release of strong statistics on retail sales and optimistic forecasts of the OECD. The authoritative organization believes that the Reserve Bank of Australia will begin to raise the main interest rate at the end of 2018 against the background of acceleration of average wages and inflation. GDP will grow by 2.9% this year and by 3% next year, unemployment will decrease to 5.4% in 2018 and to 5.3% in 2019. OECD believes that the main reasons for strong economic growth in Australia will be favorable the conjuncture of the commodity market and strong external demand.

    The optimism of the Organization of Economic Cooperation and Development is not shared by the futures market, which, on the contrary, has shifted the expectations of the first increase in the cash rate since 2016 from the current 1.5% to the second half of 2019. Along with unfavorable internal factors in the form of sluggish labor and inflation, leaving much to be desired (unlike the main developed countries, unemployment in Australia is far from full employment (5%), investors are apprehensive about the trade wars, the rise in the cost of borrowing in the United States and the Italian political crisis. The shift in the timing of the start of the normalization of the monetary policy of RBA, along with the worsening global appetite for risk, put pressure on the Australian dollar.

    Dynamics of MSCI EM and the probability of increasing the cash rate


    One of the main problems of the "Aussie" is connected with the growth of the yield of US treasury bonds against the background of expectations of raising the Federal Reserve rate on federal funds to 2.5% within 12 months. This circumstance, coupled with the unwillingness of the RBA to change anything in the field of monetary policy, allows Morgan Stanley to recommend its clients to sell the AUD/USD. The yield differential between the 10-year Australian and American bonds is -15 bp, with an average value of the indicator for the last five years at +68 bpts. Such a situation on the debt market deprives the "Aussie" of support from carry traders who prefer to invest in assets of developing countries.

    Additional pressure on the "Aussie" poses the risks of a trade war. The US is going to pause it, then revive the idea of import duties on steel and aluminum due to the intractability of its trading partners from Canada, Mexico and the EU, they openly shout about military actions. Donald Trump on his Twitter account said if you one $800 billion annually, there is no point in fearing a trade war. Under US pressure, China could reduce purchases of goods and services from Australia, which will negatively affect its economy. However, short-term strong statistics on retail sales, GDP and moderate optimism of the RBA may contribute to the correction of AUD/USD.

    Technically, the return of the pair's quotations to the boundaries of the long-term upward trading channel will increase the risks of implementing the Bat pattern with a target of 88.6%.

    AUD/USD, daily chart


    *The market analysis posted here is meant to increase your awareness, but not to give instructions to make a trade.

    Analysis are provided byInstaForex.
    Best regards, PR Manager
    Learn more about InstaForex Company at http://instaforex.com

  3. #213
    Senior Member InstaForex Gertrude's Avatar
    Join Date
    Sep 2015
    Posts
    1,885
    The growth of the UK economy resumed

    Weak data on the euro area in the first half of the day hurt the European currency, which again failed to gain the right move to get beyond the large resistance levels paired with the US dollar, which were formed yesterday.

    The report on the budget deficit of France partially supported the euro only.

    According to the data, the budget deficit of France for the first four months of this year decreased compared to the same period in 2017.

    Thus, the budget deficit amounted to 54.3 billion euros at the end of April this year against 57.9 billion euros at the end of April 2017.

    As noted in the report of the Ministry of Finance, the deficit was reduced as a result of a sharp decrease in costs, as well as the recapitalization of energy companies. It should be noted that tax revenues have also decreased. As I noted above, retail sales in the euro area were the main reason for the decline in the European currency in the first half of the day.

    According to the data, in April of this year, retail sales in the euro area grew by only 0.1% compared to March, where data were revised up to a growth of 0.4%. Compared to the same period in 2017, retail sales grew by 1.7% against growth by 1.5% in 2017. A weak sales report is likely to affect the eurozone's GDP in the second quarter of this year, which will have a negative impact on the European currency in the medium term.

    Today, for the first time, a new Italian Prime Minister, Giuseppe Conte, delivered a speech before the senate, who said that the main economic indicators will be achieved not through a strict economy, but through economic growth, which will also reduce public debt.

    Conte also said that Italy will introduce a minimum hourly wage and universal basic income. He also noted that the taxation system will be simplified and become fairer.

    As for the technical picture, it did not change much in comparison with the morning forecast. The pressure on the euro is maintained, which gradually returns the trading instrument to important levels of support in the area of 1.1620.

    The British pound grew strongly against the US dollar after a report that showed that activity in the UK services sector grew in May this year, giving a good boost to economic growth after weakening at the beginning of the year.


    According to the research company IHS Markit, the index of supply managers for the service sector in May rose to 54.0 points from 52.8 points in April. Let me remind you that the index values above 50 indicate an increase in activity.

    *The market analysis posted here is meant to increase your awareness, but not to give instructions to make a trade.

    Analysis are provided byInstaForex.
    Best regards, PR Manager
    Learn more about InstaForex Company at http://instaforex.com

  4. #214
    Senior Member InstaForex Gertrude's Avatar
    Join Date
    Sep 2015
    Posts
    1,885
    Gold monitors the Fed

    Having closed in the red zone for two months in a row, gold begins to rise from the ashes amid increasing rumors that the 6-week US dollar rally has come to an end. The escalation of trade tensions with China, Mexico, and Canada on the part of Washington testifies to the interest of the US administration in the weakness of its own currency. It was such speculation in the market during the height of the trade wars in the 1990s and 2000s that lowered the USD index by 20% and 12%. According to TD Securities, already in the fourth quarter of the precious metal will exceed the mark of $ 1400 per ounce, which was last seen in 2013. The company forecasts an average price of $ 1375 in October-December.

    Dynamics of gold and dollar


    The gradual decline in political risks in Italy after the announcement of the new Prime Minister Giuseppe Conte that the issue of the republic's exit from the eurozone is not on the agenda, as well as rumors about China's readiness to increase US imports of agricultural and energy goods by $ 70 billion in response to the abolition of tariffs The US reduced the demand for safe haven assets. Does not find gold support and in the physical asset market. According to authoritative sources Bloomberg, who wished to remain anonymous, purchases of precious metals by India in May fell to 77.6 tons (-39% m / m). According to the results of the third month of the spring of 2017, imports amounted to 126.2 tons. In January-May of this year, the figure fell to 289.3 tons (-42% y / y). One of the reasons is the weakness of the rupee, which has depreciated by 5% against the US dollar since early 2018. Dynamics of gold in rupees and dollars


    However, if during the rest of the year the world economy synchronizes its growth, including thanks to the restoration of GDP in the eurozone, then the forces of dollar "bulls" will begin to melt before our eyes, which will support both rupee and Indian imports. An indicative example is the second half of 2017, when talks about the normalization of monetary policy by central banks-competitors of the Federal Reserve made from the American currency an outsider G10.

    It is possible that the gold could rush up after the euro got rid of political chains already now, however, the offensive movement of the bulls on XAU / USD is holding back the FOMC meeting scheduled for June 13. The futures market gives a 94% probability of raising the federal funds rate to 2%, and precious metals traditionally fall before the historic meetings of the Fed, so that after them, take off thanks to the implementation of the "sell on the rumor, buy on facts" principle. Judging by the actual for 2016-2017 templates, it makes sense to form long positions on gold immediately after the announcement of the verdict of the Federal Reserve.

    Technically, the "bulls" leave no attempts to withdraw quotes from the descending channel, take the resistance by $ 1302 per ounce and activate the "Crab" pattern. If they succeed, the chances of achieving a target of 161.8% will increase. It corresponds to $ 1,350. On the contrary, a successful support test at $ 1,288 will open the way for the "bears" to the south as part of the "Expanding Wedge" pattern. Gold, daily chart

    *The market analysis posted here is meant to increase your awareness, but not to give instructions to make a trade.

    Analysis are provided byInstaForex.
    Best regards, PR Manager
    Learn more about InstaForex Company at http://instaforex.com

  5. #215
    Senior Member InstaForex Gertrude's Avatar
    Join Date
    Sep 2015
    Posts
    1,885
    The dollar continues to weaken before the meeting of the Federal Reserve

    The dollar declines at the trading session in Europe against almost all major currencies. The main reason for this, in our opinion, is the reduction in expectations that the Fed will decide this year to raise interest rates four times.

    The exchange rate of the American currency is gradually decreasing in the wake of a similar drop in the hopes of market players that the currency wars launched by Donald Trump will exert pressure on economic growth both within the States and the entire world economy. In addition, the slowdown in the first quarter of the country's GDP growth and the stagnation of inflationary pressures began to shake the hopes of investors that the regulator will go on increasing interest rates four times this year.

    At the same time, the chances of the euro significantly increased. According to the latest data, CPI rose 1.9% year-on-year, reaching close to the 2.0% target set by the ECB. This news, as well as the possible preservation of the growth rate of the region's economy, which the GDP data will have to signal today, may allow the Euro-currency to continue a more confident recovery. It is projected that in annual terms the eurozone's GDP will remain at the same level, 2.5%, and its quarterly value will keep the growth rate 0.4%. If the data does not disappoint, it will be possible to expect a noticeable growth of the single currency, and this is most likely to be observed in the eurodollar pair, as now the changes in the prospects for the ECB monetary policy are marked.

    An additional stimulus to the growth of the euro could be the G-7 summit, where current conflicts can be resolved and new agreements reached, which can reduce the degree of tension and the probability of expanding trade wars. Although such a probability exists, it is unlikely that Donald Trump will seriously retract. Therefore, this growth in hopes may turn out to be short-lived.

    Forecast of the day:

    EURUSD is trading at the level of 1.1830. Positive data from the euro area's GDP may push the pair up to 1.1900, but for this it needs to overcome the 1.1830 mark and gain a foothold above it.

    The GBPUSD pair has overcome the level of 1.3450 on the wave of "weakness" of the US dollar. It is likely that before the Fed meeting to be held next week, the pair will receive support and grow to 1.3550.


    *The market analysis posted here is meant to increase your awareness, but not to give instructions to make a trade.

    Analysis are provided byInstaForex.
    Best regards, PR Manager
    Learn more about InstaForex Company at http://instaforex.com

  6. #216
    Senior Member InstaForex Gertrude's Avatar
    Join Date
    Sep 2015
    Posts
    1,885
    Trump and the Big Seven: Did not reach an agreement

    Trump and the Big Seven: They did not reach an agreement.

    On Friday and Saturday, June 8-9, Canada hosted the G-7 summit. Despite the large number of issues on the agenda, the issue is really only one, it's the main one: the new fees that Trump introduces against the US trade partners - against China and Mexico - and against the US allies - Canada and European countries.

    The outcome of the first day of the summit is short: they did not agree. There are no joyful media reports about a "breakthrough" in the main issue. All the efforts of the participating countries turned out to somehow sign the final text - it must be signed before the middle of the Saturday, June 9, as Trump announced in advance that he would fly early to Hong Kong for a meeting with the head of North Korea.

    All media write that everything could have ended even worse-the refusal of countries to sign the final text - and this is actually a complete collapse of the group of seven.

    Let's note an interesting turn of the plot around Russia. Trump, even before the summit, to all the other leaders of the Seven, unexpectedly said that it was necessary to return Russia to the Seven (that is, to the G8, respectively). Trump's proposals were quickly rejected by the leaders of Germany and Britain, but Italy supported it. Very quickly, literally within one or two hours, Putin's spokesman Peskov said that the Kremlin (read - Putin) is not interested in returning to the G8 - "we are more interested in developing other formats." (On this day, Putin met with the leader of China, Xi Jinping).

    At the very meeting of the Group of Seven, Trump did not raise the topic of Russia's accession to the Group of Eight. At the same time, it was stated that "all European countries in the Group of Seven are against the return of Russia - until the conflict is settled in Ukraine" (that is, Italy was promptly "persuaded"). Still, we note that Germany and Sweden and Finland agreed to the construction of the Nord Stream 2 gas pipeline - which was opposed by Trump ... (this is not about the Group of Seven, but important for the overall picture).

    The result is this: the General Statement of the Group of Seven will most likely be signed - but there is no main text in the text - a decision on the trade dispute over the new Trump duties. At the same time, the EU is preparing an introduction in July of reciprocal duties on goods from the United States. The last attempt to agree - Merkel's proposal to convene a "forum" specifically on the issue of trade conflicts.

    How will this affect the markets? I do not think that we will have a noticeable gap at the opening on Monday. But I do not see any reason for rapid growth.

    EURUSD - closing day and week.


    *The market analysis posted here is meant to increase your awareness, but not to give instructions to make a trade.

    Analysis are provided byInstaForex.
    Best regards, PR Manager
    Learn more about InstaForex Company at http://instaforex.com

  7. #217
    Member
    Join Date
    Sep 2015
    Posts
    94
    AUD/USD Approaching Support, Prepare For A Bounce!

    AUD/USD is approaching its support at 0.7560 (61.8% Fibonacci extension, 61.8% Fibonacci retracement, horizontal swing low support) where we expect to see a bounce, causing the price to rise to its resistance at 0.7659 (61.8% & 50% Fibonacci retracement, horizontal overlap resistance).

    Stochastic (89, 5, 3) is approaching its support at 9.6% where a corresponding bounce is expected.

    Buy above 0.7560. Stop loss 0.7513. Take profit at 0.7659.


    *The market analysis posted here is meant to increase your awareness, but not to give instructions to make a trade.

  8. #218
    Senior Member InstaForex Gertrude's Avatar
    Join Date
    Sep 2015
    Posts
    1,885
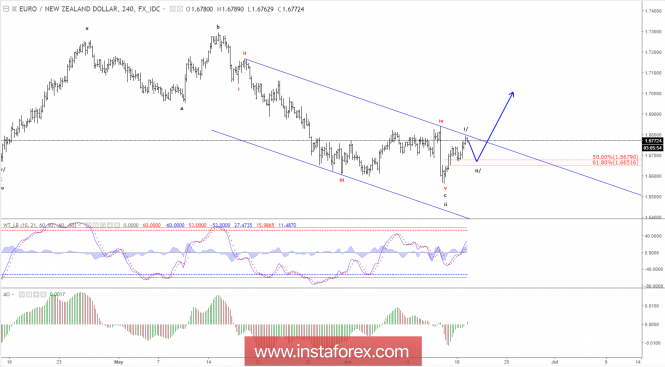
    Elliott wave analysis of EUR/NZD for June 19, 2018


    Our short-term expectations for EUR/NZD was spot on. First, we saw a minor corrective set-back to 1.6671 (we were looking for 1.6676) before moving higher to 1.6795 (we were looking for a rally into the 1.6768 - 1.6793 area to complete the first impulsive rally of the 1.6567 low. With this five wave rally complete with the test of 1.6795 we will be looking for a correction in wave ii/ into the 1.6652 - 1.6679 area before moving higher in wave iii/ towards at least 1.7047.

    R3: 1.6842
    R2: 1.6817
    R1: 1.6794
    Pivot: 1.6758
    S1: 1.6728
    S2: 1.6695
    S3: 1.6671

    Trading recommendation:
    We will sell EUR here at 1.6772 and place our stop at 1.6845. We will take profit and buy EUR at 1.6680

    *The market analysis posted here is meant to increase your awareness, but not to give instructions to make a trade.

    Analysis are provided byInstaForex.
    Best regards, PR Manager
    Learn more about InstaForex Company at http://instaforex.com

  9. #219
    Senior Member InstaForex Gertrude's Avatar
    Join Date
    Sep 2015
    Posts
    1,885
    Elliott wave analysis of EUR/NZD for June 20, 2018


    Wave i/ extended higher to a peak at 1.6831 before letting wave ii take over for a correction lower to at least the low of wave four of one lesser degree at 1.6671. This is very close to the 61.8% corrective target of wave i/ seen at 1.6667. Once this correction is complete near the 1.6667 - 1.6671 area, we will be looking for wave iii/ higher to at least 1.7086.

    Short-term, we expect minor resistance at 1.6766 to be able to cap the upside for the decline into the 1.6667 - 1.6671 area to complete wave ii/.

    R3: 1.6830
    R2: 1.68.12
    R1: 1.6788
    Pivot: 1.6766
    S1: 1.6729
    S2: 1.6700
    S3: 1.6680

    Trading recommendation: We are short EUR from 1.6772 and we will move our stop +revers lower to 1.6815. We will take profit and buy EUR at 1.6680.

    *The market analysis posted here is meant to increase your awareness, but not to give instructions to make a trade.

    Analysis are provided byInstaForex.
    Best regards, PR Manager
    Learn more about InstaForex Company at http://instaforex.com

  10. #220
    Senior Member InstaForex Gertrude's Avatar
    Join Date
    Sep 2015
    Posts
    1,885
    Technical analysis of Gold June 21, 2018


    If We look at the Daily Charts from Gold, We can see clearly they moving in Weekly Up Slope Channel, and now they have a retracement to the down side as long as they not breakout and close above the 1304.93 Gold will going down 1236.09 as their Support level.

    *The market analysis posted here is meant to increase your awareness, but not to give instructions to make a trade.

    Analysis are provided byInstaForex.
    Best regards, PR Manager
    Learn more about InstaForex Company at http://instaforex.com

Page 22 of 165 FirstFirst ... 12 20 21 22 23 24 32 72 122 ... LastLast

Tags for this Thread

Bookmarks

Posting Permissions

  • You may not post new threads
  • You may not post replies
  • You may not post attachments
  • You may not edit your posts
  •