Page 131 of 164 FirstFirst ... 31 81 121 129 130 131 132 133 141 ... LastLast
Results 1,301 to 1,310 of 1634

Wave Analysis by InstaForex

This is a discussion on Wave Analysis by InstaForex within the Analytics and News forums, part of the Trading Forum category; Forex Analysis & Reviews: Forecast for GBP/USD on November 4, 2022 The Bank of England raised the rate to the ...


  1. #1301
    Senior Member InstaForex Gertrude's Avatar
    Join Date
    Sep 2015
    Posts
    1,885
    Forex Analysis & Reviews: Forecast for GBP/USD on November 4, 2022

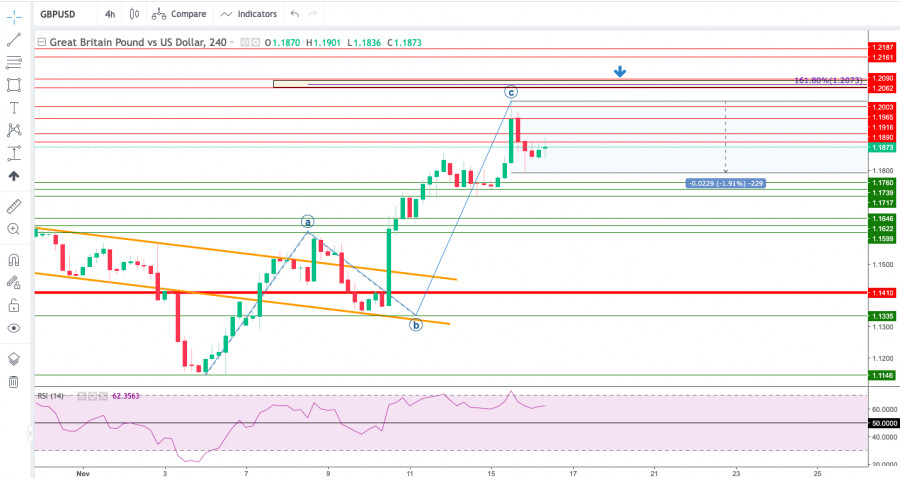
    The Bank of England raised the rate to the expected 0.75% and warned of two points: in the future, the pace of the rate hike will slow down, from the 3rd quarter the UK economy will enter a recession and it will last until mid-2024 with an increase in unemployment until the end of the 25th year to 6.4%. The pound fell by 230 points. Data on British GDP for the 3rd quarter will be released on November 11, the forecast of economists is -0.2%, obviously, the forecast coincides with the calculations of the central bank.

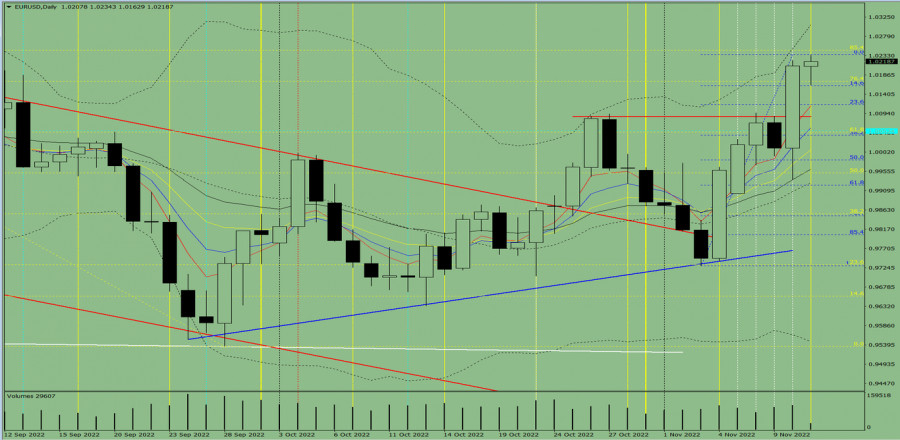
    The decline continued to the target level of 1.1170 on the daily chart. The signal line of the Marlin Oscillator went below the zero line into the area of the downtrend. After the price settles under 1.1170, we are waiting for the pound to fall further to 1.0785 - to the line of the price channel of the higher timeframe.

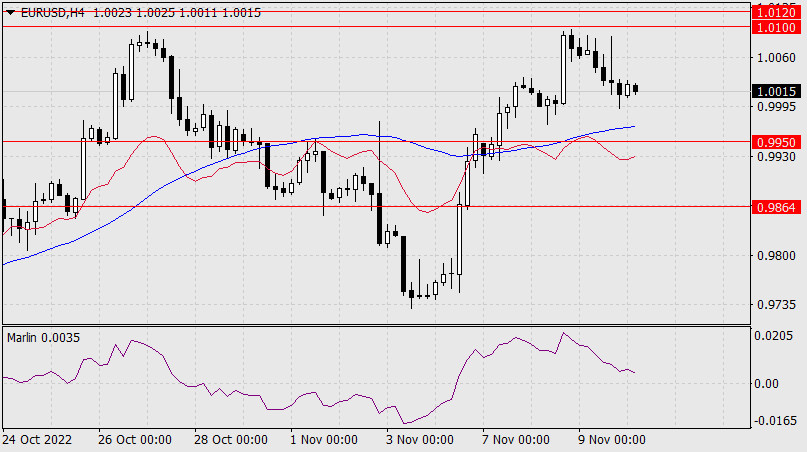
    On the four-hour chart, the price, together with the Marlin Oscillator, is turning into a slight correction. Perhaps the correction will last until the first noticeable resistance at 1.1260 - the former local support for October. After the end of the correction, we are waiting for a further fall towards the specified target.

    *The market analysis posted here is meant to increase your awareness, but not to give instructions to make a trade.

    Analysis are provided by InstaForex

    Read More https://ifxpr.com/3Nyw63c
    Best regards, PR Manager
    Learn more about InstaForex Company at http://instaforex.com

  2. #1302
    Senior Member InstaForex Gertrude's Avatar
    Join Date
    Sep 2015
    Posts
    1,885
    Forex Analysis & Reviews: USD/JPY analysis for November 07, 2022 - Triangle pattern in creation


    USD/JPY has been trading sideways at the price of 147.45. I see potential for the breakout play. Trading recommendation:

    Due to the range condition, watch for potential breakout of the trading range to confirm further direction. In case of the upside breakout of the resistance at 148.80, watch for buying opportunities with the upside objective at 151.85.

    In case of the downside breakout of the support at 145.65, watch for selling opportunities with the downside objective at 141.85 *The market analysis posted here is meant to increase your awareness, but not to give instructions to make a trade.

    Analysis are provided by InstaForex.

    Read More
    Best regards, PR Manager
    Learn more about InstaForex Company at http://instaforex.com

  3. #1303
    Senior Member InstaForex Gertrude's Avatar
    Join Date
    Sep 2015
    Posts
    1,885
    Forex Analysis & Reviews: Forecast for AUD/USD on November 8, 2022

    The Australian dollar managed to overcome the resistance of the MACD indicator line on the daily chart. Today it opened above this line. Now the price will try to master the target range of 0.6514/32. If it is overcome, then the next target will be the level of 0.6592.


    The daily Marlin Oscillator is in the neutral position, and it reached a reversal level on October 27 and August 12 (0.0185 on the indicator scale), which increases the psychological tension in connection with the upcoming US Congressional elections today.


    On the four-hour chart, the price is above the indicator lines, Marlin is in the positive area and shows the intention to develop a sideways movement. In general, the expectation is positive, that is, the market is preparing to meet the victory of the Republicans. But we are not in a hurry with such expectations, so we just follow the course of events.

    *The market analysis posted here is meant to increase your awareness, but not to give instructions to make a trade.

    Analysis are provided by InstaForex.

    Read More
    Best regards, PR Manager
    Learn more about InstaForex Company at http://instaforex.com

  4. #1304
    Senior Member InstaForex Gertrude's Avatar
    Join Date
    Sep 2015
    Posts
    1,885
    Forex Analysis & Reviews: Elliott wave analysis of Litecoin for November 9, 2022

    We have seen a deeper-than-expected correction here, as we have seen a correction to the 78.6% corrective target near 53.72, but then it's just in the middle of the fourth wave of one lesser degree, which is normally what we would expect to see. Therefore, we expect Litecoin to start the next journey higher towards the S/H/S bottom target at 97.38.

    Only an unexpected break below the key support at 48.41 will invalidate our bullish scenario for the expected rally higher to 97.38 and above.

    *The market analysis posted here is meant to increase your awareness, but not to give instructions to make a trade.

    Analysis are provided by InstaForex.

    Read More
    Best regards, PR Manager
    Learn more about InstaForex Company at http://instaforex.com

  5. #1305
    Senior Member InstaForex Gertrude's Avatar
    Join Date
    Sep 2015
    Posts
    1,885
    Forex Analysis & Reviews: Forecast for EUR/USD on November 10, 2022

    The elections to the American Congress turned out to be far from being as tragic for the Democrats as the US and other world media predicted. Seats in the Senate were distributed equally 48/48. There will be re-elections in several states in December to determine the winners. The seats in the lower house this morning were distributed as follows: 182 for the Democrats, 205 for the Republicans. As a result, conflicts are already brewing in the Republican camp, a number of functionaries are demanding that Trump be removed from influence on the party, and several Republican governors have already spoken out on their nominations for the presidency (DeSantis, Hogan).


    Well, the markets continued their fall: S&P 500 -2.08%, euro -0.58%, oil (CL) -3.42%. A divergence has formed with the Marlin Oscillator on the daily chart. The price returned under the level of 1.0051, where it is most likely to close the day. Thus, the nearest target for the euro is the level of 0.9950. Further, we are waiting for the advance to 0.9864. The price is still in an upward position on the four-hour chart, as the development takes place above the indicator lines and Marlin is in the growth zone. A bit above the support of 0.9950 is the MACD line, which will make it difficult and slow down the price to work out this support.


    Analysis are provided by InstaForex.

    Read More
    Best regards, PR Manager
    Learn more about InstaForex Company at http://instaforex.com

  6. #1306
    Senior Member InstaForex Gertrude's Avatar
    Join Date
    Sep 2015
    Posts
    1,885
    Forex Analysis & Reviews: Indicator analysis: Daily review of EUR/USD on November 11, 2022

    Trend analysis (Fig. 1).
    The euro-dollar pair may move upward from the level of 1.0208 (close of yesterday's daily candle) to 1.0246, the 85.4% retracement level (yellow dotted line). When testing this level, a downward pullback is possible.


    Fig. 1 (daily chart).
    Comprehensive analysis:
    Indicator analysis - up;
    Fibonacci levels - up;
    volumes - up;
    candlestick analysis - up;
    trend analysis - up;
    Bollinger bands - up;
    weekly chart - up.

    General conclusion: Today, the price may move upward from the level of 1.0208 (close of yesterday's daily candle) to 1.0246, the 85.4% retracement level (yellow dotted line). When testing this level, a downward pullback is possible.

    Alternatively, the price may move upward from the level of 1.0208 (close of yesterday's daily candle) to the upper limit of the Bollinger band indicator at 1.0308 (black dotted line). Upon reaching this level, a downward movement is possible with the target of 1.0162, the 14.6% retracement level (blue dotted line).

    *The market analysis posted here is meant to increase your awareness, but not to give instructions to make a trade.

    Analysis are provided by InstaForex.

    Read More
    Best regards, PR Manager
    Learn more about InstaForex Company at http://instaforex.com

  7. #1307
    Senior Member InstaForex Gertrude's Avatar
    Join Date
    Sep 2015
    Posts
    1,885
    Forex Analysis & Reviews: Elliott wave analysis of Gold for November 14, 2022


    Gold has finally broken nicely above resistance at 1,735 confirming that wave C of 4 has been completed and wave 5 towards at least 2,400 is in progress. We will be looking for a rally towards resistance in the 1,799 - 1,809 area from where we could see a temporary correction back to retest the former resistance which now acts as support at 1,735 before the next strong rally higher to 1,912 and 2,070 as the next major hurdles on the way higher to 2,400 and possibly 2,700.

    *The market analysis posted here is meant to increase your awareness, but not to give instructions to make a trade.

    Analysis are provided by InstaForex.

    Read More
    Best regards, PR Manager
    Learn more about InstaForex Company at http://instaforex.com

  8. #1308
    Senior Member InstaForex Gertrude's Avatar
    Join Date
    Sep 2015
    Posts
    1,885
    Forex Analysis & Reviews: AUDUSD Potential for Bearish Drop | 15th November 2022


    With the price moving above the ichimoku cloud on the H4, we have a bullish bias that the price will rise to the first resistance at 0.67711, which is in line with the 161.8% fibonacci line. If the first resistance is broken, the second should be at 0.69161, the previous swing high. Alternatively, the price could fall to the first support level at 0.65398, which is marked by the 38.2% Fibonacci line.

    Trading Recommendation
    Entry: 0.67711
    Reason for Entry: 1st resistance line
    Take Profit: 0.65398
    Reason for Take Profit:
    1st support line
    Stop Loss: 0.69161
    Reason for Stop Loss:
    Previous swing high and 1st resistance line

    *The market analysis posted here is meant to increase your awareness, but not to give instructions to make a trade.

    Analysis are provided by InstaForex.

    Read More
    Best regards, PR Manager
    Learn more about InstaForex Company at http://instaforex.com

  9. #1309
    Senior Member InstaForex Gertrude's Avatar
    Join Date
    Sep 2015
    Posts
    1,885
    Forex Analysis & Reviews: Technical Analysis of GBP/USD for November 16, 2022


    Technical Market Outlook: The GBP/USD pair has been seen moving higher towards the next target for bulls which is located at 161% Fibonacci extension level at 1.2073. So far the local high was made at the level of 1.2026 and then a 2% pull-back followed. The intraday technical support is seen at 1.1760, 1.1734 and 1.1722. The strong and positive momentum on the H4 time frame chart supports the bullish outlook for GBP despite the extremely overbought market conditions, however please stay focused and viligant as the pull-back lower might come any time now as the market looks overstretched o n H4 time frame chart.

    Weekly Pivot Points:
    WR3 - 1.19243
    WR2 - 1.18500
    WR1 - 1.18089
    Weekly Pivot - 1.17757
    WS1 - 1.17346
    WS2 - 1.17014
    WS3 - 1.16271

    Trading Outlook:
    The Bearish Engulfing candlestick pattern that was made on the weekly time frame chart has been invalidated and the strong green weekly candle was made. The bulls are temporary in control of the market and the 38% Fibonacci retracement of the last wave down located at 1.1830 had been tested as well. On the other hand, the level of 1.0351 has not been tested since 1985, so the down trend is strong. In order to terminate the down trend, bulls need to break above the level of 1.2275 (swing high from August 10th). *The market analysis posted here is meant to incr

    *The market analysis posted here is meant to increase your awareness, but not to give instructions to make a trade.

    Analysis are provided by InstaForex.

    Read More
    Best regards, PR Manager
    Learn more about InstaForex Company at http://instaforex.com

  10. #1310
    Senior Member InstaForex Gertrude's Avatar
    Join Date
    Sep 2015
    Posts
    1,885
    Forex Analysis & Reviews: Technical Analysis of Nasdaq 100 Index Intraday Price Movement, Thursday November 17, 2022


    On 4 hour chart Nasdaq 100 Index seems visible if #NDX still moving within its Bullish Pitchfork channel even so because of its failure to touch the top line of the Bullish Pitchfork channel it can be considered as Hagopian Rules which confirms that in the near future #NDX will depreciated in the near future where it is also confirmed by the emergence of the Ascending Broadening Wedge pattern so that in the near future #NDX will try to test and broke below the level 11670,5 if this level is successfully broken then #NDX has the potential to fall to 11121.8 as the main target and 10789.1 as the next target to be tested with a note that on its way to the target level it does not return to its initial bias (Bull) until it exceeds above 12082. because if this level is successfully broken, it is very likely that the downside scenario described above will become invalid.

    *The market analysis posted here is meant to increase your awareness, but not to give instructions to make a trade.

    Analysis are provided by InstaForex.

    Read More
    Best regards, PR Manager
    Learn more about InstaForex Company at http://instaforex.com

Page 131 of 164 FirstFirst ... 31 81 121 129 130 131 132 133 141 ... LastLast

Tags for this Thread

Bookmarks

Posting Permissions

  • You may not post new threads
  • You may not post replies
  • You may not post attachments
  • You may not edit your posts
  •