Page 13 of 22 FirstFirst ... 3 11 12 13 14 15 ... LastLast
Results 121 to 130 of 219
Like Tree1Likes

Stocks, ETFs, Options, Commodities & Currencies

This is a discussion on Stocks, ETFs, Options, Commodities & Currencies within the Analytics and News forums, part of the Trading Forum category; If you have been paying close attention to the stock market, market internals/breadth, and bonds for the past three months, ...


  1. #121
    Senior Member Technician's Avatar
    Join Date
    Feb 2013
    Posts
    220

    Bonds-the fourth quarter trade of 2014

    If you have been paying close attention to the stock market, market internals/breadth, and bonds for the past three months, you’ve likely come to the same conclusion.

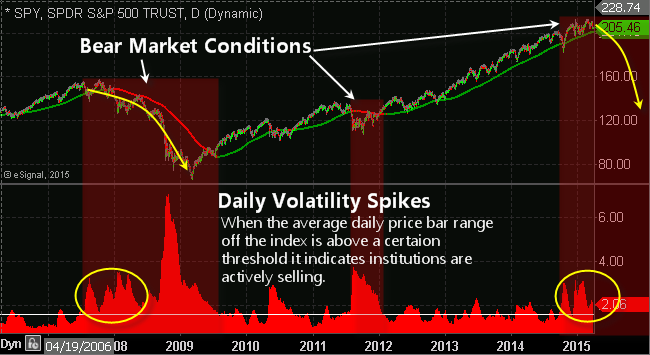
    The US stock market is showing signs of severe weakness with the market breadth and leading indicators pointing to a sharp correction for stock prices.

    With fewer stocks trading above their 50 and 200 day moving averages each week, while the broad market S&P 500 index continues to rising, this bearish divergence is a red flag for long term investors.

    When a handful of large-cap stocks are the only things propelling the stock market higher while the majority of small-cap stocks are falling you should keep new position sizes smaller than normal and start moving your protective stops up to lock in gains/reduce losses in case the market rolls over sooner than later.

    Small cap stocks are typically a leading indicator of the broad market. The Russell 2000 index is what investors should keep a close eye on because it’s the index of small-cap stocks. Since March of this year, the Russell 2000 been trading sideways and actually making new lows. This tells us that big-money speculative traders are rotating out of the stock market and into other investments like high dividend paying stocks, blue chips, and likely bonds.

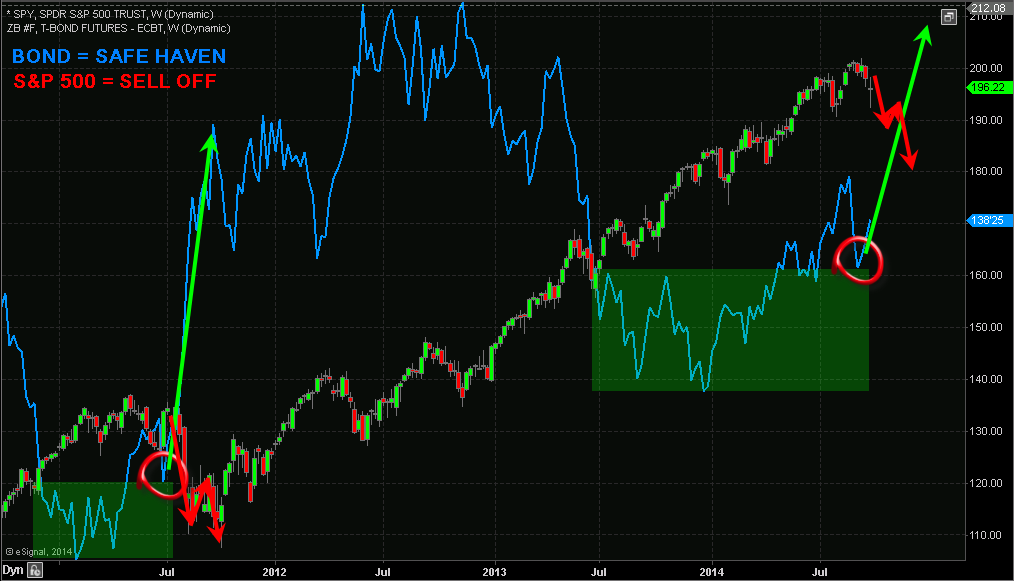
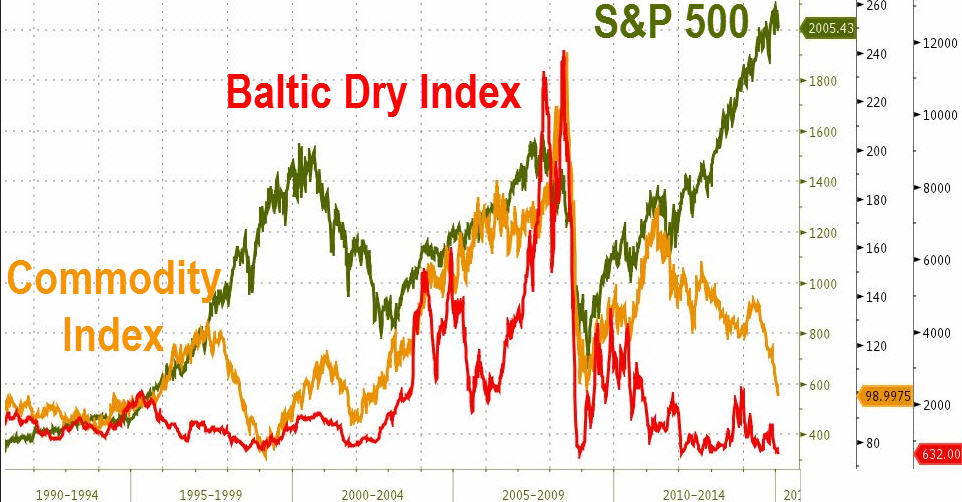
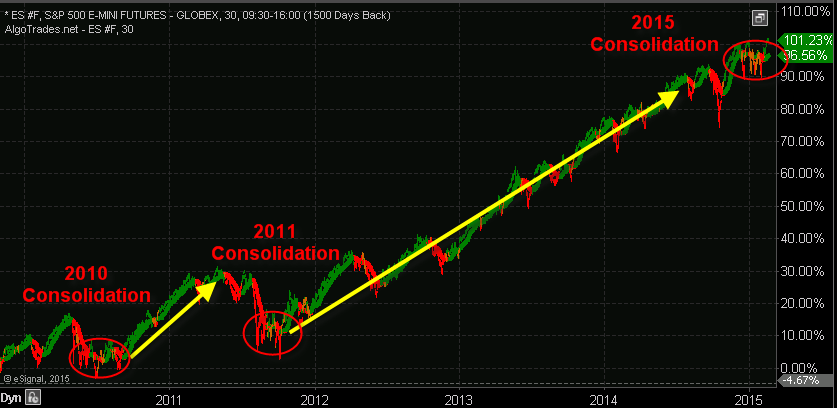
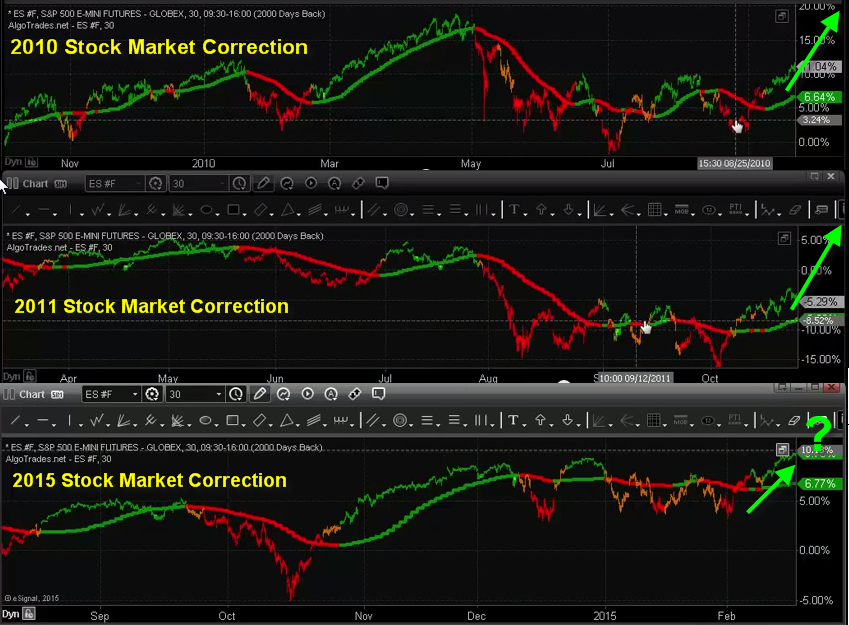
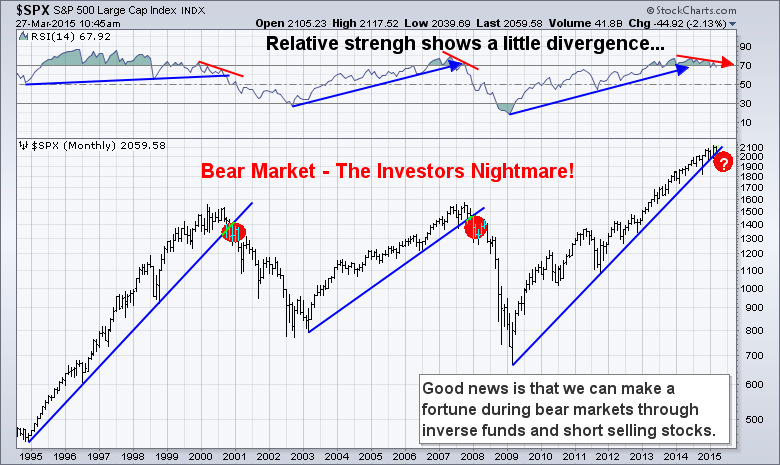
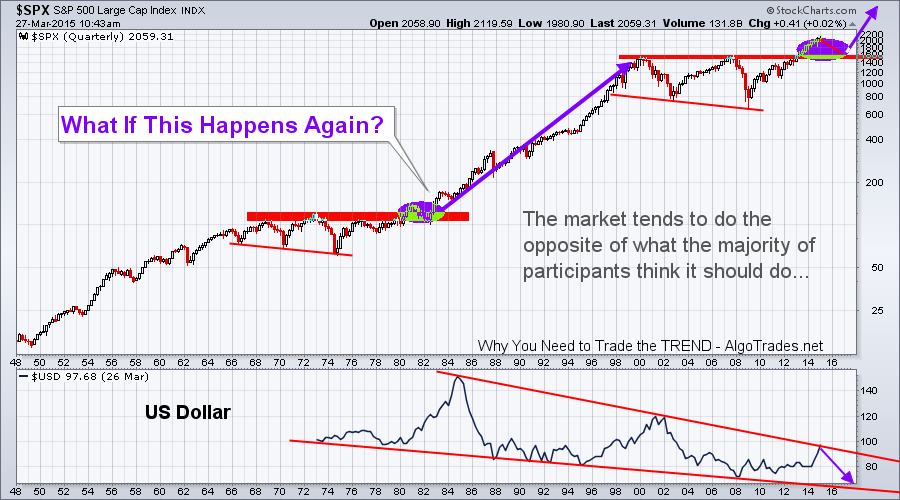
    Looking at the chart below - history has a way of repeating itself; although it may never feel the same and the economy may be different, price action of investments have the tendency to repeat. In 2011 we saw the stock market and bonds form specific patterns. These patterns clearly show that money was rotating out of the stock market and into bonds. During times of uncertainty in the stocks market money has the tendency to move into bonds, as they are known as a safe haven. Bonds tend to reverse before the stock market does, so if you have never tracked the price chart of bonds before, then you should start.


    From late 2013 until now bonds and the stock market have repeated the same price patterns from 2011. If history is going to repeat itself, which the technical and statistical analysis is also favoring, we should see the stock market correct 18% to 30% in the near future. If this happens bonds will rally to new highs.

    It’s important to realize the chart above is weekly. Each candle represents five trading days, and four candles represents one month. So while this chart points to an imminent selloff from a visual standpoint, keep in mind this could take 2 to 3 months to unfold or longer. The market always has a way of dragging things out. If the market can’t shake you out, it will wait you out.

    So if you are short the market or planning to short the market be very cautious as it could be choppy for the next several weeks and possibly months before price truly breaks down and we see price freefall.


    See more here.

  2. #122
    Senior Member Technician's Avatar
    Join Date
    Feb 2013
    Posts
    220

    Crude Oil Slides to Multi Year Lows and What to Expect

    Looking back to 2007 (seven years ago) we have seen the price of crude oil perform incredible price swings. No matter the time frame in which we observe price when an extreme price spike takes place due to news/event, statistics show that half if not all the event driven price spike will eventually be negated in the future.

    The perfect example of this is the rubber band affect. If you pull an elastic band in one direction, eventually when it breaks or it’s released, the band will retrace back to the norm and then go in the opposite direction. You can see this on the chart from 2008 high of nearly $150 to the 2009 low of $40. Price then lost is momentum and has been somewhat range bound from 2011 – 2014 right in the middle at $95 per barrel.

    Observing the price chart of oil below there are many technical indicators and patterns at play. The first important pattern to identify is the series of higher lows shown with the green trend line sloping upwards.

    A rising trend line that has multiple pivot lows (bounces up the trend line) the price of oil creates what I call a perfect storm for waterfall type selloff. This is exactly what we have seen over the past 3 months.

    Each time one of the pivot lows are breached, the stop loss orders are triggered for investors. This causes a flood of sell orders forcing price lower to fall below the next pivot low etc… This may look and sound easy to trade, but keep in mind this is a monthly chart, and short term traders are not trading this long term time frame. Only investors would be focusing on a move that would take months to a year to unfold.

    The second key indicator to look at is the 61.8% Fibonacci retracement level. This level typically acts as a support level for a small bounce usually. Because the 61.8% level is also in alignment with a previous consolidation, and a pivot low, both which have been highlighted on the chart, I suspect a bounce around the $65 level should take place.
    The final potential bottom could take place near the 2009 low. It is a long way away but anything is possible and what we think is most unlikely to happen is exactly what the market does sometimes.


    Crude Oil Conclusion:


    In short, I think what crude oil is doing is healthy and needed for several reasons. If I let my bias/option shine through, I feel the big oil and gas companies have been taking advantage of us with their ridiculously high gas prices over the last seven years.

    The multi-billion dollar, cash rich corporations need a little wakeup call.* And the hair cut in their share price should be great for investors. This allows them to build or re-enter new positions at a better price with a higher dividend yield.
    I will be watching the hourly and daily charts for a bottoming/bounce formation in the next week. But any bounce could be short lived as sellers appear to be aggressive still.

    See more here.

  3. #123
    Senior Member Technician's Avatar
    Join Date
    Feb 2013
    Posts
    220

    State of the Stock Markets

    We are seeing normal corrective declines in the broader indexes of late. December has been volatile from day one. Tax selling is obvious to me, and we are seeing extreme oversold set ups in Energy stocks. Insiders have been loading up the last few weeks yet those same stocks are still declining, and we think Hedge funds are taking on heavy losses, and selling is begetting selling.

    Also, the percentage of stocks above their 50 day moving averages hit the mid 60’s recently which is pretty high. Currently at 53% still and likely to fall further into year end? We also look at the NASI Summation index, and that is topping and rolling over… another topping signal. So the likelihood is we are in early stages of a wave 2 correction from 2070 SP 500 highs after a 250 point rally. Initial support is at the 1994-2000 area for starters, so let’s see if that area holds.
    The DOW we want to see 17000 support, and its not just a number I made up its a key support line. NASDAQ look for initial key support at 4617 and 4457 below that.

    Biotech stocks are very inflated here, though I like them and have profited. They seem like the end of season rotation to save some Portfolios and window dressing.

    Looking for Energy stocks to be the January rebound winner candidates.

    Need to see GOLD over 1241 on Closing basis before I start getting bullish.


    See more here.

  4. #124
    Senior Member Technician's Avatar
    Join Date
    Feb 2013
    Posts
    220

    What Now For The US Markets?

    The markets have been in a rough and tumble recent period here with a 3.5% decline last week along with a further drop to the 1982 lows so far on Monday. *What is likely ahead?

    -Dave Banister- Chief Strategist- www.themarkettrendforecast.com

    The SP 500 probably just completed the initial wave down of an ABC Correction from the 2079 highs. We are counting this correction as a “Wave 2″ of a full 5 wave sequence up from 1820 lows in October. Essentially, Oil is the reason being used by the media for the correction but that is just the convenient headline excuse of the day. Instead, what we will likely see is a Santa rally “B” wave ahead and then another leg down in January to complete this larger ABC move.

    Elliott Wave theory is very hard to use to accurately forecast movements ahead of time, but we try our best to project, analyze, and then adjust as needed. Our best estimate is the 38% fibonacci retracement of the 259 point rally completed at 1982 today. A “B Wave” rally up from here is normal and a C wave down to the 1920 area would complete a 61% retracement of that Wave 1 259 point rally.

    Stocks, ETFs, Options, Commodities & Currencies-1.jpg


    Following the completion of a standard ABC Correction we should have a Wave 3 Bullish wave in early 2015 that will challenge the highs of 2079 and likely overtake them. We do not like to get too far ahead of ourselves with the forecasts but we expect the excuse for that rally will be low energy prices and a strong consumer going into 2015. Some of the obvious rally names for January will be energy stocks, but will need to be carefully selected. Gold needs to get past 1241 on a closing basis before we get too bullish on those names, but we have them on watch as well.


    See more here.

  5. #125
    Senior Member Technician's Avatar
    Join Date
    Feb 2013
    Posts
    220

    New Year Updates in Gold and SP 500

    Our long term subscribers have been following the Gold and SP 500 markets with us for years, and for sure last year was full of volatility in both. Right now we are continuing to stay on the sidelines in Gold until we can see a confirmed close over $1232 per ounce (US Dollars). We like to keep it simple and avoid a lot of the noise that the charts on a daily basis can bring, as well as day to day and week to week volatility.

    The reality is that Gold has been in a Bear Cycle since the top in 2011 and over the past year or so has been attempting to establish a base pattern from which to bottom out and emerge back into a Bull cycle. However, the technical evidence does not yet support the Bull case and in fact suggests there is still potential for a final drop to the $1,050 per ounce area before a final washout low takes hold in 2015.

    With that said, we are not biased in either direction and prefer to let the price action dictate our views and not our personal biases. We think a close over $1232 would represent a bullish change in direction as it represents the 30 week moving average line on weekly charts. We like to use this big picture charting for both the SP 500 and Gold because frankly its simple and it works. Yes, we can drill down on Elliott Wave patterns with the best of them and we do so as appropriate, but for the purpose of the general investing audience lets avoid that boredom and short term labeling issues and just focus on the big picture. Over $1232 we start to get interested, under that we are out of the pool on the sidelines:


    Now let’ts take a quick look at the SP 500 index. We have been calling this Primary wave 5 of the Bull cycle from March 2009. Others may certainly disagree but our view is for a low end target of 2181 and a high end target of 2525 for the SP 500 before Primary wave 5 ends and we start another bear cycle. We are certainly willing to adjust our views based on action but those are our current intermediate to longer term forecast points for the SP 500. Shorter term, keep an eye on that “Gap Fill” area on the daily SP 500 charts around 2012-2015 as likely to fill as early 2015 trading gets underway. We caution our stock trading and market forecast subscribers that early January volatility is notorious and caution is warranted in the first few weeks until we see where the rotations are taking place , tax selling ends, and other changes are completed by portfolio managers. Then of course earnings start coming out, so January as a rule is tough for most investors and traders.


    David Banister

    See more here.

  6. #126
    Senior Member Technician's Avatar
    Join Date
    Feb 2013
    Posts
    220

    The S&P 500 Is Going Lower . . . Sooner Rather than Later

    On Wednesday, January 28, 2015 it was early afternoon during the trading day and I arose from my screens to go grab a drink out of my refrigerator. In the process of grabbing a drink, I went out to see what came in the mail and to get a few moments of fresh air before the final hours of a fairly quiet trading day were through.

    Upon reentering my office, I noted that my screens were flashing red and the S&P 500 was under assault from the sell side. I scanned several independent blogs I follow for a headline and came across nothing. It was at this moment that I did the unthinkable and I turned on CNBC. I am embarrassed to even admit it frankly, because the drivel CNBC and most of the financial media spew out might as well be sales material for the sell side and their “long-term investment view that is always bullish”.

    I saw the S&P 500 under pressure and then a subsequent bounce occurred. Nothing major, not even what I would call a major retracement, just some short sellers locking in a few profits I presumed. To my absolute horror, seconds later I recall seeing the headline at the bottom of the television screen on CNBC dictating that “stocks were off their lows”. It is no wonder CNBC’s ratings are absolutely terrible.

    While I am picking on CNBC, the mainstream financial media is just awful. In fact, I do everything in my power to ignore all sources from televised media such as CNBC and Fox Business to written media like the Wall Street Journal. In every case, every day stocks are going higher and they can never go down. Certainly with central bank omnipotence and sorcery, it will not be long before no one has to work and we will just own long only stock portfolios.

    Regardless, I am an options trader who has weathered the storm fairly well. I sell premium, focus on implied volatility, and I use probability to build my trades. My style is similar to Tom Sosnoff’s for those following him on TastyTrade or Dough, but I mix in a few twists. Regardless of my trading style, I have a strong historical track record that I am proud of which has handily beaten the markets for several years, although 2014 was one of my worst year in recent memory.

    The reason I mention this is simply to state that I am a trader first, and newsletter operator second. I am getting rich with my newsletter at $20 per month let me tell you. Honestly, I just send out trades. No fluff, no nonsense. I tell it like I see it and I admit when I am wrong. My trades typically have a 60% – 70% probability of success at the time of entry based on implied volatility calculations involving probabilities. At the end of the day, I trade options because I am a junkie . . . I absolutely love derivatives and trading them.

    As such, some of my recent research at various independent blogs paired with what I can see in the options marketplace has led me to believe that the S&P 500 Index (SPX) is going lower in the next 6 – 12 months. I want to be clear that I am not calling for a crash nor am I saying that the S&P 500 Index will remain under pressure, I am just simply calling for a correction in the very near future, although the situation could deteriorate into something much worse potentially.

    However, here are a few data points worth considering which were originally posted by Tyler Durden atwww.zerohedge.com:

    “Revenue results are correlated to dollar strengthening,
    *which has led to weaker revenue results and lower forward guidance that incorporates the FX headwind.”


    “Anecdotally, management commentary implies the dollar strengthening will lower revenue growth by 300-500 basis points. Foreign sales accounted for 33% of aggregate revenue for the S&P 500 in 2013. Based on our earnings model,a 10% strengthening of the trade-weighted dollar lowers S&P 500 2015 EPS by about $3.” To dig deeper into this, click HERE to view the entire article.
    Obviously a strengthening U.S. Dollar is likely to push stocks lower based purely on earnings. However, valuations also matter and according to the same zerohedge.com article, “Consensus long-term growth estimates are slumping… which means multiple expansion is the only way to keep the dream of wealth creation alive.”


    I have to say that I get a great deal of sound, independent information from zerohedge.com which I find to be very useful for formulating trades. One more interesting chart I found over the weekend in a totally different post on their blog is shown below:


    So according to more than one article on zerohedge.com, the fundamental picture for earnings is being weighed down by a strong U.S. dollar. The earnings and valuation backdrop in the same article is also concerning in the intermediate to longer-term. Lastly, when looking at the correlation between the Commodity Index and the Baltic Dry Index, we see a sudden shift that places the S&P 500 Index in a major divergence compared to historic norms. Now that I have leaned heavily on zerohedge.com to handle the fundamental side of my research, it is time to dig into the derivatives side of the trade equation.

    When looking at the S&P 500 Cash Index Options (SPX), another interesting observation is notable. When looking out to the June monthly expiration and Friday’s closing price in the S&P 500 Cash Index of 1,995, an interesting standard deviation skew appears. The June 1,525 Put is exactly 2 standard deviations from the current price on the downside. The June 2,200 Call is also 2 standard deviations from the current price.

    This means that the market is pricing in about 205 points of upside or about 10.27% potential upside. Conversely, the two standard deviation move to the downside is roughly 400 points or about or roughly 20.04% potential downside. I would point out that the marketplace is pricing in a move of almost 2 times the severity on the downside in the S&P 500 Cash Index options. Pair this market expectation with the fundamental data discussed above, and the potential for serious downside does exist.

    I want to be clear that I am already leaning short the S&P 500 Cash Index (SPX) in my portfolio as my beta weighted Delta against the S&P 500 Cash Index (SPX) is negative overall. However, I have not taken an actual short position in the S&P 500 Cash Index (SPX) or its cousin, SPY . . . at least not yet.

    However, after seeing the U.S. Dollar strengthen recently I was able to enter a February call credit spread in EEM (Positive Time* Decay / Profitable if EEM moves lower) for the members only portfolio. That trade will likely be closed for some strong profits in a short period of time. The option trade was taken on January 23rd for a credit of 0.37 per spread.

    Members of our ETF trading newsletter also has a position in an emerging market fund that is setting up for potential 60% move!
    The trade could have been closed on Friday for 0.06 debit per spread. The difference, representing the profit on the trade is 0.31 or $31 per spread. The maximum risk per spread was $113, so the actual return based on maximum risk was 27.43% based on Friday’s closing prices. While this is a great return, not every trade works this well and produces profit this quickly.

    While I will be locking in profits in the EEM February Call Credit Spread early this coming week, I intend to take a similarly bearish trade in the S&P 500 in the near future. I may look to go out as far as March expiration to take in additional premium and to buy myself a little more room on my upside breakeven price. However, I will likely move the overall portfolio to a slightly more negative bias in the near future.

    Going forward, when I highlight trades I intend on discussing the trade structure used in the future as well as an ongoing account as to which trades were profitable and which trades did not work. I am excited about the service I am offering and the new, no-nonsense pricing model. I realize newsletters are really a dying business model, but I simply have too much fun writing about my trades and running the service. Granted a little extra spending money never hurt anyone, but I am having too much fun to quit!

    Happy Option Trading!

    Technical Traders Options Team & Chris Vermeulen


    See more here.

  7. #127
    Senior Member Technician's Avatar
    Join Date
    Feb 2013
    Posts
    220

    2015 Stock Market Forecast And Your Trading Plan

    US Stock Market On The Verge Of Exciting Times

    The S&P 500 stock market has been under strong rotation since mid-2014. Rotation in the stock market is when the trend changes direction from an uptrend to a downtrend or vice versa. But the really exciting part is that after strong rotations in the market similar to what we are experiencing now, the stock market always makes massive moves to profit from shortly after.


    Depending how the price moves during market rotations individual traders, CTAs, hendgefunds and even algorithmic trading systems can generate large profits. But price action must be favorable to meet every ones risk/reward rules.

    Unfortunately during the second half of 2014 the stock market rotation moved in a way that did not generate many trades. But no trades are better than losing trades so it’s not the end of the world, and the good news is there will always be more trades.


    2015 is going to be a BIG year for traders
    and algorithmic trading systems!


    These consolidations (pauses) in the stock market have led to substantial rallies in the stock market of 30+% gains over a six-month period and its looks like it will happen again.


    See more here.

  8. #128
    Senior Member Technician's Avatar
    Join Date
    Feb 2013
    Posts
    220

    His Secret To Day Trading Gold

    It does not matter what your specialty is for trading is we all have our own little trading secrets to help use better time our trades. While many day traders focus on individual stocks like aapl, goog, tsla etc… I like to focus on day trading gold.
    Years ago I shared this little secret on how I get an edge day trading gold and it still amazes me how many of those people still use it today, including myself.

    Time and time again gold traders are given great insight on how and when to day trade gold. I use the free 24hour Kitco gold chart which is shown below, and I watch it like a hawk.

    It is easy to get a feel for how gold moves each day with this chart. Once you get a feel for it and see price patterns repeat themselves week after week, these opportunities quickly become an easy way to add a few trades to your day trading routine.

    This Kitco day trading gold chart is an amazing tool for observing the price of gold over a 3 day time frame. What I’m going to show you is how it can provide opportunities for day trading gold.

    While this chart may not look like a quality trading tool it does provides very detailed information for daytrading gold and for swing traders as they get ready to enter or exit positions. Looking at the chart below you will notice that price has similar price patterns and turning times throughout the day. Often enough the movements are very similar allowing us to take advantage of these price patterns to day trade precious metals, silver included.

    Free Day Trading Gold Charts – By Kitco


    Close Up Of Spot Gold Chart

    The chart below is regular trading hours only 9:30am – 4:00pm ET. You can see the price action following the previous day’s movements. Blue is the previous trading day and Green is the Current day.

    When there are large price movements in gold during these hours I like to take advantage of them using the previous days price action as my guide. If you didn’t notice the Green line (Today) makes the move before the previous days move. Why? Looks to me like there are a lot of other traders out there like me getting ready for these opportunities and because its human nature to want to be first they cause the moves to happen slightly sooner than the previous day. You should factor this into your trading and be ready to take action when price looks to be starting a predicted move.

    Intraday Trading Gold Chart via GLD

    The chart below shows the last 4 intraday sessions for gold using the GLD ETF. As you can see these sessions had very similar price movement. This is a 5 minute chart of gold using GLD. I trade it using the 3 minute chart as it allows the best timing for entering and exiting positions and this 5 minute chart keeps my head clear for the key turning points because it is easy to get caught up in the one minute chart noise and miss the important patterns.

    If you prefer trading spot golc via FOREX/CDF/Spread Betting and you are not a US resident you can use the firm which I have been using for nearly 8 years and the broker is AVAFX. The nice thing about trading this way is that you can trade 24/7, you get a lot of leverage, its commission free trading, and they have 100% signup bonuses to match the amount you deposit.


    Example Day Trading Gold Chart


    Above is the chart of GLD ETF and some actual trades. I am a very conservative trader and I like to lock in profits once I am satisfied with a move or if the chart shows any indication it may go against my position. I tend to exit trades a little too early but my focus is on catching the middle section of a trend because they are the safest areas to trade I think.

    When there are no swing trading setups I focus on finding these intraday day trading gold patterns along with SP500 index and Nasdaq day trades to generate my weekly income.


    See more here.

  9. #129
    Senior Member Technician's Avatar
    Join Date
    Feb 2013
    Posts
    220

    THE NEXT FINANCIAL CRISIS – Part II

    GOLD BEAR MARKET IS ABOUT TO END

    Gold and silver have a little trickier of a situation to navigate and invest for maximum returns over the next 2+ years.

    The most important thing to realize is that when a full blown bear market starts virtually all stocks and commodities drop including gold, silver and oil. Knowing that, investors must be aware that when the stock market starts its bear market the fear will rise and investors will inevitably sell their holdings and this means we could see gold and oil continue to fall much further from these levels before a true bottom is in place.

    Is this time different than the 2008/09 bear market? Yes, this time we have possible wars starting, oil pipelines overseas being cut off, counties and currencies failing and even negative bond yields in some parts of the world – it’s a mess to say the least. There are a lot of things unfolding, most seem to be negative for the economy.

    The currency problems and possible war breakout will be bullish for gold and oil. So if a bear market starts in equities, and a war or currency fails gold and oil should rally while stocks fall.

    But if we don’t have those sever crisis’ then if gold and oil break below their critical support level which is the red line on the charts and a bear market in stocks start you do not want to be long stocks or commodities.

    We have drawn a line in the sand for gold at $1050. If this level is broken then $815 per/ounce is not out of the question. It seems everyone is bullish on precious metals and have been buying like crazy.


    See more here.

  10. #130
    Senior Member Technician's Avatar
    Join Date
    Feb 2013
    Posts
    220

    Index Market Range Points Is Warning Us

    Since the beginning of January 2014 stocks have shown signs of institutional selling. This can be seen in the small capitalization stocks index the Russell 2000. This group of stocks generally leads the S&P 500.

    Most bull market tops in the S&P 500 shown below take 8-12 months to form before it starts to fall in value. So far the market has been under distribution selling meaning the large traders (institutions, hedge funds) is selling their positions to the average investor to be left holding the bag when things go south.

    The chart posted below shows some of my analysis of the SP500 index. This chart shows the 200 day moving average which is a great indicator of the major trend of the market. Green means bull market, red indicates bear market.

    Also you will see the red ATR (Average True Range) indicator at the bottom. This tells us if the average daily movement for the index is high or low. When this red area rises we know there is a large amount of money flowing in and out of the equities market. It takes large amounts of capital to do this and is why the sellers are most likely hedge funds and institutions rebalancing their portfolios for an upcoming trend change.


    If we step back and take a look at the bigger picture using the monthly chart of the S&P 500 we can foresee what is likely to happen in the next 12-36 months. The US stock market is losing momentum which can be seen by the relative strength indicator at the top of the chart.

    Also the support trend line give us a feel on how soon a breakdown in price may happen. It appears to be just months away…


    Taking things one large step further back, roughly 70 years you can see some patterns of that in the past. The question is not will there be a bear market, but how far will it correct?

    The cart below shows a very bullish outlook of a minor correction of 30% in the next 36 months. Also I do have analysis that shows that if we break below the 30% level we could have a 50-60% correction which could trigger a chain reaction of issues including the US bond bubble to burst.


    US Stock Market Conclusion:


    In short, the US stock market continues to grind higher but with several warning signs to investors who know how to spot them.
    There are three ways to play a bear market. The first is to do nothing, which is what most people do as they watch their life savings slowly evaporate right in front of them month after month.

    Second, is to liquidate a large portion of equities and sit safely in cash while others lose money.

    The third and last is to position yourself to profit from a falling market. It’s known that stocks fall 4-7 times faster than they rise, which means you can potentially make 7 years’ worth of profits in just 1-2 years if done correctly.

    These are ways to play a bear market, and I say play because you do need to be a little more active to enter and lock in profits in this market condition. This is something I can help you with through my trade alert newsletter.

    Happy Trading!
    Chris Vermeulen


    See more here.

Page 13 of 22 FirstFirst ... 3 11 12 13 14 15 ... LastLast

LinkBacks (?)


Tags for this Thread

Bookmarks

Posting Permissions

  • You may not post new threads
  • You may not post replies
  • You may not post attachments
  • You may not edit your posts
  •