Page 12 of 22 FirstFirst ... 2 10 11 12 13 14 ... LastLast
Results 111 to 120 of 219
Like Tree1Likes

Stocks, ETFs, Options, Commodities & Currencies

This is a discussion on Stocks, ETFs, Options, Commodities & Currencies within the Analytics and News forums, part of the Trading Forum category; Elliott Wave Theory – Plenty of people will freely offer you advice on how to spend or invest your money. ...


  1. #111
    Senior Member Technician's Avatar
    Join Date
    Feb 2013
    Posts
    220

    Keys to Investor Success – Elliott Wave Theory

    Elliott Wave Theory – Plenty of people will freely offer you advice on how to spend or invest your money. “Buy low and sell high,” they’ll tell you, “that’s really all there is to it!” And while there is a core truth to the statement, the real secret is in knowing how to spot the highs and lows, and thus, when to do your buying and selling. Sadly, that’s the part of the equation that most of the advice givers you’ll run across are content to leave you in the dark about.
    The reality is that no matter how many times you are told differently, there is no ‘magic bullet.’ There is no plan, no series of steps you can follow that will, with absolute certainty, bring you wealth. If you happen across anyone who says otherwise, you can rely on the fact that he or she has an agenda, and that at least part of that agenda involves convincing you to open your wallet.

    In the place of a surefire way to make profits, what is there? Where can you turn, and what kinds of things should you be looking for?

    The answers to those questions aren’t as glamorous sounding as the promises made by those who just want to take your money, but they are much more effective. Things like careful, meticulous research. Market trend analysis. Paying close attention to extrinsic factors that could impact whatever industry you’re planning to invest in, and of course, Elliott wave theory. If you’ve never heard of the Elliott wave, you owe it to yourself to learn more about it.

    Postulated by Ralph Nelson Elliott in the late 1930’s, it is essentially a psychological approach to investing that identifies specific stimuli that large groups tend to respond to in the same way. By identifying these stimuli, it then becomes possible to predict which direction the market will likely move, and as he outlined in his book “The Wave Principle,” market prices tend to unfold in specific patterns or ‘waves.’

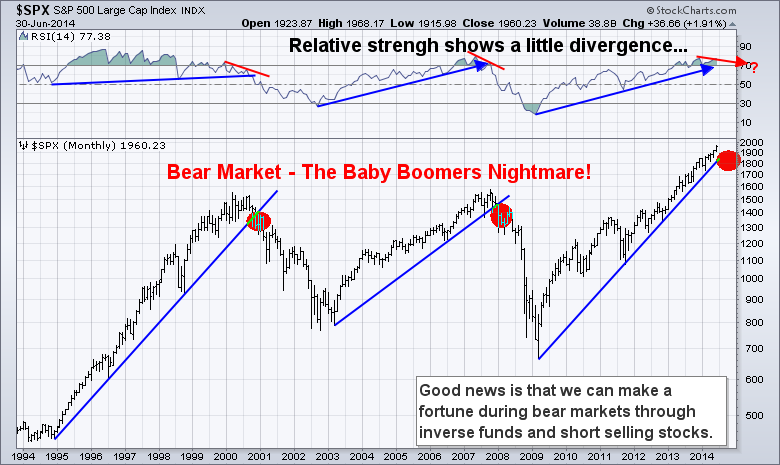
    The fact that many of the most successful Wall Street investors and portfolio managers use this type of trend analysis in their own decision making process should be compelling evidence that you should consider doing the same. No, it’s not perfect, and it is certainly not a guarantee, but it provides a strong framework of probability that, when combined with other research and analysis, can lead to consistently good decisions, and at the end of the day, that’s what investing is all about. Consistently good decision making.

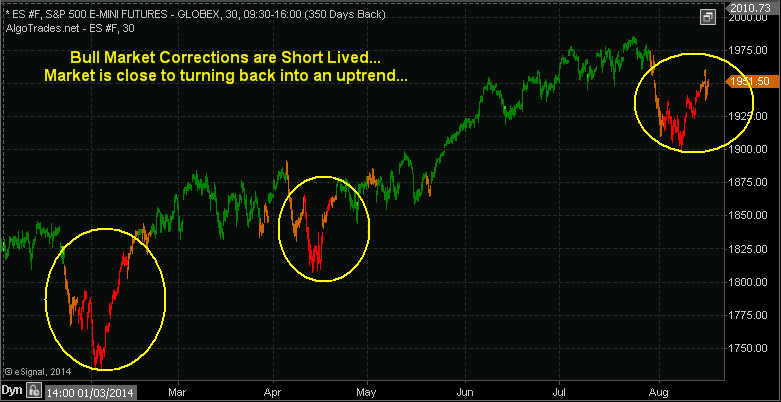
    We use Elliott Wave Theory in real time by looking at the larger patterns of the SP 500 index for example. We deploy Fibonacci math analysis to prior up and down legs in the markets to determine where we are in an Elliott Wave pattern. This helps us decide if to be aggressive when the markets correct, go short the market, or to do nothing for example. It also prevents us from making panic type decisions, whether that be in chasing a hot stock too higher or selling something too low before a reversal. We also can use Elliott Wave Theory to help us determine when to be aggressive in selling or buying, on either side of a trade.

    For many, its not practical to employ Elliott Wave analysis with individual stocks and trading, but it can be done with experience. We instead use a combination of big picture views like weekly charts, Wave patterns within those weekly views, and then zoom in to shorter term technical to determine ultimate timing for entry and exit. This type of big picture view coupled with micro analysis of the charts gives us more clarity and better results.

    One of our favorite patterns for example is the “ABC” pattern. Partially taken from Elliott Wave Theory, we mix in a few of our own ingredients to help with timing entries and exits. This is where you have an initial massive rally or the “A” wave pattern. Say a stock like TSLA goes from $30 to $180 per share, which it did. The B wave is what you wait for and using Fibonacci analysis and Elliott Wave Theory we can calculate a good entry point on the B wave correction. TSLA dropped from $180 to about $ 120, retracing roughly 38% (Fibonacci retracement) of the rally $30 to $180. The B wave bottomed out as everyone was negative on the stock and sentiment was bearish. That is when you get long for the “C” wave. The C wave is when the stock regains momentum, good news starts to unfold, and sentiment turns bullish. We can often calculate the B wave as it relates often to the A wave amplitude. Example is the TSLA “A” wave was 150 points, so the C wave will be about the same or more.

    When TSLA recently ran up to about $270 per share, we were in uber bullish “C” wave mode, and we had run up $150 (Same as the A wave) from $120 to $270. That is when you know it’s a good time to start peeling off shares. Often though, the C wave will be 150-161% of A wave, so TSLA may not have completed it’s run just yet.


    Knowing when to enter and exit a position whether your time frame is short, intermediate, or longer… can often be identified with good Elliott Wave Theory practices. Your results and your portfolio will appreciate it, just look at our ATP track record from April 1 2013 to March 3rd 2014 inclusive of all closed out swing positions.

    We incorporated Elliott Wave Theory into our stock picking starting last April and you can see the results:


    See more here.

  2. #112
    Senior Member Technician's Avatar
    Join Date
    Feb 2013
    Posts
    220

    Limitations of the Elliott Wave

    A large number of investors rely on Elliott wave theory as part of their market trend analysis to help them make good decisions, and it is a very good, very accurate tool. *But it is merely one tool, and as with anything, it is unwise to become over reliant on any single tool or methodology.

    At the root, Elliott wave theory revolves around the idea that by and large, people tend to react to stimuli in the same, predictable ways, and that by identifying the stimuli (either specifically or in broad categories), it then becomes possible to predict market movements. Its namesake, Ralph Nelson Elliott, developed the theory and the analytic tools that surround it in the 1930’s, proposing that market prices unfold in accordance with specific patterns.

    Although the theory has an enormous number of practitioners, and although it is used as part of the analytic methodology of a number of the most successful fund managers in the business, it is not without its critics and drawbacks. Of those criticisms, there are three primary ones, and they must be understood before deciding if this particular analytic tool is right for you.
    The first of the three objections is simply that the theory contradicts the Efficient Market Hypothesis. The counter argument goes that if Elliott’s theory were true and correct then all investors wise to the “trick” would act on it, and in doing so, destroy the very waves they had measured and discovered.

    The second is simply an observation that wave principle in general is too vague to be of specific use since it cannot consistently identify when a wave begins or ends, and that forecasts using this methodology are prone to subjective revision.

    Finally, there are some who believe that the principle is “too dated” to be of use, or even applicable in today’s markets. That technological, governmental, regulatory, economic and social changes have all occurred since the theory was first put forward, but that the theory itself remains unchanged and thus, unable to adapt to its new environment, or serve as a reliable predictor.

    Despite these objections, it should again be noted that many of the top performing fund managers use the theory as part of their own analysis, and it is hard to argue with their success. Whichever side of the fence you’re on regarding the methodology, one thing remains clear. It is unwise to place absolute faith or reliance in any single method, but as part of a larger set of analytic tools, and despite the various criticisms leveled against it, it is impossible to deny its record of success.

    What we do at TheMarketTrendForecast.com is add additional technical analysis tools to our Elliott Wave views to keep ourselves in check. We also tend not to try to label every single squiggle or wave pattern as they occur. Taking a more big picture approach in our opinion works better than getting bogged down in the short term wave counts and details. Often, using a weekly chart can be of help in identifying obvious patterns, which is what I call “zooming out”. We also look at sentiment indicators such as the investment advisor surveys, or what we see on the cover of major media publications for example.

    In addition, we use Fibonacci analysis of prior wave patterns to help identify the most likely foreward scenarios. If we feel that a view we have is getting off track, instead of staying stubborn we will quickly analyze other potential wave counts to see if perhaps we were off the tracks, and then quickly re-adjust and get back up on the rails. We are also not fans of having multiple alternate counts, as that only serves to confuse the investor. Taking one quick example, the first Primary Elliott Wave of this Bull Market from 2009 was 704 points.

    Our opinion then was that Primary wave 3 which we have beginning at 1074 would have to be 704 points multiplied by a Fibonacci 1.618% factor as most likely. From that calculation we can work backwards in our other wave patterns to identify where we are at. Elliott Wave Theory in our opinion was a working blueprint, but not a bible either. You can take the basics of Elliott Wave Theory and then add in a few more elements to improve your results.

    See more here.

  3. #113
    Senior Member Technician's Avatar
    Join Date
    Feb 2013
    Posts
    220

    George W Bush Says Average Investors Need an Automated Trading System

    He mentions that traders and investors need a level playing field to be successful and the only way to do this is with the use of an automated trading system.


    See more here.

  4. #114
    Senior Member Technician's Avatar
    Join Date
    Feb 2013
    Posts
    220

    Explaining Gold Options


    Gold Options Trading

    Gold options allow investors to buy or sell gold bullion at a future date (date of delivery) at a set price. The quantity of gold, date of delivery, and price are all preset. As the name implies, trading gold with options is merely an option, not a requirement, so investors are not obliged to either buy or sell gold at the end of a contract.
    Options shouldn’t be confused with futures contract. While options and futures work the same way (both having a pre-determined price and expiration), the futures contract is an obligation and therefore should be upheld. The difference between gold options and gold futures will be further explained below.
    Gold Option Exchanges


    Investors who wish to deal in gold options can purchase contracts at the New York Mercantile Exchange (NYMEX) and Tokyo Commodity Exchange (TOCOM). NYMEX gold options are traded per 100 troy ounces of gold, while TOCOM gold options are traded per 1000 grams of gold. These numbers are the minimum purchase requirements before a contract can be made and cannot be lowered due to any circumstances.

    Call and Put Options

    With gold options, investors can partake in two different trading classes called calls and puts. It’s technically just buying and selling. Calls are made by investors who think that gold prices will be bullish in the future. On the other hand, puts are made when gold investors predict that gold prices will be bearish. Having good fundamental and technical analysis skills are necessary in order to make a decent call and put decisions. Technical analysis is examining patterns on price charts in order to make a good inference on gold’s price movements. For closer inspection on this, refer to Bullion Vault’s live price graph to see today’s gold price patterns. However, fundamental analysis is aided by being up-to-date with the news and current events that can affect the price movements of gold.

    Gold Options vs. Gold Futures

    Apart from the option/obligation explanation, there are other things that differentiate gold options from options. Here are some of them:

    Minimal losses

    Investment losses in futures trading can be felt immediately due to their margin requirements. It’s also possible for traders to lose more money than they intended because of this. Although, options buyers know exactly what they’re getting. Before investing with options, they know how much they’re getting in the end and their maximum possible loss.

    Leverage Benefits

    It’s easier to gain leverage in options because the premium payable in it is much lower than the minimum required from investors to deal in underlying gold futures. Having leverage may induce reduced profits but at least it won’t be as big as when having borrowed funds in futures.

    See more here.

  5. #115
    Senior Member Technician's Avatar
    Join Date
    Feb 2013
    Posts
    220

    Gold and Silver Prices may be on the Rise Soon


    Based on the Elliot Wave Theory and other indicators, the next wave for a rise in price may be coming.

    An article found on the website NASDAQ back in October of 2013 indicated that the stock market was following the trend of the Elliot Wave Theory. If it had applied the theory correctly, it may have been possible for investors to manage their risks a little better during that period.

    Just like stocks, the correct implementation of the Elliot Wave Theory may be helpful when it comes to trading in precious metals such as gold. An article found on Forbes starts off by illustrating how the theory may be applied to the past price performance of gold. And by looking at past information, it goes on to indicate that a 5-year trend may be established to help guide investors.

    Historically, gold and silver were much closer to each other in value. So it wasn’t surprising that when the price of gold went up, so did silver. This relationship most likely made it easier for investors as they could apply the Elliot Wave Theory to gold and get a similar outlook for silver and vice versa.

    Possible Upward Trend

    Just like gold, the price of silver has been trading at a sideways range of the past few weeks. However, an article written by Vice-president for Business Development Miguel Perez-Santalla suggests that the long-term price chart for silver may be ready to break out. This sentiment may be echoed in a separate article
    entitled “Gold and Silver Ready To Rumble Higher?” where a new wave pattern may be apparent for the precious metals.

    Furthermore, a discussion with Perez-Santalla stated that the number of buyers of precious metals has increased by as much as 85% at BullionVault. This may indicate that people are still concerned about the stability of countries around world, such as those within Europe. With the price of gold expected to test the USD 1,700 barrier, you can find more on silver here for those interested in a different investment.

    Gold and silver have seen their prices rise and drop over the years. However, the application of the Elliot Wave Theory and other indicators may point to a coming rise in prices.


    See more here.

  6. #116
    Senior Member Technician's Avatar
    Join Date
    Feb 2013
    Posts
    220

    Strategies for July Earnings Season

    It’s July earning season and stock rotation time, do you have a plan?

    This period of time in the market always brings rotation from 2nd quarter leaders to new 3rd quarter leaders. The 4th of July light holiday week trading tends to have an upside bias. Then when the following week of trading begins in July we see more volatility as investors brace for quarterly reports and outlooks ahead. Already we are seeing early drops in prior market leaders as we begin full July trading, and a sell off in small cap biotechs on Monday.

    The most volatile periods in the market tend to be in January, April, July, and October and as you can guess those are all quarterly report periods for US listed stocks. Traders are betting on good earnings reports, and even the shorts are betting on bad earnings reports from company to company. Often the best strategy is to avoid holding a stock into an earnings report, and instead perhaps trade into the earnings report but make sure you are out 1-2 days prior. Maybe they report a great quarter and the stock spikes, but in many cases you can get crushed for 10, 15, 20% losses or more following a conference call with a bad outlook. A company can report a great 2nd quarter but the outlook is not strong for the 2nd half, or the profit margins were not quite what Wall Street wanted, or the earnings didn’t beat by enough. Instead, look to buy a good stock after a post earnings pullback and consolidation whether the report was “good” or “bad”. Don’t get burned trying to speculate, speculators lose money in the markets… trade smart!


    See more here.

  7. #117
    Senior Member Technician's Avatar
    Join Date
    Feb 2013
    Posts
    220

    Algorithmic Trading Canada: Algo Trading Firm Located In Canada

    LOOKING FOR AN ALGORITHMIC TRADING SYSTEM THAT DOES ALL THE WORK FOR YOU IN CANADA?


    If you are an investor or trader who lives or works in within Canada and you are interested in algorithmic trading Canada, automatic investing Canada, and automated trading Canada, then look no further. AlgoTrades Systems is a Canadian company located in Ontario, just north of Toronto.

    If you live in one of these Canadian provinces you can use their algorithmic trading system: Ontario, Quebec, Alberta, Nova Scotia, Saskatchewan, Manitoba, New Brunswick, Newfoundland and Labrador, Prince Edward Island (PEI), and even the North West Territories, and Nunavut.

    Unfortunately if you are interested in algorithmic trading and live in British Columbia, you are out of luck. British Columbia is the only location in the world that does not allow algorithmic trading (automated trading systems) for their residents. So much for a free country…

    Research shows that the United States (USA) is number one for people searching algorithmic trading systems, with India being second, and Canada third. I was blown away that Canada was #3 for algorithmic trading.

    ALGOTRADES ALLOWS YOU TO FREE YOURSELF – WE DO THE HEAVY LIFTING FOR YOU

    Say goodbye to searching for hot stocks, figuring out technical patterns, or even reading market opinions. AlgoTrades does all the searching, timing and investing for you using our advanced algorithmic trading systems.

    You only have to hook up your trading account – it is very simple and only takes a few minutes – and then you can finally relax while we let sophisticated algorithms take profits out of the market for you.

    The number of algorithmic traders in some of Canada’s largest cities are vast within these top cities: Vancouver, Calgary, Edmonton, Ottawa, Toronto, Montreal, Winnipeg, Hamilton, Kitchener, Camebridge, Waterloo, St. Catharines, Oshawa, Whitby, Carlington, Victoria, Windsor, Saskatoon, Regina, St. Johns, Sherbrooke, Barrie, Kelowna, and Halifax.


    See more here.

  8. #118
    Senior Member Technician's Avatar
    Join Date
    Feb 2013
    Posts
    220

    Keeping It Simple, Why Short Traders Are Losing Money This Week

    One thing I have talked about several times which cannot be understated is that is the tendency for investors to believe that complex trading ideas and automated trading systems are better than simple, logical ones.
    At first thought this notion is completely understandable. After all, if an idea is fairly simple, how could it possibly be “a secret” and investors not using it yet?

    Successful trading and investing is not about how good you look or how impressive you sound in videos. It’s about what, when and how you do it. It does not matter if you are placing the trades yourself or using an automated trading system. What, when and how the investment is traded is all that matters.

    It’s known that highly intelligent people struggle with the markets because they believe intelligence will improve their trading results. The reality is, they do not thing simple trade setups and strategies that look like they will make easy money, will work. Why? Because they think that the market is complex and thus trades should not be simple to spot and time, therefore the simple ideas should not work.

    In all fairness “simple trading” is not really that simple. Successful trading requires the right kind of simplicity, in the right amount at just the right time. This is what creates the highly profitable investors and automated trading systems.

    Why The Short Traders Are Losing Money This Week:
    They are fighting a bull market which is still pointing to higher prices.

    Take a look at the chart below of the SP500 futures index. You will notice the bars are color coded; this is done by my automated trading system which identifies the market trend which trades should be trading in line with.

    The stock market remains in a full blown bull market. Investors should remain long for time being. On ther other hand active investors should be trading with the current market trend which is shown on the chart.

    Market corrections within a bull market are sharp and short lived. As an active investor you will be luckly to catch one or two short trades during these pullbacks before the uptrend is retaken.

    It is imporatnt to know that eventually one of these bull market corrections will be the staw that breaks the camels back, and kick starts a new bear market. This his why I always move to cash and look to short each of these corrections. We just never know WHEN a full blown bear market will start. If you are holding your positions through these corrections and think you’re a great investor, just wait until the market does acutally breakdown and most of your gains are gone before you realize it. I will admit, its very easy to get lazy with investments after years of rising prices. Lazyness and a the lack of a trading strategy for a falling market is what causes 99% of investors to lose their money.

    I believe in trading defensively. Sure it’s more work, takes time to follow, and there are extra trading commission fees, but its a small price to pay to keep the majority of your gains.


    SP500 Monthly Big Picture Analysis


    Here is the big picture and trend of the SP500 index. Simple fact is, eventually things are going to get really ugly. By stepping back and looking at this chart, it’s clear the market must still fall substantially in value to break below its critical support trend line and before we can confirm a true bear market is in place.

    Do you want to see your nest egg drop 20-30% before you decide to exit? Or do you want to profit from this initial correction when it does happen, and make even more money when the stock market drops for a year or two after taking your account to new all-time highs.


    Keep It Simple Conclusion: Automated Trading Systems?


    The good news is that if you keep things simple by following the intermediate trend, like the color coded chart above, you can keep making money as the market rises to ridiculous new highs, and avoid market corrections, and possibly even profit from them.

    In my next article I will show you a simple trading strategy that I have used for many years to time stock market bottoms and tops for swing trading. Best part is that the data I use is available online for free.

    See more here.

  9. #119
    Senior Member Technician's Avatar
    Join Date
    Feb 2013
    Posts
    220

    The Alibaba IPO May Shine, But Gold is Glistening

    Scotland voted to remain part of the United Kingdom, Alibaba (BABA) is going to become the United States largest initial public offering (IPO), U.S. stock market indexes are up nearly 2% this week, Treasury yields are near lows, and gold and silver prices are getting bludgeoned in the paper market.

    While U.S. financial prognosticators are raving over Alibaba and the IPO, the price action in precious metals and in the broader U.S. equity indexes showed signs of weakness about the time it was announced that Alibaba could start trading in the low to mid eighties.

    The gold and silver charts shown below demonstrates the strange price action in silver futures after the announcement regarding Alibaba’s likely price increase at the open of trading in the stock today.


    The chart below shows gold futures prices during the same time frame as the silver chart above.


    The hype surrounding the Alibaba IPO is almost nauseating. However, it may provide an excellent trade entry into a long position in precious metals. Both gold and silver have been under major selling pressure for several weeks.

    In silver, the selling pressure started around July 15th of this year and the selling has not stopped. Silver futures prices dropped from roughly $21.50 to $18.50 an ounce in about two months. This represents a near 14% decline in the price of silver over the past 2 months.

    Gold prices have also seen strong selling over the same period from July 15th to present. Gold prices fell from around $1,340 per ounce to a recent low slightly below $1,220 per ounce. Gold prices dropped nearly 9%, showing some strong relative strength against silver futures.

    We have been watching the precious metals sector very carefully for several weeks and price action seems poised for a bounce as major support is underneath both silver and gold futures here. A break of these levels would trigger some potentially strong selling pushing metals prices considerably lower. The daily chart of gold futures is shown below:


    The $1,180 – $1,200 price level has shown major support for gold futures prices which is clearly depicted on the weekly chart of gold futures shown above. We are contrarian traders and the price action in precious metals is ripe for a potential bounce. We view the opportunity more as a trading opportunity than an investment opportunity for now, but that could change in the longer term.

    As an options trader, we will likely use a put credit spread using the gold ETF (GLD) as the underlying asset. The trade will have defined risk and will capitalize on higher gold prices, the passage of time, and reduced volatility in GLD options. Recently the options alert service from TheTechnicalTraders has put up some huge winning trades and the track record has been impressive thus far.


    See more here.

  10. #120
    Senior Member Technician's Avatar
    Join Date
    Feb 2013
    Posts
    220

    Leading Sectors Breaking Down – Internet & Social Stocks

    In July I showed talked about the Russell 2K index and how it was underperforming the broad market. I went on to explain what it likely meant was in store for the US stock market this fall. The outlook was negative, just in case you were wondering…

    This week I want to talk about two different sectors that have often lead the broad market in rallies and corrections over the years. These sectors have underperformed the broad market much like that of small cap stocks, and this does not bode well for investors going into fall.

    In the analysis below I use Bollinger bands and trendlines. Using only these tools keeps the charts clean and easy to understand. In short, once a trenline has been broken that is the first early warning that a trend may be coming to an end. The second is the break of a Bollinger band.

    A combination of these can be taken as a trend reversal and likely the start of a multi week or month correction. This will depend on the chart time frame you are reviewing though. I use a similar method to identify trends with my automated futures trading system.

    INTERNET INDEX FUND ANALYSIS


    SOCIAL MEDIA INDEX FUND ANALYSIS


    If you are wondering what exactly these two charts are pointing to… let me share my outlook.

    Because we have seen the support trend lines broken to the downside this month, and the fact that price has pushed more than 2 standard deviations from its norm, the odds favor more downside is to come.

    From years of experience trading price patterns and breakouts I know that when price breaks to the downs side and triggers fear among its investors it is typically your best time to sell short so you can profit from the falling prices. Fear is the most powerful force in the stock market and it must be traded much differently than when prices are rising.

    Although I feel the broad market is still within its uptrend, these two underperforming sectors may just continue to sell lower. Obviously once the broad market rolls over, these sectors should fall even faster to the downside but until then, they could chop around and grind their way down.


    See more here.

Page 12 of 22 FirstFirst ... 2 10 11 12 13 14 ... LastLast

LinkBacks (?)


Tags for this Thread

Bookmarks

Posting Permissions

  • You may not post new threads
  • You may not post replies
  • You may not post attachments
  • You may not edit your posts
  •